stock prices for the large and small capitalizations and in the three different markets, employing prices with both daily and ... to quick changes because of underlying nature of the financial domain and ... calculating the average price. In the real ...
International Research Journal of Engineering and Technology (IRJET)
e-ISSN: 2395-0056
Volume: 05 Issue: 10 | Oct 2018
p-ISSN: 2395-0072
www.irjet.net
Stock Market Prediction Using Machine Learning V Kranthi Sai Reddy1 1Student,
ECM, Sreenidhi Institute of Science and Technology, Hyderabad, India ---------------------------------------------------------------------***---------------------------------------------------------------------
Abstract - In the finance world stock trading is one of the most important activities. Stock market prediction is an act of trying to determine the future value of a stock other financial instrument traded on a financial exchange. This paper explains the prediction of a stock using Machine Learning. The technical and fundamental or the time series analysis is used by the most of the stockbrokers while making the stock predictions. The programming language is used to predict the stock market using machine learning is Python. In this paper we propose a Machine Learning (ML) approach that will be trained from the available stocks data and gain intelligence and then uses the acquired knowledge for an accurate prediction. In this context this study uses a machine learning technique called Support Vector Machine (SVM) to predict stock prices for the large and small capitalizations and in the three different markets, employing prices with both daily and up-to-the-minute frequencies.
highly fluctuating and it effects the investor’s belief. Stock prices are considered to be a very dynamic and susceptible to quick changes because of underlying nature of the financial domain and in part because of the mix of a known parameters (Previous day’s closing price, P/E ratio etc.) and the unknown factors (like Election Results, Rumors etc.). There has been numerous attempts to predict stock price with Machine Learning. The focus of each research projects varies a lot in three ways. (1) The targeting price change can be near-term (less than a minute), short-term (tomorrow to a few days later), and a long-term (months later), (2) The set of stocks can be in limited to less than 10 particular stock, to stocks in particular industry, to generally all stocks. (3) The predictors used can range from a global news and economy trend, to particular characteristics of the company, to purely time series data of the stock price. The probable stock market prediction target can be the future stock price or the volatility of the prices or market trend. In the prediction there are two types like dummy and a real time prediction which is used in stock market prediction system. In Dummy prediction they have define some set of rules and predict the future price of shares by calculating the average price. In the real time prediction compulsory used internet and saw current price of shares of the company.
Key Words: Stock Market, Machine Learning, Predictions, Support Vector Machine 1. INTRODUCTION Basically, quantitative traders with a lot of money from stock markets buy stocks derivatives and equities at a cheap price and later on selling them at high price. The trend in a stock market prediction is not a new thing and yet this issue is kept being discussed by various organizations. There are two types to analyze stocks which investors perform before investing in a stock, first is the fundamental analysis, in this analysis investors look at the intrinsic value of stocks, and performance of the industry, economy, political climate etc. to decide that whether to invest or not. On the other hand, the technical analysis it is an evolution of stocks by the means of studying the statistics generated by market activity, such as past prices and volumes.
Computational advances have led to introduction of machine learning techniques for the predictive systems in financial markets. In this paper we are using a Machine Learning technique i.e., Support Vector Machine (SVM) in order to predict the stock market and we are using Python language for programming. 2. Methodology In this project the prediction of stock market is done by the Support Vector Machine (SVM) and Radial Basis Function (RBF).
In the recent years, increasing prominence of machine learning in various industries have enlightened many traders to apply machine learning techniques to the field, and some of them have produced quite promising results.
2.1 Support Vector Machine A Support Vector Machine (SVM) is a discriminative classifier that formally defined by the separating hyperplane. In other words, the given labeled training data (supervised learning), the algorithm outputs the optimal hyperplane which categorizes new examples. In the two-dimensional space this hyperplane is a line dividing a plane into two parts where in each class lay in either side.
This paper will develop a financial data predictor program in which there will be a dataset storing all historical stock prices and data will be treated as training sets for the program. The main purpose of the prediction is to reduce uncertainty associated to investment decision making. Stock Market follows the random walk, which implies that the best prediction you can have about tomorrow’s value is today’s value. Indisputably, the forecasting stock indices is very difficult because of the market volatility that needs accurate forecast model. The stock market indices are
© 2018, IRJET
|
Impact Factor value: 7.211
Support Vector Machine (SVM) is considered to be as one of the most suitable algorithms available for the time series prediction. The supervised algorithm can be used in
|
ISO 9001:2008 Certified Journal
|
Page 1032
International Research Journal of Engineering and Technology (IRJET)
e-ISSN: 2395-0056
Volume: 05 Issue: 10 | Oct 2018
p-ISSN: 2395-0072
www.irjet.net
both, regression and classification. The SVM involves in plotting of data as point in the space of n dimensions.
a center, so that. Any function which satisfies the property is a radial function.
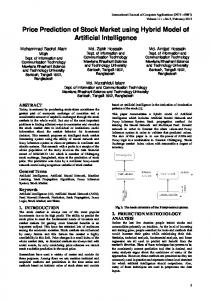
These dimensions are the attributes that are plotted on particular co-ordinates. SVM algorithm draws a boundary over the data set called as the hyper-plane, which separates the data into two classes as shown in the Fig 1.
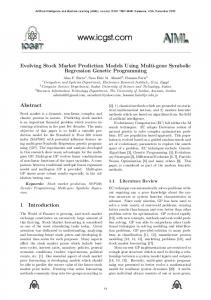
RBF = Local Response Function The RBF Kernel is nothing more than a low-band pass filter, which is well known in Signal Processing as a tool to smooth images. RBF Kernel acts as the prior that selects out smooth solutions. The Radial basis function kernel, is also called as the RBF kernel, or Gaussian kernel, is a kernel that is in the form of a radial basis function (more specifically, a Gaussian function). The RBF kernel is defined as KRBF (x, x’) = exp [-y ||x -x’||2] Where y is the parameter that sets “spread” of the kernel
Fig -1: The Support Vector Machine Decision Making Boundary The hyper-plane is a decision boundary which is later extended or maximized on either side between the data points. Considering the same figure, if µ is some unknown data point and w is vector which is perpendicular to the hyper-plane, then the SVM decision rule will be ………………………………………………………… (1)
Fig -2: RBF Network
The width w of the hyper-plane must be maximized the spread
The RBF units provide a new basis set for synthesizing the output function. The radial basis functions are not orthogonal and are overcomplete.
w = [2/ || w ||] …………………………………………………. (2)
2.3 The Learning Environment
w = (max [2/|| w ||]) ………………………………………... (3)
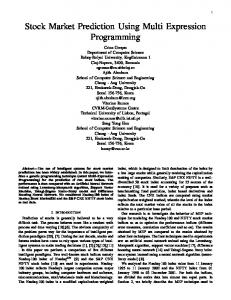
The Weka and the YALE Data Mining Environments were used for carrying out the experiments. The general setup used is as follows:
Applying lagrange’s multiplier as L = 0.5|| w ||2 -∑ L=∑
……………. (4) …………………………… (5)
The updated decision rule will be (∑
)µ+b ≥ 0
2.2 Radial Basis Function (RBF) In the machine learning, the radial basis function kernel, or RBF kernel, is a popular kernel function used in the various kernelized learning algorithms. In particular, it is most commonly used in support vector machine classification. A radial basis function is the real-valued function whose value depends only on the distance from the origin, so that; or alternatively on the distance from some other point, called
© 2018, IRJET
|
Impact Factor value: 7.211
Fig -3: Learning Environment
|
ISO 9001:2008 Certified Journal
|
Page 1033
International Research Journal of Engineering and Technology (IRJET)
e-ISSN: 2395-0056
Volume: 05 Issue: 10 | Oct 2018
p-ISSN: 2395-0072
www.irjet.net
Step 2: In the next step the data value of any stock that can be converted into the CSV file (Comma Separate Value) so that it will easily load into the algorithm.
3. Model Creation and Evaluation Methods In this paper we focus on predicting the Stock Market using Machine Learning model i.e., Support Vector Machine (SVM) by RBF kernel.
Step 3: In the next step in which GUI is open and when we click on the SVM button it will show the window from which we select the stock dataset value file.
3.1 Feature Selection In this project we use four features to predict stock price direction – price volatility, price momentum, sector volatility, and sector momentum. More details are provided in Table 1, styled in the form used by Kim [4].
Step 4: After selecting the stock dataset file from the folder it will show graph Stock before mapping and stock after mapping. Step 5: The next step algorithm calculated the log2c and log2g value for minimizing error. So, it will predict the graph for the dataset value efficiently.
Table 1: Features used in SVM Feature Name
Description
σs
Stock price volatility. This is an average over the past n days of percent change in the given stock’s price per day.
Stock Momentum
This is an average of the given stock’s momentum over the past n days. Each day is labeled 1 if closing price that day is higher than the day before, and −1 if the price is lower than the day before.
σi
Index volatility. This is an average over the past n days of percent change in the index’s price per day.
Index Momentum
This is an average of the index’s momentum over the past n days. Each day it is labeled 1 if closing price that day is higher than the day before, and −1 if the price is lower than the day before
Formula
Step 6: In final step algorithm display the predicted value graph of select stock which shows the original value and predicted value of the stock. 4. RESULTS
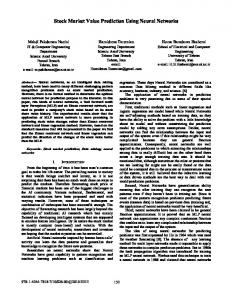
Fig -4: Stock dataset for IBM Inc. in CSV file
3.2 Steps for Stock Market Prediction Step 1: This step is important for the download data from the net. We are predicting the financial market value of any stock. So that the share value up to the closing date are download from the site. Fig -5: Predicted Output by SVM for IBM Inc.
© 2018, IRJET
|
Impact Factor value: 7.211
|
ISO 9001:2008 Certified Journal
|
Page 1034
International Research Journal of Engineering and Technology (IRJET)
e-ISSN: 2395-0056
Volume: 05 Issue: 10 | Oct 2018
p-ISSN: 2395-0072
www.irjet.net
5. CONCLUSION In the project, we proposed the use of the data collected from different global financial markets with machine learning algorithms in order to predict the stock index movements. SVM algorithm works on the large dataset value which is collected from different global financial markets. Also, SVM does not give a problem of over fitting. Various machine learning based models are proposed for predicting the daily trend of Market stocks. Numerical results suggest the high efficiency. The practical trading models built upon our well-trained predictor. The model generates higher profit compared to the selected benchmarks. REFERENCES [1]
[2]
[3]
[4]
[5]
Zhen Hu, Jibe Zhu, and Ken Tse “Stocks Market Prediction Using Support Vector Machine”, 6th International Conference on Information Management, Innovation Management and Industrial Engineering, 2013.M. Wei Huang, Yoshiteru Nakamori, Shou-Yang Wang, “Forecasting stock market movement direction with support vector machine”, Computers & Operations Research, Volume 32, Issue 10, October 2005, Pages 2513–2522. N. Ancona, Classification Properties of Support Vector Machines for Regression, Technical Report, RIIESI/CNRNr. 02/99. K. jae Kim, “Financial time series forecasting using support vector machines,” Neurocomputing, vol. 55, 2003. Debashish Das and Mohammad shorif uddin data mining and neural network techniques in stock market prediction: a methodological review, international journal of artificial intelligence & applications, vol.4, no.1, January 2013
© 2018, IRJET
|
Impact Factor value: 7.211
|
ISO 9001:2008 Certified Journal
|
Page 1035