Stock Price Change Prediction Using News Text Mining
Marcelo Beckmann1, Nelson F.F. Ebecken1a, and Beatriz S. L. Pires de Lima1b 1
Department of Civil Engineering, Federal University of Rio de Janeiro, Centro de Tecnologia - Bloco B, Sala 101 - Ilha do Fundão, PoBox 68506, 21941-909, Rio de Janeiro - RJ - Brazil
Abstract. Along with the advent of the Internet as a way of propagating news in a digital format, came the need to understand and transform this data into information. The advances of data mining and text mining techniques for this purpose brought new opportunities of research applied to financial markets. This work presents a computational framework that aims to predict the changes of stock prices along the day, given the occurrence of news articles related to the companies listed in the Down Jones Index. For this task, an automated process that gather, clean, label, classify, and simulate investments was developed. This process integrates the existing data mining and text algorithms, with the proposal of new techniques of alignment between news articles and stock prices, pre-processing, and classifier ensemble. The result of experiments in terms of classification measures like Accuracy, Precision, Recall, AUC, G-mean, F-measure, and the Cumulative Return obtained through investment simulation outperformed the other results published in the reviewed literature.
This work also argues the techniques of accuracy measure and cross validation applied to this field of research has too few to contribute in terms of investment recommendation for financial market, and the successful use of text mining for this purpose must follow some precepts. Altogether, the developed methodology and results contribute with the state of art in this emerging research field, demonstrating that the correct use of text mining techniques is an applicable alternative to predict price movements in financial market. Keywords: Financial Market, Financial Economics, Stock Market Prediction, Predictive Analytics, Natural
Language Processing, Text Mining, Sentiment Analysis, Data Mining
1. Introduction The advances in data mining and text mining, allied with the velocity and the way the news articles are published, created opportunities to use text mining and sentiment analysis applied to financial market prediction (TMFP). This work aims to provide scientific evidences that data mining and text mining can be used to automatically interpret news articles and learn patterns to predict the market movements, providing this way investment recommendations to be used by traders and automated trading systems to achieve returns. To accomplish this objective, a complete process of data mining and text mining was developed to predict the price movements in the stock market for the 30 companies listed in the Down Jones Industrial Index (DJIA) along the day (intraday). Because the complex and unstable nature of financial markets, the traditional data mining algorithms were not enough to make correct predictions, then a new data preparation technique to deal with imbalanced Marcelo Beckmann, Ph.D., E-mail:
[email protected] a Nelson Francisco Fávilla Ebecken, Ph.D., E-mail:
[email protected] b Beatriz S. L. Pereira de Lima, Ph.D., E-mail:
[email protected]
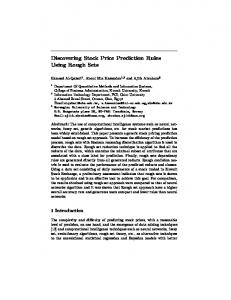
class problem, and a classifier ensemble technique to remove class overlapping was proposed in this work. (Beckmann, Ebecken, & De Lima, 2017) discovered after an extensive survey related to TMFP that around 50% of reviewed works use only Accuracy as a classification measure which is not recommended for imbalance problems (Weiss & Provost, 2001), (Ling, Huang, & Zhang, 2003), (Weis, 2004), (He & Garcia, Learning from Imbalanced Data, 2009), (He & Ma, Imbalanced Learning: Foundations, Algorithms, and Applications, 2013), (Ali, Shamsuddin, & Ralescu, 2013), and others studies use cross validation which also is not recommended for time series (Hastie, Tibshirani, & Friedman, 2003), (Arlot & Celisse, 2010), (Bergmeir, Hyndman, & Koo, 2015). The experiment results for the developed framework are demonstrated in terms of classification measures like Accuracy (Sokolova & Lapalme, 2009), Precision, Recall, AUC (Fawcett, 2004), Gmean (Barandela, Sánchez, García, & Rangel, 2003), and F-measure (Van Rijsbergen, 1979), and an investment simulator was developed to validate the predictions generated by the classifier. The classifier measures and the Cumulative Return obtained with the investment simulation outperformed the other results published in the reviewed literature. 2. Methodology The main processing flow of the proposed methodology can be seen in Fig 1, and this process is repeated for each company listed in the DJIA, with each company owing a predictive model. Only data mining and text mining techniques will be used, and no econometric techniques were applied during this process. All the TMFP process was developed with RapidMiner platform and its respective extensions (Mierswa, Wurst, Klinkenberg, Scholz, & Euler, 2006), and the innovation proposed in this work was developed in a new extension called TradeMiner. 2.1 Data Gathering The process depicted in Fig 1 starts with the gathering of news articles (A), from internet using a web crawler in full operation from January to September of 2013. The source of news came from Yahoo Finance, and Google Finance. Each news article record is composed of the news content in English, the stock symbol, and the published date and time. The stock prices (also known as market data) associated with the DJIA companies were collected minute by minute, using a free web service (B). The market data were labelled (D) as SURGE, for prices with rise >= 75% of the maximum ascent observed during the day, and PLUGE for prices with fall >= 75% of the maximum descent observed during the day. The news articles need to be labelled (E) according the changes in the stock prices τ minutes after its publication, by associating a label r(C) to a new article published at time t, given a set of stock prices labels C={c(t-1), c(t), c(t+1), ..., c(t+τ)}, as explained in the equation (1). 𝑞𝑠 > 𝑞𝑝 𝑎𝑛𝑑 ∆𝐶 > 0, 𝑆𝑈𝑅𝐺𝐸 𝑟(𝐶) = {𝑞𝑠 < 𝑞𝑝 𝑎𝑛𝑑 ∆𝐶 < 0, 𝑃𝐿𝑈𝑁𝐺𝐸 𝑁𝑂𝑇 𝑅𝐸𝐶𝑂𝑀𝐸𝑁𝐷𝐸𝐷
(1)
In equation (1), qs is the number of occurrences of SURGE and qp, the occurrences of PLUNGE,
and the price delta before and after C, represented as C = c(t+τ+1)-c(t-1). The rationale for this alignment proposal is: only a strong turnaround in the stock prices, and the continuous change of prices before and after the time offsets, will make possible to identify the proper characteristics in the news articles for a profitable trading recommendation.
Fig. 1 The text mining modelling process applied to stock price change prediction.
2.2 Data Splitting To maximize the classifier efficacy, the predictive model is trained every week, in a technique known in the literature as sliding window (Dietterich, 2002). The training dataset incorporates 6 months of news articles kept in its chronological order, and the test dataset contains 1 week of new records to evaluate the model. As the processing advances to a new week, the training dataset incorporates the week tested previously, and discards the first week 6 months ago (F). 2.3 Training The news articles are converted into a Bag of Words (BOW) matrix (Harris, 1954). The stop words, terms with size less than two characters, and terms with frequency lower than 2% and greater than 95% were removed (Miner, et al., 2014), (Zhai & Massung, 2016). The use of n-grams (Sidorova & al., 2014), which consists in a series of consecutive words of size n, with the maximum n=3 in this work, helped to reduce the dimensionality and carries the existing semantic from the original text. The discovered n-grams and individual words were represented as an Inverse Document Frequency (TF-IDF) measurement (Robertson, 2004) (G). The most representative BOW features were selected (H) by using a Pearson's Chi-Square statistic (Pearson, 1900), (Forman, 2003). This work aims to predict only the SURGES, then to simplify the decision surface, the PLUNGE examples were merged with the NOT RECOMMENDED (the majority class). To balance the dataset (I), the noisy examples from majority class where removed using a novel technique called KNN Undersampling (Beckmann, Ebecken, & De Lima, 2015). The prepared data is then submitted to a Support Vector Machine (SVM) (Cortes & Vapnik, 1995) Machine Learning algorithm, with the LIBSVM
implementation (Chang & Lin, 2011), and used the Radial Basis Function (RBF) as kernel, with C and Gamma parameters adjusted via grid search (Hsu, Chang, & Lin, 2003). 2.4 Test The test phase consists in to apply the models generated in the training phase into the test dataset. The word list is used to generate a new BOW with TF-IDF measurements (G). The Chi-Square word weights are used to select the most relevant words (H), and the model generated by the SVM algorithm is used to predict the SURGES and NOT RECOMMENDED in the test dataset. This prediction is applied to each new article, but several news articles can be published in the same time offset τ, however, only one recommendation needs to be given for each period of time, then a novel classification ensemble algorithm that uses a Genetic Algorithm (Holland, 1975), (Goldberg, 1989), (Whitley & Sutton, 2012) was developed to mitigate the class overlapping problem, by adjusting the voting threshold for a best recommendation, given the predictive outcome of each news article at that period of time (K). 2.3 Evaluation The output of test phase are the classification results of 30 predictive models, corresponding to 30 stocks listed on DJIA index. These models are evaluated given the G-Mean classification measure. If at least 10 models have a minimal value of G-Mean >= 55.00, then these models are considered stable enough to perform an investment simulation, otherwise the entire TMFP process needs to be adjusted (L). The investment simulation (M) consists in to use the output of (K) to buy stocks using a short-term investment strategy. The simulation is evaluated given its Cumulative Return (CR). Positive CRs indicates these models could be used in a real investment scenario. Further details about this methodology and experiments can be found in (Beckmann, Ebecken, & De Lima, 2017). 3. Experiments To observe how the stock prices are affected by news articles, a set of experiments using the proposed methodology demonstrated the classifier performances when predicting a SURGE or NOT RECOMMENDED movement in the stock prices, in a period of τ=1, 2, 3, and 5 minutes after the news article be published. The maximum averaged results after 10 runs, in terms of classification measures such as Accuracy (99.77), Precision (99.88), Recall (92.74), AUC (67.87), G-mean (92.66), F-Measure (76.00), and CR (21.47) are all associated with τ=1. These values outperformed the other results found after an extensive literature review in (Beckmann, Ebecken, & De Lima, 2017). The source and data for this methodology are open, and the instructions to reproduce these experiments and make new developments are available in (Beckmann, Ebecken, & De Lima, 2018). 4. Conclusions This work presented a computational framework using data mining and text mining to find patterns between the news articles published, and the respective movements in the stock prices, creating a predictive model to forecast the stock prices changes along the day (intraday), for the 30 companies
listed in the DJIA, as published in (Beckmann, Ebecken, & De Lima, 2017). The best experiment used a time offset of 1 minute after the news article was published, and the maximum results in terms of classification measures and Cumulative Return obtained after three months of investment simulation outperformed the other results published in the reviewed literature. These positive results can be accredited to the precise workflow developed, the proper use of F-measure and G-mean as classification measures and process adjusting, and the new algorithms proposed in this work. These results offer evidences that the stock prices movement can be predicted using text mining, and indicates the stock prices started to be affected for the news articles in the few minutes after they are published. Nevertheless, when the news articles are accumulated in a wider period, occurs a loss of signal, probably because there is no mechanism developed to distinguish which news articles are affecting the stock price, being more difficult to obtain a stable model under these conditions. Despite the good results presented in the experiments, the association between news articles and stock prices accumulated in a wider period deserves more attention in a future work. References Ali, A., Shamsuddin, S., & Ralescu, A. (2013). Classification with class imbalance problem: a review. Int. J. Advance Soft Compu. Appl, Vol. 5, No. 3. Arlot, S., & Celisse, A. (2010). A survey of cross-validation procedures for model selection. Statistics Surveys, 4, 40-79. Barandela, R., Sánchez, J., García, V., & Rangel, E. (2003). Strategies for learning in class imbalance problems. Pattern Recognition, 36(3), pp. 849-851. Beckmann, M., Ebecken, N., & De Lima, B. (2015). A KNN Undersampling Approach for Data Balancing. JILSA - Journal of Intelligent Learning Systems and Applications, 7, 104-116. Beckmann, M., Ebecken, N., & De Lima, B. (2017). Thesis: Stock Price Change Prediction Using News Text Mining. Rio de Janeiro, Brazil: Civil Engineering Program/COPPE, Federal University of Rio de Janeiro. Beckmann, M., Ebecken, N., & De Lima, B. (2018). A Practical Guide for Stock Price Prediction Using Text Mining. Rio de Janeiro, Brazil: Civil Engineering Program/COPPE, Federal University of Rio de Janeiro. Bergmeir, C., Hyndman, R., & Koo, B. (2015). A Note on the Validity of Cross-Validation for Evaluating Time Series Prediction. Monash University, Departmnet of Econometrics and Business Statistics. Camerer, C., & Loewenstein, G. (2004). Advances in Behavioral Economics. Princeton University Press. Chang, C., & Lin, C. (2011). LIBSVM : a library for support vector machines. ACM Transactions on Intelligent Systems and Technology, pp. 2:27:1-27:27. Cortes, C., & Vapnik, V. (1995). Support-Vector Networks, Machine Learning. Machine Learning, vol. 20, no. 3, pp. 273-297. Dietterich, T. (2002). Machine Learning for Sequential Data: A Review. Proceedings of the Joint IAPR International Workshop on Structural, Syntactic, and Statistical Pattern Recognition (pp. 15-30). London: Springer-Verlag. Fawcett, T. (2004). ROC Graphs: Notes and Practical Considerations for Researchers. HP Laboratories.
Forman, G. (2003). An extensive empirical study of feature selection metrics for text classification. Journal of Machine Learning Research 3, 1289-1305. Goldberg, D. E. (1989). Genetic Algorithms in Search, Optimization and Machine Learning. Boston, MA: Addison-Wesley. Harris, Z. (1954). Distributional Structure. Word, 10, 146–162. Hastie, T., Tibshirani, R., & Friedman, J. (2003). Model Assessment and Selection. In The Elements of Statistical Learning, Data Mining, Inference and Prediction (pp. 245-247). New York: Springer Series in Statistics. He, H., & Garcia, E. (2009). Learning from Imbalanced Data. IEEE Transactions on Knowledge and Data Engineering, Volume 21 Issue 9, 1263-1284. He, H., & Ma, Y. (2013). Imbalanced Learning: Foundations, Algorithms, and Applications (1st Edition ed.). Wiley-IEEE Press. doi:http://dx.doi.org/10.1002/9781118646106 Holland, J. (1975). Adaptation in Natural and Artificial Systems. Cambridge: MIT Press. Hsu, C. W., Chang, C. C., & Lin, C. J. (2003). A practical guide to support vector classification. Taipei, Taiwan: National Taiwan University. Ling, C. X., Huang, J., & Zhang, H. (2003). AUC: A Better Measure than Accuracy in Comparing Learning Algorithms. In B. C.-d. Yang Xiang (Ed.), Lecture Notes in Computer Science (Vol. 2671). Halifax, Canada. Mierswa, I., Wurst, M., Klinkenberg, R., Scholz, M., & Euler, T. (2006). YALE: Rapid Prototyping for Complex Data Mining Tasks. Proceedings of the 12th ACM SIGKDD International Conference on Knowledge Discovery and Data Mining. Miner, G., Delen, D., Elder, J., Fast, A., Hill, T., & Nisbet, R. (2014). Pratical Text Mining and Statistical Analysis for Non-structured Text Data Applications. Elsevier. Pearson, K. (1900). On the criterion that a given system of deviations from the probable in the case of a correlated system of variables is such that it can be reasonably supposed to have arisen from random sampling. Philosophical Magazine Series, 5. Robertson, S. (2004). Understanding inverse document frequency: On theoretical arguments for IDF. Journal of Documentation. 60 (5), 503–520. doi:10.1108/00220410410560582 Sidorova, G., & al., E. (2014). Syntactic N-grams as machine learning features for natural language processing. Expert Systems with Applications, Vol. 41, Issue 3, 853-860. doi:10.1016/j.eswa.2013.08.015. Sokolova, M., & Lapalme, G. (2009). A systematic analysis of performance measures for classification tasks. Information Processing and Management, 45, 427-437. Van Rijsbergen, C. (1979). Information Retrieval (2nd ed.). Massachusets: Butterworths. Weis, G. (2004). Mining with rarity: a unifying framework. ACM SIGKDD Explorations Newsletter - Special issue on learning from imbalanced datasets Homepage archive Volume 6 Issue 1, 7-19. Weiss, G., & Provost, F. (2001). The Effect of Class Distribution on Classifier Learning: An Empirical Study. Technical Report MLTR-43, Dept. of Computer Science, Rutgers University. Whitley, D., & Sutton, A. (2012). Genetic Algorithms — A Survey of Models and Methods. In G. Rozenberg, T. Bäck, & J. Kok, Handbook of Natural Computing (pp. 637-671). Springer. Zhai, C., & Massung, S. (2016). Text Data Management and Analysis: A Practical Introduction to Information Retrieval and Text Mining. ACM. doi:10.1145/2915031