*Departments of Molecular Biophysics and Biochemistry, â Psychiatry, â¡Diagnostic Radiology and §Neurology, ... label from [1-13C]Glc into glutamate yields a simultaneous in ..... related to glutamatergic synaptic activity demonstrated here is.
Proc. Natl. Acad. Sci. USA Vol. 95, pp. 316–321, January 1998 Neurobiology
Stoichiometric coupling of brain glucose metabolism and glutamatergic neuronal activity NICOLA R. SIBSON*¶, AJAY DHANKHAR*, GRAEME F. MASON†, DOUGLAS L. ROTHMAN‡, KEVIN L. BEHAR§, AND ROBERT G. SHULMAN* *Departments of Molecular Biophysics and Biochemistry, †Psychiatry, ‡Diagnostic Radiology and §Neurology, Yale University School of Medicine, New Haven, CT 06520
Contributed by Robert G. Shulman, November 5, 1997
ment of these two fluxes, we can determine quantitatively the stoichiometry between cerebral Glc metabolism and glutamatergic-synaptic activity in vivo. In the present study, we have used direct 13C NMR spectroscopy to determine the cerebral (primarily cortical) rates of the TCA cycle (VTCA) and Gln synthesis (VGln) simultaneously in the rat in vivo over a range of cerebral activity. From these measurements, the rates of oxidative Glc metabolism and glutamate–neurotransmitter cycling were calculated, enabling determination of the relationship between these fluxes over a range of brain electrocortical activity from isoelectricity to fast, desynchronized patterns that approached the resting awake state.
ABSTRACT To determine the relationship between cerebral Glc metabolism and glutamatergic neuronal function, we used 13C NMR spectroscopy to measure, simultaneously, the rates of the tricarboxylic acid cycle and Gln synthesis in the rat cortex in vivo. From these measurements, we calculated the rates of oxidative Glc metabolism and glutamate–neurotransmitter cycling between neurons and astrocytes (a quantitative measure of glutamatergic neuronal activity). By measuring the rates of the tricarboxylic acid cycle and Gln synthesis over a range of synaptic activity, we have determined the stoichiometry between oxidative Glc metabolism and glutamate– neurotransmitter cycling in the cortex to be close to 1:1. This finding indicates that the majority of cortical energy production supports functional (synaptic) glutamatergic neuronal activity. Another implication of this result is that brain activation studies, which map cortical oxidative Glc metabolism, provide a quantitative measure of synaptic glutamate release.
METHODS Animal Preparation. Experiments were performed by using male Sprague–Dawley rats fasted for '18 h prior to the NMR experiment. Three groups of animals were studied: A, morphine sulfate group, weight 215 6 30 g (n 5 5); B, a-chloralose group, weight 214 6 10 g (n 5 6); and C, sodium pentobarbital group, weight 208 6 15 g (n 5 6). In all groups, anesthesia was induced with 2–3% halothane in 30% oxygen and 70% nitrous oxide, and the animals were tracheotomized and artificially ventilated. The left femoral vein and artery were cannulated for the infusion of [1-13C]Glc or [1,6-13C]Glc and monitoring of arterial blood pressure and gases, respectively. All physiological variables were regulated within normal limits throughout the experiment (PCO2 5 35–42 mmHg; PO2 . 100 mmHg; pH 5 7.40 6 0.05), and core body temperature was maintained at '37°C with a heating pad and temperature-regulated circulating water bath. The scalp was retracted, and burr holes were drilled in the skull '2 mm either side of the interaural line and '2 mm posterior to the bregma for positioning of subdural, carbon fiber-EEG electrodes. Following surgery, ventilation was continued with a mixture of 30% oxygen and 70% nitrous oxide; halothane use was discontinued, and anesthesia was maintained with one of the three anesthetics described below. In group A, anesthesia was maintained throughout the NMR experiment with morphine sulfate (initial dose 50 mgykg, i.p.; supplementary doses 12.5 mgykg every 30 min). In this group, animals also were immobilized with D-tubocurarine chloride (initial dose 0.5 mgykg, i.p.; supplementary doses 0.25 mgy kgyh). The mean arterial blood pressure was maintained at '110 mmHg throughout the experiment. In group B, anesthesia was maintained during the NMR experiment with a-chloralose (initial dose 80 mgykg, i.p.; supplementary doses 20 mgykg every 35–45 min as required), and the mean arterial
Glc metabolism is the major pathway of energy production in the mature brain (1). During brain activation, increases in Glc metabolism directly form the basis of brain functional mapping by using both 2-deoxyglucose autoradiography (2, 3) and positron-emission tomography (4) and indirectly influence signal changes observed with functional MRI (5). Despite the extensive use of these methods for mapping brain function, the mechanism linking Glc metabolism and functional neuronal activity and the fraction of cerebral energy production that supports neuronal function are still unknown. Glutamate is the major excitatory neurotransmitter in the brain (6), and a high percentage of cortical neurons are glutamatergic (7). It has been proposed that a neuronalastrocytic neurotransmitter cycle exists in the brain in which glutamate from the neuronal pool is released into the synaptic cleft as a neurotransmitter, taken up by astrocytes, converted to Gln, and returned to the neuron in this synaptically inactive form where it is converted back to glutamate (6). The development of in vivo 13C NMR spectroscopy has enabled the direct investigation of cerebral glutamate metabolism (8, 9). We recently have shown that the rate of glutamate– neurotransmitter cycling between neurons and astrocytes can be calculated by using the flux of the 13C label from glutamate to Gln in the rat brain in vivo during a [1-13C]Glc infusion (10). Thus, we can obtain an in vivo measure of glutamatergic neuronal activity. In the same experiment, the flux of the 13C label from [1-13C]Glc into glutamate yields a simultaneous in vivo measurement of the cerebral tricarboxylic acid (TCA) cycle rate, from which oxidative Glc consumption can be derived (11, 12). Therefore, by using the combined measure-
Abbreviations: TCA, tricarboxylic acid; VTCA, tricarboxylic acid cycle flux; VGln, rate of Gln synthesis; Vcycle, rate of neuronal-astrocytic substrate cycling; CMRGlc(ox), cerebral metabolic rate for Glc (oxidative); GABA, g-aminobutyric acid. ¶To whom correspondence should be addressed. e-mail: sibson@ mrcbs.med.yale.edu.
The publication costs of this article were defrayed in part by page charge payment. This article must therefore be hereby marked ‘‘advertisement’’ in accordance with 18 U.S.C. §1734 solely to indicate this fact. © 1998 by The National Academy of Sciences 0027-8424y98y95316-6$2.00y0 PNAS is available online at http:yywww.pnas.org.
316
Neurobiology: Sibson et al. blood pressure was maintained above 80 mmHg, throughout. For animals in group C, sodium pentobarbital (120 mgykg, i.p.) was administered over 60 min to achieve an isoelectric EEG, with supplementary doses of 5–10 mgykg every 20 min thereafter to maintain this level of anesthesia. Because of the high anesthetic dose, the mean arterial blood pressure ranged between 50 and 60 mmHg in this group. However, this should still be within autoregulatory limits, and the flow in the arterial line remained high. Following surgery, the animals were placed in the magnet, and after the acquisition of baseline spectra, a [1,6-13C]Glc (group A) or a [1-13C]Glc (groups B and C) infusion was administered by using a protocol described previously (10, 13). The length of the infusion was increased to accommodate slower metabolic rates so that the duration of the infusion was 2 h in group A, 3.5 h in group B, and 7 h in group C. In all cases, a period of 1–1.5 h elapsed between the initial anesthetic dose and the start of the 13C-labeled Glc infusion, thereby enabling a stable state of brain metabolism to be achieved under each anesthetic condition. Blood samples were taken periodically for analysis of total and 13C-labeled Glc. At the end of the NMR experiment, the brain was immediately frozen, in situ, in liquid nitrogen while the animal continued to be mechanically ventilated. All experiments were performed under protocols approved by the Yale Animal Care and Use Committee. NMR Spectroscopy. Nuclear Overhauser effect (NOE)enhanced, 1H-decoupled 13C NMR spectra were acquired on a 7-T horizontal bore spectrometer (Bruker, Billerica, MA) using a dual-tuned surface coil consisting of a 9-mm diameter 13C coil and an outer butterfly 1H coil for decoupling. The operating frequencies were 75.60 MHz for 13C and 300.632 MHz for 1H. The center of the 13C-surface coil was positioned 1–2 mm posterior to the bregma, and because of the dimensions of the coil, the majority of signal was acquired from the cortical tissue. Magnetic field homogeneity was optimized by using an automated localized shim routine for first and second order shim gradients (40–60 Hz linewidth for water). The power for proton decoupling was set for a 200-ms 90° pulse, as described previously (10). WALTZ–16 proton broadband decoupling was applied at 2.5 ppm in the 1H spectrum with an optimized power of 2 W during signal acquisition. A repetition time of 0.5 sec was used, and for NOE enhancement, the same decoupling pulse was applied during the recovery delay but with a maximum power of 0.2–0.3 W. The NOE-enhanced, 1H-decoupled 13C spectra yielded sufficient signal-to-noise at C-4 glutamate and Gln to enable a temporal resolution of 5–10 min in group A, 10–20 min in group B, and 20–40 min in group C. Pre-Glc infusion baseline scans were subtracted from postinfusion spectra to eliminate the broad lipid signal in the spectral region of interest. Plasma and Brain Sample Preparation and Analysis. Perchloric acid extracts of plasma samples and frozen frontoparietal cortex were prepared as described previously (10). Direct 1H NMR spectra of the plasma extracts were acquired on an 8.4-T, AM-360 wide bore spectrometer (Bruker, Billerica, MA) for the determination of plasma Glc fractional enrichment at C-110. In group A, total plasma Glc fractional enrichment was taken to be twice the enrichment measured at C-1 because [1,6-13C]Glc had been infused. 1H-observe, 13C-edited NMR spectra of the brain extracts also were acquired at 8.4 T for determination of brain glutamate and Gln concentrations and fractional enrichments, as described in detail previously (10). Metabolic Modeling. The time courses of cortical glutamate and Gln C-4 labeling with 13C were fitted with a comprehensive mathematical model (12) to yield the TCA cycle rate (VTCA) and the rate of Gln synthesis (VGln) as described previously (10) with the following modifications: 1. Calculation of VTCA: the Km for Glc transport from blood to brain was taken to be 5.6 mM in group C as compared with
Proc. Natl. Acad. Sci. USA 95 (1998)
317
13.9 mM in groups A and B because of the effects of pentobarbital on BBB-Glc transport kinetics (14, 15). In group C, it was assumed that there was no exchange between the observed glutamate pool (neuronal) and the Gln pool because of the elimination of electrical activity. 2. Calculation of VGln: Gln is synthesized from two precursor sources: neuronal glutamate and astrocytic a-ketoglutarate. In both groups A and B, based on our previous work (10), it was assumed that the neuronal glutamate pool was the predominant precursor pool for Gln synthesis, and the analysis was performed as described previously (10, 12). In group C, it was assumed that the large neuronal pool was not serving as a precursor pool for Gln synthesis (in astrocytes) as there was no evidence of electrical activity in the cortex, and therefore, glutamate cycling was assumed to be zero. Consequently, the small astrocytic glutamate pool was taken to be the precursor to Gln synthesis with a 13C fractional enrichment similar to that of pyruvate determined primarily by the plasma Glc fractional enrichment and Glc transport kinetics. Statistical Analysis. ANOVA (16) was used to determine overall significant differences among the three experimental groups for cerebral glutamate and Gln concentrations and the measured metabolic rates, VTCA and VGln. Subsequently, multiple-comparison Bonferroni t tests (16) were used to isolate differences among the individual groups. Linear regression analysis (16) was used to determine the relationship between CMRGlc(ox) and VGln over the range of brain activity studied.
RESULTS Effects of Anesthesia on EEG Activity. The three anesthetic regimes used resulted in differing levels of electrical activity as determined from EEG recordings. Fast desynchronized patterns of EEG activity were evident in animals under morphine sulfate anesthesia (group A), whereas a considerable reduction in EEG frequency and an increase in EEG synchronization was observed in group B (a-chloralose) in comparison to group A. In group C, a sufficiently high dose of sodium pentobarbital was used to achieve and maintain an isoelectric EEG, which was taken as evidence of the suppression of synaptic activity in the cortex. Plasma Glc Concentration and Fractional Enrichment. In all animals plasma Glc levels were rapidly increased by the 13C-labeled Glc infusion from fasted concentrations of 4–5 mM to 9–13 mM, and the levels remained constant at this level throughout the NMR experiment. The plasma-Glc C-1 fractional enrichment increased from 1.1% (natural abundance) to '60% in all animals and was held constant at this level throughout the experiment (Fig. 1). A gradual increase during the 3- to 7-h period was observed for animals in group C. Cerebral Metabolite Pools. Table 1 gives the mean 6 SD concentrations and fractional enrichments of the brain metabolites that were measured at the end of the experiments for each of the groups studied. A trend of decreasing glutamate concentration with reduction in brain activity is shown in Table 1, and the analysis of variance indicated that there was an overall significant difference (F 5 19.96, P , 0.01) among the groups for brain glutamate concentration. Multiplecomparison Bonferroni t tests showed that there was a significant difference (P , 0.005) in glutamate concentration between groups A and C, but not groups A and B, or groups B and C (P . 0.05 in both cases). Analysis of variance revealed no significant differences for brain Gln concentration among the experimental groups (F 5 0.16, P . 0.05). In Vivo 13C NMR Spectra. Selected time points from a set of in vivo 13C spectra for each of the groups are shown in Fig. 2 and clearly demonstrate the slower isotopic turnover rates with reduced brain activity. The two resonances of most interest are those of glutamate and Gln C-4 at 34.3 ppm and 31.6 ppm,
318
Neurobiology: Sibson et al.
Proc. Natl. Acad. Sci. USA 95 (1998) (i) neurotransmitter cycling accounts for all of Gln synthesis and, therefore, Vcycle 5 VGln and (ii) the rate of Gln synthesis measured in group C (VGln(c)) represents a maximum rate of non-cycling-mediated synthesis and, therefore, Vcycle 5 VGlnVGln(c) for each animal in groups A and B. Under both conditions linear regression analysis yielded equivalent slopes (and molar stoichiometric ratios) of 0.87 (r 5 0.89) with y intercepts of 0.16 and 0.12, respectively. These findings indicate that the effect of the assumption (no glutamate cycling in group C) is minimal. The similarity of both y intercepts to the intercept found when the data from group C are included (0.10) suggested that little suppression of metabolism unrelated to glutamatergic transmission had occurred.
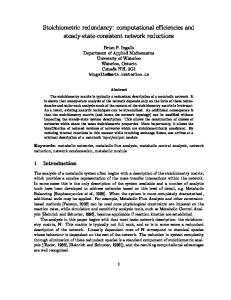
FIG. 1. Graph showing the time courses of plasma Glc C-1 fractional enrichment with 13C for group A (F), group B (}), and group C (Œ). Each point represents the mean for the group and the error bars give 6SD. In group A, the total plasma Glc 13C fractional enrichment was taken to be twice the fractional enrichment measured at C-1 because [1,6-13C]Glc had been infused.
respectively. Also present, but not fully resolved, are peaks from glutamate and Gln C-3 (27.8 ppm and 27.0 ppm, respectively) and C-2 (55.5 ppm and 55.0 ppm, respectively). In addition, in the spectra from group A, the C-6 resonance of Glc can be seen at 61.4 ppm (because of the [1, 6-13C]Glc infusion), and small peaks at 37.5 ppm and 53.1 ppm also are visible, probably arising from aspartate C-3 and C-2, respectively. Determination of Metabolic Rates. The TCA cycle rate (VTCA) and the rate of Gln synthesis (VGln) were measured in each animal, and the mean 6 SD values of VTCA and VGln for each of the three groups are given in Table 1. Analysis of variance followed by multiple-comparison Bonferroni t tests revealed significant differences (P , 0.001) between each of the groups for VTCA and VGln, both of which increased in relation to increasing EEG activity. Under isoelectric conditions VGln was almost completely abolished (,10% of maximum). The rate of cerebral oxidative Glc consumption (CMRGlc(ox)) was calculated from the measured values of VTCA assuming complete oxidation of Glc consumed by the brain via the TCA cycle (11, 12; Table 1). The rate of neurotransmitter cycling (Vcycle) was calculated from the measured rate of Gln synthesis (VGln). It was assumed that in group C, under pentobarbital anesthesia, there was no glutamate cycling between neurons and astrocytes, as all EEG activity had been suppressed. The rate of Gln synthesis measured in this group was taken to be the residual rate of synthesis unrelated to glutamate cycling, and hence, the mean VGln from group C was subtracted from the measured VGln for each rat in groups A and B to determine Vcycle (see Table 1). The implications of this assumption are considered below. The rate of cerebral Glc oxidation was plotted against the rate of neurotransmitter cycling for all of the animals in Fig. 3. A highly significant (P , 0.001) positive correlation was found between CMRGlc(ox) and Vcycle with a Pearson product-moment correlation coefficient, r 5 0.94. The slope of the regression line for CMRGlc(ox) plotted against Vcycle was 1.04 (shown in Fig. 3), and the SE of this slope was 0.10. As described above, for groups A and B Vcycle was calculated under the assumption that Vcycle 5 0 in group C (i.e., glutamate cycling was completely suppressed under the isoelectric conditions used), and the value of VGln in group C was taken to be the basal rate of synthesis independent of glutamate cycling. This assumption ignores both potential contributions to VGln that arise from action potential-independent neurotransmitter release and the possible suppression of metabolism that is not coupled to glutamatergic synaptic transmission. The sensitivity of the relationship between CMRGlc(ox) and Vcycle to this assumption was determined by reanalysis of the data from groups A and B alone. Two limiting conditions were assessed:
DISCUSSION Stoichiometry of Oxidative Glc Metabolism and Glutamate Cycling. The data reported here indicate a 1:1 stoichiometry between cortical Glc oxidation and neurotransmitter cycling (by inference, glutamatergic synaptic activity) above isoelectric conditions. In addition, the component of Glc oxidation that is independent of synaptic activity, as assessed from CMRGlc(ox) under isoelectric conditions ('0.08 mmolyminyg), is only 16% of total Glc oxidation under mild anesthesia ('0.50 mmolyminyg). Previous studies using peripheral neurons have suggested that a substantially smaller fraction of neuronal Glc consumption (5–50% compared with .80% found here) supports functional activity, with the remaining 50–95% being assumed to subserve so-called ‘‘housekeeping’’ functions (17, 18). The much higher percentage of energy consumption related to glutamatergic synaptic activity demonstrated here is consistent with the greater degree of synaptic branching found in cortical neurons of the CNS compared with peripheral systems (7). The linear relationship between Glc oxidation and glutamate–neurotransmitter cycling is in agreement with previous high resolution 2-deoxyglucose-autoradiographic studies of intact neurons that demonstrated that, above a baseline metabolic level, Glc utilization is proportional to stimulation frequency (and by inference neuronal firing and neurotransmitter release) (19, 20). The rate of oxidative Glc metabolism of '0.08 mmolyminyg in group C is somewhat lower than previously reported cortical Glc utilization rates under high dose pentobarbital anesthesia (0.18–0.28 mmolyminyg) (21, 22); however, the longer duration of anesthetic depression in this study prior to the measurement of metabolic rates probably accounts for this difference. Essentially, these results indicated that under mild anesthesia, and by inference the awake state, a major fraction of cortical energy production supports glutamatergic synaptic transmission. Given the direct proportionality between neurotransmitter cycling and Glc oxidation, these results suggested that glutamate–neurotransmitter release is a candidate for the controlling step of cortical Glc consumption. Based on earlier studies in brain slices, the glutamate–neurotransmitter flux between neurons and astrocytes was thought to be small and, consequently, the energy requirements of this flux were discounted as a factor in the control of cerebral Glc consumption. In contrast to those in vitro studies, our in vivo 13C NMR studies have demonstrated that glutamate–neurotransmitter cycling is energetically significant. The data reported here provide direct in vivo evidence that the rate of glutamate–neurotransmitter release is of the same order of magnitude as, and stoichiometrically coupled to, cortical Glc oxidation. A Model of Coupling Between Glc Consumption and Neuronal Activity. The data reported here support a model of coupling between astrocytic Glc consumption and glutamatergic neuronal activity recently proposed by Magistretti and coworkers (23). Based on their recent findings in cultured astrocytes and other data, Pellerin and Magistretti suggest that the majority of glycolytic Glc consumption in the brain occurs
Neurobiology: Sibson et al. Table 1.
Proc. Natl. Acad. Sci. USA 95 (1998)
319
Summary of cerebral metabolite data and metabolic rates [Glutamate] Group
n
(A) morphine sulfate (B) a-chloralose (C) sodium pentobarbital
5 6 6
[Glutamine]
(mmolyg) 11.2 6 1.0* 9.4 6 1.7 8.1 6 0.9*
5.3 6 0.7 5.7 6 1.6 6.0 6 0.6
Glutamate enrichment 0.50 6 0.04† 0.22 6 0.02 0.27 6 0.02
VTCA
VGln
1.01 6 0.23‡ 0.53 6 0.08‡ 0.16 6 0.08‡
0.44 6 0.07§ 0.17 6 0.05§ 0.04 6 0.02§
CMRGlc(ox)¶
Vcycle\
(mmolyminyg) 0.50 6 0.12 0.26 6 0.04 0.08 6 0.04
0.40 6 0.07 0.13 6 0.05 0**
All values are expressed as the mean 6 S.D. *Significantly different (Bonferroni t test, P , 0.005). †The fractional enrichment of glutamate in group A was ' twice that measured in the other groups as [1,6-13C]Glc rather than [1-13C]Glc was infused in these animals. ‡Multiple-comparison Bonferroni t tests demonstrated significant differences (P , 0.001) among each of the groups for VTCA. §Multiple-comparison Bonferroni t tests demonstrated significant differences (P , 0.001) among each of the groups for VGln. ¶The rate of cerebral oxidative Glc consumption (CMRGlc(ox)) was calculated from the measured VTCA. \The rate of neurotransmitter cycling (Vcycle) was determined from the measured rate of Gln synthesis (VGln). **Vcycle in group C was assumed to be zero as all electrical activity (determined from EEG recordings) had been eliminated.
in glial cells, which subsequently export lactate to neurons as a substrate for oxidative metabolism. Astrocytic uptake of one glutamate molecule with cotransport of two or three sodium ions (24, 25) requires one ATP molecule to restore the transmembrane sodium (and potassium) gradients via the Na1yK1-ATPase (see Fig. 4). Pellerin and Magistretti (23) hypothesized, therefore, that astrocytic uptake of glutamate drives glycolysis and energy production in the astrocytes via the Na1yK1-ATPase, thus coupling neuronal activity and Glc metabolism. We can extend this hypothesis further because astrocytic conversion of glutamate to Gln (in which form it is returned to the neuron) also requires one ATP per glutamate molecule. Therefore, a total of two ATP molecules will be hydrolyzed within the astrocyte per molecule of glutamate taken up following release from the neuron. This energetic cost can be balanced exactly by the glycolytic production of two ATP molecules per Glc molecule (Fig. 4). If this extended model of neuronal-astrocytic coupling is correct, and astrocytic glycolysis (above a basal level) is driven solely by glutamate cycling, then a 1:1 stoichiometry between astrocytic Glc consumption and glutamate uptake is expected. The rate of glutamate uptake will be directly proportional to the rate of glutamate release and cycling (assuming that negligible preand postsynaptic glutamate uptake occurs; ref. 25, 26). There-
fore, the 1:1 stoichiometry predicted by the proposed model is in agreement with the results of this study. In theory, therefore, the glycolytic ATP production per Glc molecule is sufficient to support the astrocytic energy-requiring processes that are linked to synaptic glutamate release (glutamate uptake and conversion to Gln). Consequently, the majority of ATP produced from Glc metabolism, through pyruvate oxidation in the TCA cycle, is available to support other processes involved in neuronal activity. The direct relationship between oxidative Glc metabolism and glutamate cycling found in this study suggested that these processes were involved in glutamate release and, therefore, located primarily in the region of the synapse. In support of this proposal, in vitro studies indicate that increased Glc uptake in response to functional stimulation is localized primarily in cortical layers rich in dendrites, nerve terminals, and associated glial endprocesses but not in layers associated with cell bodies (20, 27). Contribution of GABA to Neurotransmitter Cycling. The metabolic model used in the analysis of the data pertains only to glutamate–neurotransmitter cycling. However, g-aminobutyric acid (GABA), the major inhibitory transmitter in the brain, also is believed to participate in a neuronal-astrocytic cycle (28, 29), and could contribute to the rate of Gln synthesis. In contrast to the actions of a-chloralose and morphine,
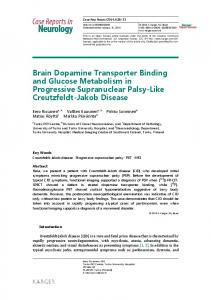
FIG. 2. Selected timepoints from sets of 1H-decoupled 13C NMR spectra of the rat brain in vivo at 7.0 T, acquired during a 13C-labeled Glc infusion (pre-infusion baseline scans subtracted). Representative spectra are shown for animals from each of the experimental groups: A, morphine sulfate; B, a-chloralose, and C, sodium pentobarbital. In group A, a [1,6-13C]Glc infusion (2h) was administered, whereas in groups B and C, a [1-13C]Glc infusion (3.5 h and 7 h, respectively) was used. The timepoints on the left of the figure refer to the first 5 spectra from groups A and B, whereas those on the right refer to the spectra from group C and the later spectra from A and B. The visible resonances are glutamate C-4 (34.3 ppm; indicated by p), Gln C-4 (31.6 ppm), unresolved glutamate and Gln C-3 (27.8 ppm and 27.0 ppm, respectively) and unresolved glutamate and Gln C-2 (55.5 ppm and 55.0 ppm, respectively). In addition, in the spectra from group A the C-6 resonance of Glc was present at 61.4 ppm (because of the [1, 6-13C]Glc infusion), and small peaks at 37.5 ppm and 53.1 ppm also were visible, probably arising from aspartate C-3 and C-2. The time resolution was 10 min for spectra shown from groups A and B and 20 min for spectra from group C.
320
Neurobiology: Sibson et al.
Proc. Natl. Acad. Sci. USA 95 (1998) ,30%. Because GABA is also taken up by astrocytes with sodium cotransport and (following transamination to glutamate) is converted to Gln, the energetic requirement of GABA cycling within the astrocyte may be similar to that of glutamate cycling.
SUMMARY AND CONCLUSIONS
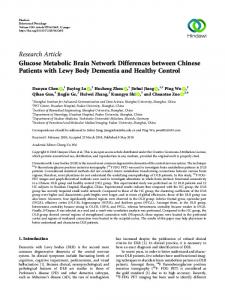
FIG. 3. Graph demonstrating the correlation between the rate of oxidative Glc consumption (CMRGlc(ox)) and the rate of glutamate– neurotransmitter cycling (Vcycle). CMRGlc(ox) was derived from the measured rate of the TCA cycle (VTCA), and Vcycle was determined from the measured rate of Gln synthesis (VGln) as described in the text. Data from all of the animals are shown (group A, n 5 5; group B, n 5 6; group C, n 5 6). A significant positive correlation (P , 0.001) was found between CMRGlc(ox) and Vcycle. The equation of the regression line shown is y 5 1.04x 1 0.10, with a Pearson product-moment correlation coefficient, r, of 0.94. The SE of the slope and intercept are 0.10 and 0.02, respectively.
pentobarbital is known to enhance GABAergic inhibition (30) and could, therefore, increase GABA cycling. To determine the effect of GABA–neurotransmitter cycling on the relationship between CMRGlc(ox) and Vcycle, we considered the case in which all Gln synthesis was coupled to neurotransmitter (GABA or glutamate) cycling. An upper estimate of the contribution of GABA–neurotransmitter cycling to Vcycle (5 VGln in this case) was estimated for groups A and B from the rate of GABA synthesis (0.13 VTCA) (31, 32), based on the assumption that all synthesized GABA participates in the neuronal-astrocytic cycle and no pre- or postsynaptic uptake occurs. For group C, GABA–neurotransmitter cycling was taken to be equal to the measured value of VGln under the assumption that all glutamate cycling had been suppressed. Linear regression analysis of the data adjusted for GABA cycling yielded a slope, CMRGlc(ox)yVcycle, of 1.29 with a y intercept of 0.07 (r 5 0.90). Therefore, the inclusion of a maximum contribution of GABA–neurotransmitter cycling to Vcycle increases the slope and molar stoichiometric ratio by
We have demonstrated in the rat cerebral cortex, in vivo, that a stoichiometric relationship exists between the fluxes of glutamate–neurotransmitter cycling and oxidative Glc metabolism. Under mild anesthesia, glutamate–neurotransmitter cycling (a measure of glutamatergic synaptic activity) accounts for .80% of total Glc oxidation, suggesting that synaptic glutamate release may be a control step for cortical Glc consumption. Previously, changes in cerebral Glc metabolism have been qualitatively linked to alterations in functional activity. Our results demonstrate that such changes in Glc metabolism in the cortex are quantitatively coupled to a specific neurophysiological process of functional activity, glutamate–neurotransmitter release. The authors gratefully acknowledge the technical assistance of Terry Nixon, Peter Brown, Scott McKintyre, and Roger Boucher. We also thank Dr. O. A. C. Petroff and Dr. J. Shen for helpful discussions concerning morphine anesthesia and metabolic modeling, respectively. This study was supported in part by National Institutes of Health Grants 2 RO1-DK27121, R29-NS32126, 1 RO1-NS34813, and PO1-HD32573 and the National Center for Research Resources National Institutes of Health Grant P41-RR07723. 1. 2. 3. 4. 5. 6. 7. 8. 9. 10. 11. 12. 13. 14. 15.
FIG. 4. Schematic diagram of the possible mechanistic coupling between neuronal glutamate release and glycolytic Glc consumption in astrocytes. The two molecules of ATP required by astrocytes to take up glutamate and convert it to Gln can be exactly balanced by the two molecules of ATP produced through glycolysis of one Glc molecule. Abbreviations: Gln, glutamine; Glu, glutamate; Glc, glucose; Lac, lactate; VGln, rate of Gln synthesis; Vcycle, rate of neurotransmitter cycling.
16. 17.
18.
Siesjo ¨, B. K. (1978) Brain Energy Metabolism (Wiley, New York). Sokoloff, L., Reivich, M., Kennedy, C., Des Rosiers, M. H., Patlak, C. S., Pettigrew, K. D., Sakurada, O. & Shinohara, M. (1977) J. Neurochem. 28, 897–916. Schwartz, W. J., Smith, C. B., Davidsen, L., Savaki, H. & Sokoloff, L. (1979) Science 205, 723–725. Phelps, M. E., Mazziotta, J. C. & Huang, S. C. (1982) J. Cereb. Blood Flow Metab. 2, 113–162. DeYoe, E. A., Bandettini, P., Neitz, J., Miller, D. & Winans, P. (1994) J. Neurosci. Methods 54, 171–187. Erecin ´ska, M. & Silver, I. A. (1990) Prog. Neurobiol. 35, 245–296. Shepherd, G. M. (1994) Neurobiology (Oxford Univ. Press, New York). Gruetter, R., Novotny, E. J., Boulware, S. D., Rothman, D. L., Mason, G. F., Shulman, G. I., Shulman, R. G. & Tamborlane, W. V. (1992) Proc. Natl. Acad. Sci. USA 89, 1109–1112. Gruetter, R., Novotny, E. J., Boulware, S. D., Mason, G. F., Rothman, D. L., Shulman, G. I., Prichard, J. W. & Shulman, R. G. (1994) J. Neurochem. 63, 1377–1385. Sibson, N. R., Dhankhar, A., Mason, G. F., Behar, K. L., Rothman, D. L. & Shulman, R. G. (1997) Proc. Natl. Acad. Sci. USA 94, 2699–2704. Mason, G. F., Rothman, D. L., Behar, K. L. & Shulman, R. G. (1992) J. Cereb. Blood Flow Metab. 12, 434–447. Mason, G. F., Gruetter, R., Rothman, D. L., Behar, K. L., Shulman, R. G. & Novotny, E. J. (1995) J. Cereb. Blood Flow Metab. 15, 12–25. Fitzpatrick, S. M., Hetherington, H. P., Behar, K. L. & Shulman, R. G. (1990) J. Cereb. Blood Flow Metab. 10, 170–179. Gjedde, A. & Rasmussen, M. (1980) J. Neurochem. 35, 1382– 1387. Pardridge, W. M., Crane, P. D., Mietus, L. J. & Olendorf, W. H. (1982) J. Neurochem. 38, 560–568. Glantz, S. A. & Slinker, B. K. (1990) Primer of Applied Regression and Analysis of Variance (McGraw–Hill, New York). Creutzfeldt, O. D. (1975) in Brain Work: The Coupling of Function, Metabolism and Blood Flow in the Brain, Alfred Benzon Symposium VIII, eds. Ingvar, D. H. & Lassen, N. A. (Munksgaard, Copenhagen), pp. 21–46. Gjedde, A. (1993) in Functional Organisation of the Human Visual Cortex, Wenner–Gren International Symposium Series Vol. 61,
Neurobiology: Sibson et al.
19. 20. 21. 22. 23. 24. 25.
eds. Gulya´s, B., Ottoson, D. & Roland, P. E. (Pergamon, Oxford), pp. 291–306. Yarowsky, P., Kadekaro, M. & Sokoloff, L. (1983) Proc. Natl. Acad. Sci. USA 80, 4179–4183. Kadekaro, M., Crane, A. M. & Sokoloff, L. (1985) Proc. Natl. Acad. Sci. USA 82, 6010–6013. Crane, P. D., Braun, L. D., Cornford, E. M., Cremer, J. E., Glass, J. M. & Olendorf, W. H. (1978) Stroke 9, 12–18. Sakabe, T., Tsutsui, T., Maekawa, T., Ishikawa, T. & Takeshita, H. (1985) Anesthesiology 63, 262–266. Pellerin, L. & Magistretti, P. J. (1994) Proc. Natl. Acad. Sci. USA 91, 10625–10629. Bouvier, M., Szatkowski, M., Amato, A. & Attwell, D. (1992) Nature (London) 360, 471–474. Schousboe, A. & Westergaard, N. (1995) in Neuroglia, eds. Kettenmann, H. & Ransom, B. R. (Oxford Univ. Press, New York), pp. 246–258.
Proc. Natl. Acad. Sci. USA 95 (1998) 26. 27. 28. 29. 30. 31. 32.
321
Rothstein, J. D., Dykes-Hoberg, M., Pardo, C. A., Bristol, L. A., Jin, L., Kuncl, R. W., Kanai, Y., Hediger, M. A., Wang, Y., Schielke, J. P. & Welty, D. F. (1996) Neuron 16, 675–686. Kennedy, C., Des Rosiers, M. H., Sakurada, O., Shinohara, M., Reivich, M., Jehle, J. W. & Sokoloff, L. (1976) Proc. Natl. Acad. Sci. USA 73, 4230–4234. Reubi, J. C., Van den Berg, C. J. & Cuenod, M. (1978) Neurosci. Lett. 10, 171–174. Paulsen, R. E., Odden, E. & Fonnum, F. (1988) J. Neurochem. 51, 1294–1299. Willow, M. & Johnston, G. A. R. (1983) Int. Rev. Neurobiol. 24, 15–49. Balazs, R., Machiyama, Y., Hammond, B. J., Julian, T. & Richter, D. (1970) Biochem. J. 116, 445–467. Patel, A. J., Johnson A. L. & Balazs R. (1974) J. Neurochem. 23, 1271–1279.