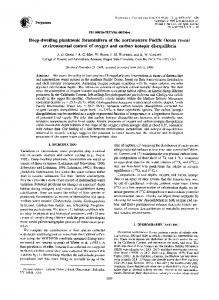
(Received July 13, 1981; accepted in revised form March 4, 1982). Abstract-The. Sr/Ca ratio ... thermal processes, supplies Ca at a rate comparable to that of river input (Hart, ..... sink of the two elements, then at steady-state the following would ...
0016.7037/82/07128l-IZf03.00/0
Geochimica d Cosmochimica Acfa Vol. 46, pp. 1281 to 1292 B Pergamon Press Ltd.1982. Printed inU.S.A.
Strontium-calcium
ratios in Cenozoic
planktonic
DAVID W. GRAHAM, MICHAEL L. BENDER, DOUGLAS F. WILLIAMS,* Graduate
School (Received
of Oceanography, July
University
13, 1981; accepted
of Rhode
Island,
in revised form
foraminifera
and LLOYD D. KEIGWIN, JR.t Kingston,
RI 02881
March 4, 1982)
Abstract-The Sr/Ca ratio and other parameters have been measured in fossil planktonic foraminifera from the Atlantic and Pacific Ocean basins in order to evaluate the Sr/Ca ratio of seawater during the last 75 million years. Results on well-preserved samples indicate that the ratio has increased to its present value by IO-15% during the Cenozoic, and that minima occurred between 55-45 Ma and IO-5 Ma, when the ratio was 15-25% less than at present. The long-term increase may reflect either decreasing deposition of aragonite with a high Sr/Ca ratio in shallow seas, or decreasing seafloor spreading rates and consequently decreasing hydrothermal supply of Ca during the Cenozoic. Other geologic evidence suggests that the Eocene minimum (near 50 Ma) may have resulted from increased aragonite sedimentation, while the Late Miocene minimum (between 10-5 Ma) may have been caused by an increased rate of seawater-basalt exchange when seafloor spreading rates increased on the East Pacific Rise near 10 Ma. INTRODUCTION THE history
of seawater chemistry has been a topic of considerable interest (Rubey, 195 1; Broecker, 1971; Holland, 1974). Temporal variations in the oceanic isotopic composition of strontium (Dasch and Biscaye, 1971; Peterman et al., 1970; Veizer and Compston, 1974; Brass, 1976), sulfur (Holser and Kaplan, 1966), carbon (Broecker, 197 1; Bender and Keigwin, 1979), and oxygen (Emiliani, 1954; Shackleton and Kennett, 1975; Savin et al., 1975) have been documented. Less work has been done on the elemental composition of ancient oceans. Turekian ( 1955) and Lowenstam ( 196 1) determined the Sr/Ca ratio of calcareous fossils and sediments as an indicator of the seawater ratio. Our primary objectives were to determine the detailed record of Sr/ Ca variations during the Cenozoic and to interpret the record in terms of the geochemical processes fixing the ratio. Attempts to infer the seawater Sr/Ca ratio from that of biogenic calcite rest on the assumption that the calcite ratio reflects the seawater ratio. This assumption is now strongly supported by the following arguments. First, the Sr distribution coefficient, Dsr (-(Sr/Ca)c,co,/( Sr/Ca)scawa,er) in biogenic calcite is about 0.16 + 0.02 for organisms as different as molluscs (Thompson and Chow, 1955; Turekian and Armstrong, 1960; Pilkey and Goodell, 1963), coccolithophorids (Thompson and Bowen 1969), and foraminifera (Bender et al., 1975). Second, this distribution coefficient apphes over a wide range of solution Sr/Ca, Mg/Ca, and Na/Ca ratios (Lewin and Chow, 1961; Lorens and Bender, 1980). Third, the empirical biogenic distribution coefficient of 0.16 is
* Present address: Department of Geology, University of South Carolina, Columbia, SC 29208 7 Present address: Woods Hole Oceanographic Institution, Woods Hole, MA 02543
close to the inorganic distribution coefficient determined experimentally for high CaCOX precipitation rates (characteristic of biogenic calcite) in dilute solutions (Lorens, 198 1). At a given time, the Sr/Ca ratio of seawater depends on the relative input and removal rates of these elements. The main source for both elements is rivers, primarily from the weathering of limestone, and the main sink is calcite sedimentation. A secondary source and a secondary sink have Sr/Ca flux ratios much different from the primary source and sink. The seconda:ry source, ridge crest and flank hydrothermal processes, supplies Ca at a rate comparable to that of river input (Hart, 1970; Wolery and Sleep, 1976; Corliss et al., 1979; Edmond et al., 1979) but little or no S,r is added in this process (i.e., the hydrothermal Sr/Ca flux ratio is much less than the river ratio; Humphris and Thompson, 1978b; Menzies and Seyfried, 1979; Edmond et al., 1979; Albarede et al., 198 1). The secondary sink, sedimentation of aragonite (which has a Sr/Ca ratio 2-6 times the calcite ratio), selectively removes Sr. Consequently, large changes in the rates of mid-ocean ridge hydrothermal processes or aragonite sedimentation would be reflected in the seawater Sr/Ca ratio. This picture is complicated by two facts. First there is another secondary Sr sink which is poorly understood, reflected by high sedimentary Sr concentrations, in part associated with MnO on fine grained pelagic carbonates, and in part in an unknown phase (Turekian, 1964). Second, Sr is recycled within the ocean due to carbonate recrystallization during diagenesis. We assume that these processes act at constant rates and involve a constant fraction of the Sr, so that Sr removal by these processes is effectively decoupled from the rest of the Sr and Ca cycles. We have determined the Na/Ca ratios in our samples, but inferring seawater Na/Ca ratios from fossil chemistry is very problematic. First, White (I 978) has shown that, in dilute solutions, Na/Ca of calcite
1281
D. W.
1282 180"
GRAHAM
120*
ET .4L
60'
O0
60"
60’
60’
FIG. 1. Map of sample sites studied. Numbers are DSDP site locations. Doherty core collection sites. V- Vema; RC----Robert Conrad; E- Eltanin. with the i/ power of the solution ratio. If this result holds for biogenic calcites, fossils will be insensitive indicators of the seawater Na/Ca ratio. Second, there is some evidence that the Na distribution coefficient ( =(Na/Ca)cltcit,/(Na/Ca),,,,,,,) is dependent on the Mg/Ca ratio (Lorens and Bender, 1980). Third, the nature of Na incorporation into calcite is not nearly as well understood as that of Sr. Na is homogeneously distributed in foraminiferal calcite and is dominantly associated with CaCO, (Bender et al,, 1975). However, since Na is a +I ion it may occur partly in a separate mineral varies
phase (White, 1978; Kitano ef al., 19’75). Selective removal of this more soluble phase probably occurs during early diagenesis, thereby introducing more noise into the data with varying degrees of dissolution (Lorens et al., 1977). Also, inorganically produced
calcites have lower Na/Ca ratios than biogenic ones (White, 1978), consistent with a decrease during recrystallization (Land and Hoops, 1973). Thus, at present there is little hope for inferring Ca ratios from calcitic fossils.
seawater
Na/
METHODS Sample
selection
and an~l.~~s~s
Locations of Deep Sea Drilling
Project (DSDP) and Lamont-Doherty Geological Observatory core sites used are shown in Fig. I. Sediment samples were disaggregated in a hot Calgon solution, sieved through a 63 micron screen, and dried at 50°C Whole tests of planktonic foraminifera were then selected from the >I80 micron fraction. In many samples a mixed assemblage of species was analyzed to reduce picking time and intraspecific variability in the trace element ratios resulting from possible vital effects. Where mixed species were analyzed specimens were randomly picked from the whole assemblage. Monogeneric samples of Orbulina were also analyzed from the Middle Miocene to Recent at DSDP 157. 208, and 310 in order to obtain
tetters
dcsignntc
1Ltw~~n:
a detailed record of the Sr/Ca ratio for the i.+:;; ib 1 iit y. Orbuiina samples from sites 208 and 310 were split open with a needle before ultrasonic cleaning, then reexamined microscopically to assure that only the foram 5kelcta %CI-c analyzed. Globigerinoides sacculifer was selected for momspecific analysis at DSDP 158 because Orb~ljnu was rari: in many sections there. About 10% of some samples w;~:~ dissolved with 0.01 N HNO, in order to remul’c surficial coatings. Typically, samples ranged in weight t’rom 1. 2 mg All samples were ultrasonically cleaned of adhering muterial in deionized water for a few seconds (longer sonication caused sample fragmentation). Suspended foraminiferat fragments or clay minerals were decanted with a syringe, Samples were rinsed with 1 ml of deionized waler and dried in a laminar flow hood. They were then analyzed hy neutron activation for Ca, Sr, Na, Al. Cl, and Mn using the pr+ cedure described by Bender et al i 1975) Chronologjs The time scale used is based on the work of Berggren ( 197 1 f, Berggren and van Couvering (19741, andWinterer (1973). Where possible the foraminiferal zonations of Blow (1969) were used for the Cenozoic, with changes for thn: Middle Miocene adapted from van Andei cf al. ! 19751.Age assignments within biostratigraphic interval+. were estimated to be proportional to the depth of sample location between the upper and lower boundary ages ( Davies et ai,. 1977). If the exact position of the upper and/or lower boundary was missing due to discontinuous cormg or poor biostratigraphic control at a particular site, the boundaryposition was taken as the midpoint of the inter%al between known boundaries. The resulting uncertainties in the calculated absolute ages are estimated to be +-I million years back to 10 Ma, *3 million years back to 50 Ma, and greater than or equal to f5 million years from 50.-105 Ma. The foramin~fera~ zones of Kaneps ( 1973) were used for DSDP I57 and 158 because the zonal markers common to other locations are rarely present in the Panama Baslrr due t; dissolution. Because the fauna at DSDP 3 IO is characters istic of higher latitudes, and to maintain consisLency with age estimates elsewhere, ages of samples above 69.5 m downcore were estimated using the zonai boundaries of Keller (1978), and below 49.5 m they were estimated usin:: the zonal boundaries of Vincent ( 1975 )
Sr/Ca
1283
IN FORAMINIFERA
2.0 . 20
r
-lOno m
1
I
1
I
0
;
1.6
.-0
.
c
x
0
.
0,
20
40
60
,
I
L
Sr/Ca ratios 0 Y
Recent
rn
‘\A,
0.8
Indian Ocean Foraminifera
I
0
I
1
I
20
I
1
I
60
40 EST1 MATED
AGE
1.
A
‘.
.\A
..
4)
\c
80
I00
( m. y. 1
FIG. 2. Sr/Ca atom ratio in fossil planktonic foraminifera vs. estimated age (Ma). Only samples with counting error < +lO% in the ratio are shown. A histogram of data for Recent Indian Ocean foraminifera is shown for comparison. Dashed line indicates altered samples based on evidence from 6’*0 data or SEM. Inset is the mean Sr/Ca ratio (80% confidence limits) of well-preserved samples, calculated for 1 million year increments from O-10 Ma, 5 my increments from lo-60 Ma, and 10 my increments from 60-80 Ma. 0 oiston cores: DSDP cores X 21. Na/Ca a significant amount of the Na may be due to aluminosilicate contamination (Bender et al., 1975). We generally assume that no Na is associated with Cl, and no correction for sea salt contamination has been made. While many samples had large and widely variable Cl/Na ratios, the corresponding Na/ Ca ratios were usually much less variable and similar to Na/Ca ratios in samples of the same age having Cl/Na ratios ~1.0. Replicate analyses showed that the Cl/Na ratio was much less reproducible than the Na/Ca ratio, suggesting that, in nearly all cases, the large Cl content resulted from laboratory contamination. We arbitrarily excluded 37 data points as contaminated with sea salt which had Cl/Na > 1.0
’ See NAPS document No. 03954 for 7 pages of supplementary material. Order from ASK/NAPS, Microfiche Publications, P.O. Box 35 13, Grand Central Station, New York, NY 10163. Remit in advance $4.00 for microfiche copy or for photocopy, $7.75 up to 20 pages plus 8.30 for each additional page. All orders must be prepaid. Institutions and Organizations may order by purchase order. However, there is a billing and handling charge for this service of $15. Foreign orders add $4.50 for postage and handling, for the first 20 pages, and $1 .OO for additional 10 pages of material. $1.50 for postage of any microfiche orders.
and Na/Ca greater than twice that in samples of similar age. Sr/Ca atom ratios vs. age are plotted in Fig. 2 for all samples with a counting uncertainty in the ratio < ?lO%. A histogram of Sr/Ca ratios of Recent Indian
Ocean
foraminifera
(mean
Sr/Ca
= 1.38
X 10-3) is shown for comparison.
Na/Ca atom ratios v.r. age are plotted in Fig. 3 for all samples with a counting uncertainty in the ratio < +lO% and Al/ Ca < Na/Ca.
Evaluation
of Sr/Ca data
Two diagenetic processes can potentially alter the chemistry of calcite skeleta: early diagenesis (including surface exchange and partial dissolution), and recrystallization. Early diagenesis may slightly lower the Na/Ca ratio of foraminifera but leaves the Sr/Ca ratio relatively unchanged (Lorens et al., 1977). Recrystallization causes a decrease in the Sr/ Ca ratio because crystals grow more slowly during recrystallization than during biogenic calcite precipitation, and at slower growth rates Dsr is lower (Lorens, 198 1). We used the following criteria to recognize recrystallized samples: Sr/Ca ratios lower than those of contemporaneous samples; anomalously low ‘8O/‘6O ratios (as measured by other workers on samples from the same sites); and/or evidence of recrystallization, cementation or overgrowth observed by scanning electron microscopy. Samples showing evidence of recrystallization were rejected
ET AL
D. W. GRAHAM
1284
-n 8 rr) 0 *
6
0 ._ +
.
E!
.
.
I
I
NaKa ratios
Recent
-
Indian Ocean Foraminifera
I
1 0
I
20
I
40 EST1 MATE D
I
I
60 AGE
I
1
80
I
I
100
( m. y. 1
FIG. 3. Na/Ca atom ratio in fossil planktonic foraminifera vs. estimated age (Ma). Only samples U.lth counting errors < +lO% in the ratio and Na/Ca > AI/Ca are shown. A histogram of data for Indian Ocean foraminifera is shown for comparison. Dashed line indicates altered samples based on SEM evidence. 0 piston cores; DSDP cores X 21. 4 44, D 47.2, A 55, ‘(I 157, u 158, k 167. q 171. P .‘CiI(. D 277. A 305, A 310
as paleochemistry indicators. Samples were never rejected on the basis of low Sr/Ca alone; rather low Sr/Ca ratios alerted us to the possibility of recrystallization and the results were rejected only if ‘“O/ I60 or SEM inspection also indicated diagenesis. Minima in Sr/Ca ratios occur in the Upper Miocene and Paleocene-Eocene (Fig. 2). Accordingly, Upper Miocene-Lower Pliocene samples from sites 157, 158,208, and 3 IO were examined for diagenesis, as were Paleocene-Eocene samples from sites 47.2, 17 I and 305. Of the Upper Miocene-Lower Pliocene samples, only those below - 175 m (older than 3 Ma) at site I57 appear to be altered, as indicated by low ‘*O/“‘O ratios and calcite overgrowths on foraminifera (Bukry, 1973; Keigwin, 1979). Substantial increases in Ca and Sr concentrations in interstitial waters at site 157 (J. Gieskes, personal communication), and the presence of chert at the base of this site (Heath, 1973) also indicate active diagenetic processes. There is no evidence of recrystallization at the other Upper Miocene sites. Foraminiferal preservation is excellent at site 208 on the Lord Howe Rise (Kennett, 1973) and moderate at site 310 on the Hess Rise (Bukry, 1975). No indication of recrystallization was found in the extensive studies of isotope stratigraphy at these two sites (Keigwin, 1979; Bender and Keigwin, 1979). No evidence of recrystallization was found in any samples of Orbulina from site 208 examined by SEM (Graham, 1980).
Cretaceous and Paleocene samples from the Shal sky Rise are recrystallized. At Sites 47.2 and 305. anomalously low Sr/Ca coupled with dnomalousij low ‘80/‘60 indicates recrystallization of the bulk carbonate (Matter et al.. 1975; Douglas and Savin. 1975). Our SEM studies of foraminifera older than 55 Ma from sites 47.2 and 305 also indicate recrystallization, while Paleocene-Eocene samples from site I71 in the Equatorial Pacific appear well-preserved. For the above reasons, samples below 175 m at DSDP I57 (older than about 3.0 Ma) and samples older than 55 Ma from DSDP 47.2 and 305 have been eliminated from the paleochemical discussion. A most intriguing feature of the Sr/Ca data is the minimum in the ratio between 5- 10 Ma (Fig. 2 ). To resolve whether or not this tninimum reflects d change in seawater composition, we analyzed monospecific samples from 3 DSDP sites ranging in age from O-13 Ma (Fig. 4). All three data sets show the minimum between 4 and 9 Ma although the curve is not well defined for site 158 samples older than -9 Ma. We also analyzed monospecific samples (from sites I58 and 208) having ages of 0 4 Ma, 4 9 Ma, and >9 Ma. In Fig. 5, Sr/Ca ratios for the 4-9 Ma interval are plotted V.S.Sr/Ca ratios of the same species before and after the minimum, The ratios for the 4-9 Ma sample are on average 10% less than the ratios for either the younger or older samples of the same species, for a wide range of species. These results eliminate the possibility that the Late Mio-
Sr/Ca
1285
IN FORAMINIFERA
1.6
r-7 0 x 1.4 0 .5 E 0 z
1.2
1
I
0
I
2
I
I
I
4
I
I
I
6
I
I
8
ESTIMATED
I
I
AGE
I
12
IO
( m.y.1
FIG. 4. Sr/Ca atom ratio in single species of planktonlc foraminifera since the Middle Miocene vs. estimated age (Ma). Bars are the statistical counting error. Only samples with an error < +-IO% in the ratio are shown. 0 Orbulina, DSDP 208; A Orbulina. DSDP 310; n G. sawulifer, DSDP 158.
cene decrease is the result of any unknown speciesdependent effects, and are consistent with the conclusion that, between 4-9 Ma, the Sr/Ca ratio of seawater was lo%- 15% less than the value before and after. There is also a minimum in the Sr/Ca ratio at about 50 Ma (Fig. 2). We have no evidence for diagenesis in these samples and this minimum is thought to reflect a feature of seawater paleochemistry The Sr/Ca ratio of the few Mesozoic samples is much lower than the present value, but the results are insufficient to show whether they truly reflect lower seawater Sr/Ca ratios. Evaluation
of Na/Ca
data
Between 0 to 10 Ma the Na/Ca ratio ranges from 3 X 10ml to 9 X 10m3; from lo-60 Ma the ratio remains between 2 X 1O-3 to 4 X 10m3 (Fig. 3). An unmistakable decrease occurs back through the Cenozoic, preceded by larger values in the Late Cretaceous. This decrease can be interpreted as reflecting either slow diagenetic leaching of Na, or changing seawater chemistry (larger Ca concentrations in the past). White (1978) found that the Na/Ca ratio in calcite is approximately proportional to the cube root of the solution ratio. The equilibrium Na/Ca ratio for calcite precipitated from seawater at 25°C is 0.8 X 10m3;Na/Ca ratios in foraminifera today are about a factor of 7 larger. Since the Na/Ca ratio of fossil foraminifera decreases with age by about a factor of two, no reasonable interpretation of changes in the seawater Na/Ca ratio is possible using White’s distribution coefficient data (which would imply that the seawater [Cal had decreased by 23, or 8 times,
since the Miocene). Because of the large effect of the seawater Mg/Ca ratio on the Na/Ca ratio in calcitic mollusks (Lorens and Bender, 1980), it is not clear how the Na/Ca ratio in foraminifera will vary with changes in the seawater Na/Ca ratio. Therefore, since we do not understand the controls of Na incorporation into biogenic calcite, the nature of the Na bearing phase(s), or the extent to which Na is lost during diagenesis, we cannot unambiguously deduce paleochemical information from the Na/Ca results at the present time.
*_ 16 E i
before
after
0 208
0208
q l5Fl
ml58
‘C .-
g
1.4
1
00
0
3
L
E ,o 0
a 0
G
/
.
.
0
x .o
.
0
8 0
12
0
0 \\’
< v, 1.0
\’ Cl?
0.8”
ii/,
I.0
Sr/Co
12
atom
ratio
1.4
I6
x IO3 (before f after minimum)
FIG. 5. Sr/Ca atom ratios in single species of planktonic foraminifera during the Late Miocene minimum VS.Sr/Ca ratios in the same species during earlier and later times. Only samples with an error < +lO% in the ratio are shown. Lines shown are for no change, a 10% decrease. and a 20% decreases between 4-9 Ma.
D. W. GRAHAM
1286
RIDGE PER (IO’
“O,,ct
-l”i
IO my hm3)
I
._--_.-_~ -I---L
CC0 (km)
sr/co ATOM RATIO 3 x IO
FIG. 6. Summary of Cenozoic variations. A. Decrease in ridge volume per 10 my, calculated from data in Pitman (1978). B. Change in carbonate compensation depth in the N. Atlantic and Pacific (van Andel, 1975). C. Increase in Sr/Ca of foraminifera (80% confidence of the mean). Dashed line is predicted steady-state response to decrease in global seafloor spreading model II, Appendix IA. DISCUSSION There are several important features of the average Sr/Ca in planktonic foraminifera during the Cenozoic; 1) there are minima at 50 Ma and 4-9 Ma, 2) the ratio has been within -10% of 1.25 X lo-‘over the long-term (except for the minima), and 3) there is a long-term increase toward the present in the average ratio during the last 65 Ma. The long-term near constancy of the Sr/Ca ratio (tlO%) suggests that the riverine Sr/Ca has been close to its present value and that most of the Ca in the ocean has been deposited as calcite for the last 65 X lo6 y. Absolute input and removal rates may well have varied. The long-term Sr/Ca increase and the two minima can of course, be ascribed to changes in river water chemistry. These changes are unconstrained using present geologic information. There., fore, this is an untestable hypothesis. We show that changes in seawater Sr/Ca can be plausibly explained by certain paleoceanographic events. The seawater Sr/Ca reflects the mass balance between input and removal. If rivers were the only source and biogenic calcite sedimentation the only sink of the two elements, then at steady-state the following would hold: (Sr/Ca)caicrce = (Sr/Ca),,,,,,, = Ds,(Sr/Ca),,,,,,,, The Sr/Ca
ratio would be governed
(Sr/CaLwarer =
(1)
by
$Sr (Sr/Ca),,,,,,
(2)
ET .4L.
At this hypothetical steady-state, the average Sr (’ Ca ratio in calcite would adjust to a value equal tkb the average river input ratio. This simple situatiorg is complicated by the existence of another i II source and another Ca and Sr sink. The additional source is hydrothermal activity. which today may cootributc as much as one-third the Ca from rivers (Edmonrl er al., 1979). It is not clear whether hydrotherm:ii activity is a source or a sink for Sr (Merjer. !976. Mottl and Holland, 1978; Menzies and Seyfricd. 1979; Albarede et al., 1981), but since the 1Sr/Xa of hydrothermal solutions is much less than the t-ii erine Sr/Ca ratio, hydrothermal processes are not a major source of seawater Sr. The other important sink is aragonite (deposited primarily in shallow waters), which contains 226 times as much Sr a:+ calcite (Turekian and Armstrong, 1963; Pitkey and Goodell, 1963; Amiel et al., 1973) The long-term increase in Sr/Ca may be due to a decrease in the hydrothermal Ca flux resulting from the decreasing rate of global seafloor production dui ing the Cenozoic (Fig. 6). According to Edmond r! al. ( 1979) hydrothermal processes todab suppi) about 30% of the total Ca entering the oce:ms. If the Ca flux is proportional to spreading rate, then at 0:~ Ma hydrothermal processes would have increased the total Ca flux to the oceans by about ZO”;., and the calcite Sr/Ca would have been about I. I c 10 ’ in stead of 1.38 X lo--’ (the Recent value) ,\ctuall\ at least two factors would have prevent& the hpdrothermal Ca flux from being so large. t-irst. the hydrothermal input involves exchange of basalt . Cherrr Geol. 1, 93 135. Humphris S. E. and Thompson G. (1978a) Hydrothermal alteration of oceanic hasalts by scawatcI crrochim C,>i mochim. Acta. 42, 107 125 Humphris S. E. and Thompson G. (197Xb) I race element mobility during hydrothermal alteration I>!‘oceanic ba salts. Geochim. Cosmochim .,4cta. 42. 127 136. Kaneps A. G. (1973) Cenozoic planktonic forammifera from the Eastern Equatorial Pacific Ocean. In fnilrtzi Reports of rhe Deep &a Drilling Projrc: (eds. Tj. ! at: Prin! Andel c’~al.) Vol. 16, 71?- 745 U.S. Government ing Office. Keigwin L. D. Jr. (1979) Late Cenozoic stable isotope stratigraphy and paleoceanography of DSDP sites from the cast equatorial and nor!h central Paciti; Ocean. Earrh Plunet. Sri. Lerr. 45. 361 382. Keller G. (1978) Late Neogene biostratigrdphy and paleoceanography of DSDP 310 central north Pacific and correlation with the southwest Pacific. Mar. Micropaleonr 3. 97~~119. Kennett J. P. (1973) Middle and Late Cenozotc planktonic foraminiferal stratigraphy of the southwest Pacific-DSDP leg 2 I. In Initial Reports of the Deep Sea Drilling Projeer (eds. R. E. Burns er u;.) Vol. 21. 575639. U.S. Government Printing Othce. Kitano Y., Okumura M. dnd Idogaki M. (1975) Incorpo ration of sodium, chloride, and sulfate with calcium cay honate. Geochem. J. 9, 75 -84 Land L. S. and Hoops G. K. (1973) Sodium in carbonate sediments and rocks: a possible Index to the salinity ot diagenetic solutions. J. Sediment. Perroi. 43, 6 14.-6 17. Livingstone D. (1963) Chemical composition of rivers and Iakes. U.S. Geol. Surv. Prof: Paper 440-G ILewin R. A. and Chow, 7‘. J. ( 196 I ) La enpreno de strontio en Kokolitoroj. Plum (‘e/l. Physiol. iJapan) 2, 203-208. Lorens R. B. ( 198 1) Sr. Cd, Mn, and Co distribution coefficients in calcite as a function of calcite precipitation rate. Geochim. Cosmochim. .4c,ru 45. 553 561.
Fossil preservation, geochenustry, and diagcnzsrb ol p< lagic carbonates from Shatsky Rise, northwest Pacific. In Initial Reports of the Deep Sea Drilling Projeci (e&z. R. L. Larson et al.) Vol. 32. 891-906. 1J.S. Gov’ernmenl Printing Office. Meijer A. (1976) Pb isotopes, major elernerri:,, zclcctec trace elements and mineralogy of altered and metamorphosed sea-floor basalts (abstract), EOS 57, ‘1, Menzies M. and Seyfried W. E. Jr. ( 1979) Basalt-sedwatcr interaction: trace element and strontium isotopic variations in experimentaIIy altered glassy ha%alt Earth Planet. Sci. Leta. 44, 463-472. Mottl M. J. and Holland H. D. (197X) Chernicai sxchange during hydrothermal alteration of basalt bc ;e:rwater-I Experimental results for malor and minor t’omponents of seawater. Geochim. Cosmwhim .&(a 42, I 101..i 1I Z Peterman Z. E.. Hedge C. E. and Toartelot ii 1 ( 1970; Isotopic composition of strontium in seawater ihroughoui Phanerozoic time. Geochim. C/~~rnorhlm .I*:.i 114,105 120 Pilkey 0. H. and Goode11 H. G i 9963 ! ‘I ~:i~‘:i~i~^rnents it Recent mollusk shells. Linrnoi. Orranogr W, I~:.,>1. 177 148 Pitman W. C.. Jr. (1978) Relattonship bctvveeii custacy tint1 stratigraphic sequences of passive margin\ R~rli f;l,u: Sot. Amer. 89, l389- 1403. Rubey W. W. (1951 ) Geologtc history (11 \l‘:rwa~er a attempt to state the problem Bull. G’er~!. S.‘, -Itrrfr. h? 1111-1148. Savin S. M., Douglas R. G. and Stehh I. G ( i 97 -) I ettmr . l:r?c? xti. marine paleotemperatures. &I/ Grol So. 1499-3510. Savin S. M., Douglas R. G, Kcilei ii.. K~!iii~$lct i ‘,, Shaughnessy L., Sommer M A., Vincent t. and Wooc” rufT F. ( 198 1) Miocene benthic foraminiferal i\otope rec. ords: a synthesis. Mar. Micropaleonr 6, 47 J 4.‘10. Shackleton N. J. and Kennett J P. (1975) P~ic,~temper,: ture history of the Cenozoic ,rnd tht: mi:l:i:isj;t .~f .%[I: arctic glaciation: oxygen and c.trbon isotope nnaly~i
Turekian K. K. (1964) The marme geochcmtsti~t ul \trtii, tium. Geochim. Cosmochim. .4cra 28, 147% 14% Turekian K. K. and Armstrong R. IL. (1960) Magnestum strontium, and barium concentrations and c;tlcite-ara. gonite ratios of some Recent molluscan shellr I Mar Rex 18, 133 ~151. Vail P. R.. Michum R. M. and Thompson b. 111. \ r9i; I Seismic stratigraphy and global changes of sea level. Pai : 4. Global cycles of relative changes of sea level. in St ismic Stratigraphy--Appiications to H,vdrwurbon E.\ ploration (ed. C. E. Payton) 83 -97. Amer Assok, Petrol Geol. Mem. 26, Tulsa. van Andel Tj. H. (1975) Mesozorc/Cenozotc caictte cons
Takahashi T. (1975) Carbonate chemistry ot seawater driu the calcite compensation depth m the ocean’.. In L)is.\cc‘ lution of Deep-Sea Carbonates (eds. W L Siiter A. W. H. Be, and W. H. Berger) I I 26 Spec Pubi. I ! Cushman Found. Foram. Req. Thompson T. G. and Chow T .I ( 195:) I hc str;mttuu; calcium ratio in carbonate-secreting mariric t:rganism~ Deep-Sea Res. 3(SuppI.), 20 -39 Thompson G. and Bowen V. J. ( 1969) Analysis ot coccohth ooze from the deep tropical Atlantic. .J Mar. Res. 27. 32-38. Turekian K. K. (1965) Paleocologlca! ~tgnrhcancc 01 :htL strontium-calcium ratio in fossils and sediments. Ruli Geol. Sot. Amer. 66, 155- : 58
Sr/Ca
pensation depth and the global distribution of calcareous sediments. Earth Planet. Sci. Lett. 26, 187-194. van Andel T. H., Heath G. R. and Moore T. C. Jr. (1975) Cenozoic history and paleoceanography of the central equatorial Pacific ocean. Geol. Sot. Amer. Mem. 143. Veizer J. and Compston W. (1974) *‘Sr/%r composition of seawater during the Phanerozoic. Geochim. Cosmochim. Acta 38, 146 I- 1484. Vincent E. f 1975) Neogene planktonic foraminifera from the central north Pacific, leg 32, Deep Sea Drilling Project. In Initial Reports of the Deep Sea Drilling Project (eds. R. L. Larson et al.) Vol. 32, 765-802. U.S. Government Printing Office. White A. H. (1978) Sodium ~oprecipitation in calcite and dolomite. Chem. Geol. 23, 65-72. Winterer E. L. (1973) Regional problems. In Initial Reports of the Deep Sea Drilling Project (eds. E. L. Winterer et al.) Vol. 17, 9 1 I-921. U.S. Government Printing Office. Wolery T. J. and Sleep N. H. (1976) Hydrothermal circulation and geochemical flux at mid-ocean ridges, .I. Geot. 84, 249-275. Worsley T. R. and Davies T. A. (1979) Sea-level fluctuations and deep-sea sedimentation rates. Science 203, 155-456. APPENDIX
I. MODELS
FOR SEAWATER
Sr/Ca
The rate of hydrothermai activity (looseiy defined as the discharge rate of ridge crest and flank hydrothermal sotutions) undoubtedly increases with increasing seafloor crustal production rates. However, it is unclear whether the steadystate hydrothermal Ca flux is related to the rate of hydrothermal activity. In the simplest case, where hydrothermal processes merely exchange riverine Mg for hydrothermal Ca, the steady-state hydrothermal Ca flux would be independent of seafloor spreading rate (Fig. 7, 1A). The Ca-
Mg exchange ratio also is not necessarily l:l; in the Galapagos vent fluids ACa/AMg is between l/2 and l/3. (Corliss ef al., 1979; Edmond er al., 1979). The relationship of ACa to AMg is probably connected to the fate of sulfate in hydrothermal systems. If all sulfate is reduced to sulfide, then the one-for-two exchange is probably more correct. If, however, the sulfate is largely precipitated as anhydrite, which is later redissolved and added back to seawater, the one-for-one exchange is probably more correct. It is likely that the Ca flux does increase with increasing spreading rates for two reasons. First, at faster spreading rates, the hydrothermal Mg removal rate would probably increase. This is because hydrothermal activity would become a more efficient removal mechanism and the fraction of Mg removed by other sinks, including ion exchange and anoxic diagenesis (Drever, 1974), would decline. Thus, if hydrothermal activity involves a Ca for Mg exchange, the hydrothermal Ca flux would increase. Alternatively, it may be that the hydrothermal Ca flux is partly decoupled from the Mg flux: for example, it may depend in part on the rate at which hydrothermal solutions dissolve plagioclase (Mottl rind Holland, t978), consistent with the variation of &Za/ dMg in vent fluids and the existence of two distinct assemblages (chlorite and efldote) in hydrothermally altered rocks (Humphris and Thompson, 1978a). For this case too. the hydrothermal Ca flux would increase with an increase in seafloor spreading rate (Fig. 7, 18). It is likely that the hydrothermal Ca flux (and hence the seawater Sr/Ca ratio) shows a transient response to changes in seafloor spreading rates. Assume that at time I~, there has been an instantaneous spreading rate increase. The hydrothermal Mg consumption rate would increase as seawater circulated at a faster rate through hot new crust, and the hydrothermal Ca input rate would increase. The seawater Sr/Ca ratio would decrease. Eventually, the seawater Mg concentration would decrease due to the increased hy~irothermal consumption, and the removal rate of Mg would
118
l 1A
HYDROTHERMAL
Spreading
Co
FLUX
Spreoding
Rate
SPREADING I2A
1289
IN FORAMINIFERA
Rate
RATE
I
Time
Time
FIG. 7. Response of seawater Sr/Ca ratio to seafloor spreading rate changes for various assumptions. Seawater [ Sr] is assumed to be conservative during seawater-basalt exchange. 1. Steady-state Responses: A. All riverine Mg removed by hydrothermal activity; Ca exchanged for Mg at a fixed rate. 8. Hydrothermal Mg removal rate increases with spreading rate; hydrothermal Ca Rux proportional to Mp removal rate. 2. Transient-State Responses: A. Increase in Spreading Rate. B. Decrease in Spreading Rate.
D. W. GRAHAM
1290
TABLE 1. Model values defining a steady-state ocean today and 10 Ma (before a 20% seafloor production rate increase). River Fluxes (mmol/kg/103y) 9.62x10
RCa RMg R Sr Seawater
10 Ma ~__
ioday ^7
9.62x10-j
4.08x10-'
4.08x10-:
1.89x10-
1.89x10-
Concentrations
(mmol/kg)
W-1 (Sr/CaIforam
10.28 52.80 ‘0906 1.38x10-'
Carbonate
Parameter-s_
;;;i
System
K'sp(mmol/kg)' aO(mnol/kg/atm) K2 ’
270x10+
(atm)
i
1.131x10-0 5.637~10-'~ 270x10-"
8.002
PH
8.144
fall back to the steady-state value (determined by the river input rate). The hydrothermal Ca flux would decrease back towards the value at t,,, Some possible responses of hydrothermal Ca flux, seawater [Mg], and Sr/Ca ratio to spreading rate changes are shown in Fig. 7. We have knowingly made many favorable assumptions to simplify our models for estimating effects on seawater chemistry. Our intention is to provide simple arguments for the qualitative relationships between Sr/Ca ratio and both spreading rate and rate of aragonite sedimentation, and to quantitatively evaluate whether the observed Sr/Ca changes can be plausibly ascribed to the geologic evidence for changes in those rates. If fluxes into the ocean are defined as positive, then concentration changes with time can he represented by d[Ca]/dr
= R, ,. - S, ,, + H, ,
I+)
d[Sr]/dr
= Rs, ~- S, ,~)i (Sr/Ca).,,,,,,
(4)
_ RMg ~~Hhn,:
(5)
d[Mg]/dt
then seawater concentrations and riverine fuxes for the modern ocean are constrained to be those in Table I. The corresponding residence times (T~,~ = [Cal/&,: rqf m-[Sr]: Rsr) are 0.75 X lo6 y and 4.8 x 1Oh y for Ca and Sr, respectively. The model value for I& is 0.157. consistent with observed Sr/Ca ratios in Recent planktonic foraminifera Given these assumed geochemical cycles for Ca and Sr, the transient Sr/Ca minima during the Cenozoic can be explained in two ways; either Sr was selectively removed by extensive precipitation of Sr-rich CaCO? (I r + aragonite), or increases in seafloor spreading rates caused a tran sient increase in the hydrothermal Ca flux. The long-term increase in Sr/Ca ratio since the early Cenozoic may reflect the long-term decrease in seafloor spreading rates since that time.
The long-term records of CCD and Sr/(_.t ourmg the Cenozoic may be largely explained by a model decreasing hydrothermal calcium flux accompanying the long-term decrease in global seafloor spreading rates. The model relies on the work of Pitman (1978) and van Andel t 19751. Assuming 5 km for the depth of newly formed octali crust, the rate of ridge volume production (per IO million year interval) during the Cenozoic was calculated from the sums of oceanic area with ages less than IO million years Fig. 6 shows the global seafloor spreading rate curve calculated in this manner from data in Pitman (1978). From 65 Ma to today the crustal production rate has declined b! a factor of - 1.6. Also shown are the CCD (van Andcl. 1975) and Sr/Ca curves, We suggest that a steady-state increase may have occurred during the Cenozoic in SriC‘a ratio (as qualitatively outlined in I B. Fig. 7) Two steady-state models for Sr/Ca can be readily constructed, each based on a different assumption for the hydrothermal Ca flux. In model I we assume that C’a is Ed, changed for Mg at ocean-ridge spreading centers at a fixed rate. For riverine fluxes that are invariant with time, the foram Sr/Ca predicted by this model is constant, since the input rates of riverine and hydrothermal Ca :md riverine Sr are all constant. In model II we assume that the hydra!thermal Ca flux is proportional to seafoor spreading rate. The foraminiferal Sr/Ca ratio is thus determined h\
of
1.039 58.05
1.131x10-b 5.637~10-'~
KI ’ PC02
1.039 58.05
5.35 58.32 .0470 1.38x10_
ET AL
where R = the riverine flux to the ocean; H = the hydrothermal flux; Sc, = accumulation rate of pelagic carbonate sediments; and (Sr/Ca),,,., = average Sr/Ca ratio in planktonic foraminifera. All fluxes are parameterized on a per kg of seawater basis assuming a mean ocean depth of 3800 m. Riverine fluxes are assumed to be invariant with time. and are calculated as the concentration in average river water times the flux of river water to the ocean (IO 1/cm’/ IO3 yr). Values for riverine concentrations are from Livingstone (1963). For internal consistency, Mg, Ca. and Sr are assumed to be at steady-state, and the modern riverine flux of Sr is calculated assuming that calcite is the only removal phase. The calculated riverine Sr flux ( I .89 X IO -’ mmol/kg/103 y) is very close to a value of 2.01 x 10~ ’ mmol/kg/lO’ y, which we estimate from an average riverine [Sr] = 68.5 fig/l (Brass, 1976). The hydrothermal flux of Ca is assumed to equal 93% of the riverine Mg flux (the remainder of the Mg flux reflects cyclic sea salts, as indicated by riverine [Cl]). Hydrothermal removal is assumed to be the only sink for noncyclic Mg. If hydrothermal activity involves a mole for mole exchange of Ca for Mg,
where S is the average global spreading constant. We use the boundary conditions 2 for 65 Ma and today
to calculate
R,,/R,
rate ;rnd A IS :r outlined in Table
I and Ai?? ! the c,I
ratio of hydrothermal Ca flux to riverine (_‘:I tiux). -1 be foram Sr/Ca ratio predicted by this model is shown in Fig. 6C. The hydrothermal Ca flux predicted hy thi\ model Table 2. Parameters for steady-state models of Sr/Ca. __I~~__ --.l_ Boundary Conditions S(107km3/107y)
(Sr/Ca)foram
___ 65 Ma IO.89
ipa tj 7:;
I. 20x10- * ! ikhlO’^
Assumed Values
R,,,ghWkg/l@y)
rr.62x10-i Y.GixlO _-3 4.08x10 ti4.3SxiO-'
ISrl,,(rmnol/kg)
0.0906
RCa("mollkg/103y)
0. 09Gt
Sr/Ca
1291
IN FORAMINIFERA
Rivers Ca, I OCEAN
L
(Sr/Ca)~~~~ = Dsr x (Sr/Calswwa+er
Cca++lLco~l = Q
= 1.00
K’sp
pco2= 270 Ca++ +2HC03
x 10b6atm
+Ca(++
H20 t C ‘2
4
Sediments Ca, Sr, CO2 FIG. 8. Assumptions
for the transient
response
model of the Sr/Ca
would be 32% of the riverine Ca fux today, and 52% of the riverine Ca flux at 65 Ma. This model predicts an increasing Sr/Ca ratio during the Cenozoic, but the magnitude of the change is overestimated, perhaps because the hydrothermal Ca flux is overestimated. The shape of the model SrfCa and the CCD are almost mirror images of the seafloor spreading rate curve. The deepening CCD during the Cenozoic may be the result of decreasing aragonite deposition in shallow waters accompanying a long-term sea level regression. Alternatively, the deepening CCD may reflect the response of the average carbonate saturation horizon in the oceans to the seafloor spreading decrease. That is, as the amount of shallow abyssal areas decreased in response to slowed seafloor spreading, the saturation horizon became depressed to maintain removal of pelagic carbonate at a rate required for steadystate. Both of these alternatives predict long-term increases in Sr/Ca ratio.
C. Increase in seajloor spreading Miocene Sr/Ca minimum
IC).
and the rransiem Late
To make a first approximation of transient hydrothermal effects, we invoke several simplifying assumptions. We assume that hydrothermal removal is the only sink for Mg, that this exchange is one-to-one for Ca, and that the only removal phase for Sr is calcite. We also assume that the charge carried by Ca, Mg, and Sr in rivers is balanced by bicarbonate, and that riverine fluxes are invariant with time. Furthermore, we assume that the removal reaction for Ca from the oceans is Ca+‘- + 2HCOi
-
CaC03
+ H20 + CO2
(9)
and that the degree of saturation of seawater with respect to CaCOj, D, equals 1.OO, with the pC0, = 270 X I O-6 atm, approximately the pre-industrial value (Brewer, 1978). These assumptions are expressed in a box model shown in Fig. 8. The carbonate system is defined using Lyman’s con-
3. cabin-shelf fractionuiio~ The following argument indicates that the minimum in Sr/Ca near 50 Ma may be plausibly ascribed to increased deposition of aragonitic limestone on continental shelves. If calcite and aragonite are the only Ca and Sr sinks, then at steady-state the following relationship must hold:
ratio since 10 Ma, (Appendix
1.5
r
1.4 ro
0 * where fc and fA are the fractions of CaCO, buried as calcite and aragonite, respectively, D’s are the distribution coefficients for the appropriate minerals, and the ion ratios are hypothetical seawater ratios. Rearranging (6) gives
L
(*)
DA/DC varies between 2 and 6 (Turekian and Armstrong, 1963; Pilkey and Goodell, 1963; Amiel et al., 1973). The variation of the foram Sr/Ca ratio with f,_, is calculated assuming that the flux ratio of Sr/Ca is 1.38 X lo-” and DC = ‘,&(the values in Recent foraminifera). For aragonite precipitation to have driven the calcite Sr/Ca ratio to 1.07 X IO-’ (the observed minimum), -30% of the CaCO, must have been precipitated as low Sr aragonite, with D, = % (typical of some mollusks), or -7% as high Sr aragonite, with D, = 1 (typical of corals).
I.2
E
0 c a
f&c + DADA= (1 - f.J& + faDA
1.3
0 _c 0
I.1
G ;j
1.0 0
2
4 1 IM
6
E
(my
6
IO
B.P.)
FIG. 9. Median Sr/Ca ratio in planktonic foraminifera since 10 Ma calculated from single species samples at DSDP 158, 208, and 310. Outlined area designates 80% confidence limits. The dashed line is the Sr/Ca ratio predicted from the transient response model, (Appendix IC).
D W GRAHAM
1292
stanta ( 1956). Pressure culated in situ transient thermal seafloor
and temperature effects are culby the methods of Takahashi (1975) assuming an temperature of 2°C and salinity of 35%. In rhr model we assume that Mg removal by hydruexchange is proportional to !he s;dwater [Mgr .tnd spreading rate. Therefor, H,,,
= K\,, state just before a 20%~ increase ir: KkIp at IO Ma. Vaiues for a steady-state ocean prior lix 10 M;r arc given 1:~ Table i. In the model calcuiatlons the ( a added lrum hydro~he~mu1 exchange and river input ia precipitated from the NQ~: as c‘aC03 after a time period Ir !nlO’ years) shorter ihan the residence time of Ca, such that the ocean adjusts :tmplikd LIVI straini>. The model is onl) intended !o :::di<e :ne ii;>: order response of the marine Sr/C’a ratio to ;: 31,‘. (hang,. in global seafloor spreading at IO Ma. and wc &I plot timpI\ that oceanic roncenfrakns of C‘a, Mg, and St (J:- e.fppt,se130 !n, sonrcat e d , ro z croboqradrrna dehr3.en6
3 ,I
r 35 l.tl
r53 2r,l
231
3.13
1.3 3 2.\1 Lr 5
'13o r,
$nicar€d, Iozdtssolved l .t3 3,01
croboq{adrtn. al.r8nlra
r.52 ':'"
I. I. 35
2,67 tl l
,18l .0616 .2\2
133 33.0
,213 l:
r03
.:"
r ,r l
,24
.r53
t15
r . l3
chbrgerrmides
cl o b l scrtn e l l . a€.r tr r r ater !l1s
r . 53
t 1,100-102 6-r,r00-102
7 3, r0o - r 0 2 3- r, t o- 5 2
Gro !l se ri n a h ulr oldes 0 .l n l ve rsa
9 3 ,1 5 0 r 0 1 ,1 25r27
r. r3
1l- 4 ,50 5?
r 2 - 2 ,5 0 -52 1 r- 1 ,t0 52 tr- 4 ,5 0 -r2 t4 - 4 ,5 Ot2 r 4 - 4 ,5 0 -52 r 4 - 4 ,5 A-52
i.eL' 162.0
r 1 - 4 ,t0 -52 r 4 - 4 ,to -r2 r 4 - 4 ,5 0 -t2 14 - ( ,50 - 52
r . . :l t r . lr
C.bulroides 3, eubdehrsceis
r 4 - 4 , t 0 - t2 14-{,t0-52 r 5 - 6 , 5 0 - t2 r6-4,50-52 1 6 - 5 , 5 0-5 2 r6-6,t0 52
7.4
r l .l
r6-cc rs-2,5o52 I A- 2 , t 4 -r2
C , me n a rd rr
23.1 26
1.3r
t1 r 29.5
391,5
52-Ca 31t. t
orbulrlr,
39
1.51*
>417 29t
! n , mr
s p lii
.6
r s p P 3 i 0 (.o n t. ) 6-6,30 | 2,40 t-2,40 7 3,52-51 1 3 , 5 2 - 54 7-1,90-92
:0." 57.9 5,1 5.4
3,5 3.3 3.9