0021-972X/05/$15.00/0 Printed in U.S.A.
The Journal of Clinical Endocrinology & Metabolism 90(12):6650 – 6656 Copyright © 2005 by The Endocrine Society doi: 10.1210/jc.2005-1024
Structural and Functional Consequences of Mitochondrial Biogenesis in Human Adipocytes in Vitro Iwona Bogacka, Barbara Ukropcova, Michele McNeil, Jeffrey M. Gimble, and Steven R. Smith Department of Molecular Endocrinology (I.B., B.U., M.M., J.M.G., S.R.S.), Pennington Biomedical Research Center, Baton Rouge, Louisiana 70808; and Department of Animal Physiology (I.B.), Faculty of Biology, University of Warmia and Mazury in Olsztyn, 10-718 Olsztyn-Kortowo, Poland Introduction: Mitochondrial biogenesis is a complex process, and several factors and signaling pathways regulate this process in muscle or brown adipocytes. The aim of the study was to explore pathways affecting mitochondrial biogenesis and fatty acid oxidation (FAO) in human white adipocytes. Methods: Human preadipocytes obtained from liposuction samples were differentiated in vitro. On the 10th day of differentiation, 4 M forskolin and 1 M peroxisome proliferator-activated receptor-␥ (PPAR␥) agonist (pioglitazone, rosiglitazone, or GW 929) or 10 M PPAR␣ agonist (WY-14,643) were added to the media for 96 h. Quantitative real-time PCR was used to determine gene expression/mitochondrial copy number and 14C-labeled palmitate to measure direct energy dissipation. Results: The treatment of adipocytes with forskolin increased mitochondrial copy number and the expression of genes involved in mitochondrial biogenesis (PPAR␥ coactivator 1␣ and transcriptional
M
ITOCHONDRIA ARE THE organelles where several important cellular functions occur including amino acid biosynthesis and fatty acid oxidation (FAO). The mitochondrial DNA (mtDNA) is a small DNA molecule of about 16.5 kb, present in multiple copies in an individual mitochondrion, encoding several proteins involved in oxidative phosphorylation (for review see Refs. 1 and 2). Mitochondrial number and function are changed in response to external stimuli and diseases. In patients with insulin resistance and type 2 diabetes and even in those with positive family history for diabetes, mitochondrial metabolism and ATP synthesis are reduced in concert with a reduction of key factors regulating mitochondrial biogenesis (2– 6). Initially, attention was focused on tissues with high oxidative capacity such as skeletal muscle. For example, Petersen et al. (7) showed a 40% reduction in muscle mitochondrial oxidative phosphorylation activity in the elderly that First Published Online October 4, 2005 Abbreviations: ASP, Acid-soluble products; BAT, brown adipose tissue; CPT-1, carnitine palmitoyltransferase 1; Cyt c, cytochrome c; FAO, fatty acid oxidation; MCAD, medium-chain acyl-coenzyme A dehydrogenase; mtDNA, mitochondrial DNA; mtTFA, mitochondrial transcription factor A; NRF, nuclear respiratory factor; PGC, PPAR␥ coactivator 1␣; PIO, pioglitazone; PKA, protein kinase A; PPAR, peroxisome proliferator-activated receptor; ROSI, rosiglitazone; TZD, thiazolidinedione; UCP-1, uncoupling protein 1; WAT, white adipose tissue. JCEM is published monthly by The Endocrine Society (http://www. endo-society.org), the foremost professional society serving the endocrine community.
factor A) and fatty acid oxidation (PPAR␣ and medium-chain acylcoenzyme A dehydrogenase). The end (CO2) and intermediate products (14C-labeled acid-soluble products) of FAO were also increased after forskolin treatment. PPAR␥ and PPAR␣ agonists increased mitochondrial copy number, uncoupling protein 1, medium-chain acylcoenzyme A dehydrogenase, and carnitine palmitoyltransferase 1, but did not change PPAR␣, PPAR␥ coactivator 1␣, or transcriptional factor A mRNA levels. FAO was higher after rosiglitazone, GW 929, and WY-14,643 but not after pioglitazone treatment. Conclusions: Pharmacological activation of the cAMP or PPAR␥ pathway pushes the white adipocyte down the oxidative continuum. The direct energy-dissipating effects could be significant tools to treat obesity and to improve insulin resistance in type 2 diabetic patients by reduction of fat accumulation in adipocytes or by reprogramming fatty acid metabolism. (J Clin Endocrinol Metab 90: 6650 – 6656, 2005)
was associated with insulin resistance. Our recent results showed a reduction of mitochondrial copy number (mtDNA) in adipose tissue from diabetic volunteers when compared with healthy controls (3). In the same study, we observed that in vivo treatment with pioglitazone (PIO), a peroxisome proliferator-activated receptor-␥ (PPAR␥) agonist and commonly used insulin-sensitizing drug, restored diminished mtDNA content to levels observed in nondiabetic controls (3). A number of reports indicate that PPAR␥ coactivator 1␣ (PGC-1␣), highly expressed in brown adipocytes, heart, and skeletal muscle, is a key factor driving mitochondrial biogenesis (8 –10). PGC-1␣ expression is up-regulated after cold exposure or -adrenergic stimulation in brown adipose tissue (BAT) and muscle (11, 12) and increased during exercise in muscle (13). More recent experiments revealed a marked induction of PGC-1␣ mRNA in the liver during fasting, implying a stimulatory role of PGC-1␣ in gluconeogenesis and fatty acid oxidation (14, 15). Although PGC-1␣ expression is low in white adipose tissue (WAT) compared with muscle and brown fat, the literature suggests a role for PGC-1␣ in mitochondrial biogenesis and oxidative metabolism in WAT. Semple et al. (16) reported 3-fold lower mRNA level of PGC-1␣ in sc fat of morbidly obese people. We recently reported that PGC-1␣ mRNA expression is significantly reduced in WAT obtained from type 2 diabetic subjects compared with nondiabetic controls, and activation of the PPAR␥ by PIO reversed the reduced level of PGC-1␣ mRNA (3). Ectopic expression of PGC-1␣ in rodent white adipose cells increased the cellular content of
6650
Bogacka et al. • Mitochondrial Biogenesis in Human Adipocytes
mtDNA and altered the adipocyte phenotype toward an oxidative phenotype including an increase in uncoupling protein 1 (UCP-1) (17). In another study, hyperleptinemia decreased the amount of WAT and increased -oxidation, PPAR␣, and PGC-1␣ mRNA in WAT (18, 19). PGC-1␣ interacts with and coactivates many nuclear (20 – 22) and nonnuclear receptors such as nuclear respiratory factors (NRF)-1 and -2 (10) and mitochondrial transcription factor A (mtTFA), which is directly responsible for mtDNA replication and transcription. Based on our in vivo results (3) we hypothesized that PPAR␥ agonists, some of them commonly used in treatment of type 2 diabetes, might up-regulate mitochondrial biogenesis and FAO in vitro. Additionally, in our current study, we describe the effect of a stimulator of cAMP activity (forskolin) and a PPAR␣ agonist (WY-14,643) on the expression of genes regulating mitochondrial biogenesis and FAO. For this purpose we measured mtDNA copy number and the expression of genes regulating mitochondrial biogenesis (PGC-1␣ and mtTFA) and FAO [PPAR␣, medium-chain acyl-coenzyme A dehydrogenase (MCAD), and carnitine palmitoylotransferase 1 (CPT-1)] in human adipocytes cultured in vitro. Furthermore, we assessed the impact of activation of these pathways on the oxidation of fatty acids. The direct energy-dissipating effects of these pathways could be significant tools to treat obesity and to improve insulin resistance in type 2 diabetic patients by reduction of fat accumulation in adipocytes or by reprogramming fatty acid metabolism. Materials and Methods Cell culture Human WAT was obtained from liposuction samples (mixture of abdomen, hips, flanks, thighs, and gynecomastia) from five subjects (three women and two men; mean age, 41.8 ⫾ 11.9 yr; body mass index, 27.9 ⫾ 8.2 kg/m2; range, 22.5–39.1 kg/m2). The participants were healthy according to clinical examination and laboratory tests and did not take any medications. All adipose tissue specimens were obtained under a protocol approved by the Institutional Review Board of the Pennington Biomedical Research Center with informed consent of the patients. The method for preadipocyte isolation was based on a modification of previously published procedures (23, 24). Briefly, 50 –100 ml of tissue was subjected to 0.1% collagenase type I digestion with 1% BSA in PBS. Preadipocytes were grown to 80 –90% confluence in stromal medium (DMEM/F-10) supplemented with fetal bovine serum and antibiotics. After 48 –72 h, the cells were resuspended at a concentration of 3 ⫻ 104 cells/cm2. On the second day, the stromal medium was changed to the differentiation medium (DMEM/F-10, 3% FBS, 33 m biotin, 17 m pentothenate, 1 m PPAR␥ agonist rosiglitazone (ROSI), 100 nm insulin,
J Clin Endocrinol Metab, December 2005, 90(12):6650 – 6656
6651
1 m dexamethasone, 0.2 mm 3-isobutyl-1-methylxanthine, 1⫻ penicillin/streptomycin/fungizone) for 3 d. Cells were than changed to adipocyte medium (the same as differentiation medium but without ROSI and 3-isobutyl-1-methylxanthine), and the medium was changed every 3rd day. On the 10th day of differentiation, forskolin (4 m) (EMD Biosciences, Calbiochem, San Diego, CA), PIO (1 m) (PPAR␥ agonist; Takeda Pharmaceuticals, Lincolnshire, IL) alone or in combination with T0070907 (1 m) (PPAR␥ antagonist; Calbiochem), ROSI (1 m) (PPAR␥ agonist; Cayman Chemical, Ann Arbor, MI), GW 929 (100 nm) (PPAR␥ agonist; Calbiochem), or WY-14,643 (10 m) (PPAR␣ agonist; Alexis, San Diego, CA) were added to the media for 96 h (media and treatments were changed every 24 h). PPAR␥ agonists and antagonist were prepared in dimethylsulfoxide, and the remaining compounds were diluted in medium. Dimethylsulfoxide or medium was added to control cells (without treatments) to obtain the same concentration as in compound-treated conditions.
RNA and DNA extraction Total RNA from cultured adipocytes was isolated with Trizol reagent (Invitrogen, Carlsbad, CA), purified with RNeasy columns (QIAGEN, Valencia, CA) and quantified spectrophotometrically. DNA was extracted from the same cells, after degradation of protein and RNA with Trizol, by phenol-chloroform extraction and ethanol precipitation according to the manufacturer’s procedure. The total amount of DNA recovered was determined by spectrophotometry.
Real-time RT-PCR for RNA Real-time RT-PCR for tested genes was performed using a TaqMan 100Rxn PCR core reagent kit (Applied Biosystems, Roche, Branchburg, NJ) as described previously (3, 25). The sequences of primers, probes, and accession numbers for each gene are listed in Table 1. All expression data were normalized by dividing the amount of target by the amount of cyclophilin B present as an internal control.
Real-time PCR for mtDNA Relative amounts of nuclear DNA (nDNA) and mtDNA were determined by quantitative real-time PCR as described previously (3). The ratio of mtDNA to nDNA reflects the tissue concentration of mitochondria per cell.
FAO assay Fat oxidation was measured in differentiated adipocytes after 48 h (three subjects) or 96 h (two subjects) of culture with specific treatments (described above) performed in duplicate. Cells were preincubated with a glucose- and serum-free medium for 90 min, followed by a 4-h incubation with [1-14C]palmitate (NEN Life Science Products, Boston, MA) (2 Ci/ml) and 10 m nonlabeled (cold) palmitate. Palmitate was coupled to fatty acid-free BSA in a molar ratio 5:1. After incubation, 14CO2 (end product of FAO) and 14C-labeled acid-soluble products (ASPs; water-soluble intermediate metabolites of FAO) were measured according to Muoio et al. (26), with some modifications (27). Briefly, assayed medium was transferred into a 48-well trapping plate. The plate was
TABLE 1. Oligonucleotide sequences for primer/probe sets used in TaqMan analysis Gene
ND 1 PGC-1␣ mtTFA Cyt c NRF-1 PPAR␣ CD36 MCAD CPT-1 UCP-1 CyclophilinB
Accession no.
Forward primer
CCCTAAAACCCGCCACATCT NM_013261 CACCAAACCCACAGAGAACA NM_003201 CCCAGATGCAAAAACTACAGAACTAA NM_001916 TGGCCCCTCCCATCTACAC NM_005011 CGTTGCCCAAGTGAATTATTCTG NM_005036 GCTTTGGCTTTACGGAATACCA NM_001001548 AGTCACTGCGACATGATTAATGGT AF251043 TGCCCTGGAAAGGAAAACTTT D87812 CCAGAGCAGCACCCCAAT NM_021833 ACGACACGGTCCAGGAGTTC XM_042251 GGAGATGGCACAGGAGGAAA
ND 1, NADH dehydrogenase subunit 1.
Probe
Reverse primer
CCATCACCCTCTACATCACCGCCC CGCAGTCACAACACTTACAAGCCAAAC TCCAACGCTGGGCAATTCTTCTA AGAGTTTGACGATGGCACCCCAGCTA TTGTTCCACCTCTCCATCAGCCA AGCCATCTGAGCCAGGACAGCTTCCTAA CAGATGCAGCCTCATTTCCACCTTTTG TGTAGAGCACCAAGCAATATCATTTATG CATCTGCTACAGGGCCAAAGCCACCT TCACCGCAGGGAAAGAAACAGCACC CATCTACGGTGAGCGCTTCCCCG
GAGCGATGGTGAGAGCTAAGGT GGGTCATTTGGTGACTCTGG TCCGCCCTATAAGCATCTTGA ATCCTTGGCTATCTGGGACATG CCCTGTAACGTGGCCCAAT TGAAAGCGTGTCCGTGATGA CTGCAATACCTGGCTTTTCTCA GTTCAACTTTCATTGCCATTTCAG CTGCAATCATGTAGGAAACTCCATAG ACCAGCTAAAATCTTGCTTCCTAAAC CGTAGTGCTTCAGTTTGAAGTTCTCA
6652
J Clin Endocrinol Metab, December 2005, 90(12):6650 – 6656
clamped and sealed, and perchloric acid was injected through a rubber diaphragm into the medium, driving CO2 through a tunnel into an adjacent well where it was trapped in 1 n NaOH. After trapping, medium was spun twice for the measurement of [14C]ASPs. Aliquots of NaOH and medium were transferred into scintillation vials, and radioactivity was measured on a multipurpose scintillation counter (model LS 6500; Beckman Instruments, Fullerton, CA). After assay, cells were placed on ice, washed twice with ice-cold Dulbecco’s PBS, and harvested into 0.05% SDS lysis buffer for subsequent protein measurement. Assays were performed in duplicate, and data were normalized to protein content. Absolute rates of FAO were adjusted for specific activity to account for the dilution of [14C]palmitate with unlabeled palmitate.
Glycerol concentration assay The concentration of glycerol in media after 48 h of culture of differentiated adipocytes with tested treatments was performed in duplicate using a microanalysis analyzer CMA 600 (CMA Microdialysis AB, Solna, Sweden). Linearity for glycerol assay was 2–500 mol/liter and adjusted for cellular protein content determined by bicinchoninic acid protein assay (Pierce, Rockford, IL).
Statistical analyses Results from in vitro experiments are expressed as means ⫾ se. Given differences between donors, data are presented as a percentage ⫾ se of appropriate control value (set as 100%). Statistical analyses were performed using Statistica (version 6; StatSoft Inc., Tulsa, OK). Significant differences were established by one-way ANOVA with least significant differences post hoc and assumed as significant if P ⱕ 0.05.
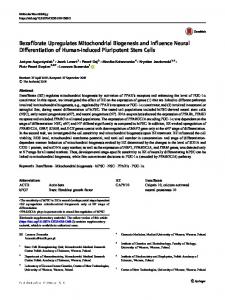
FIG. 1. Effects of forskolin (F) (4 M); PIO (1 M), ROSI (1 M), and GW 929 (GW) (100 nM), PPAR␥ agonists; WY-14,643 (WY) (10 M), PPAR␣ agonist; T0070907 (T) (1 M), PPAR␥ antagonist; and T0070907 plus PIO (T⫹PIO) on mRNA expression of PGC-1␣ (A), mtTFA (B), Cyt c (C), mtDNA copy number (D), and UCP-1 (E). Differentiated in vitro human adipocytes were cultured for 96 h without (control) or with specific treatments. Media and treatments were changed every day. RNA and DNA were extracted, and quantitative realtime PCR was applied to determine the levels of various mRNAs or mtDNA copy number. Data represent the mean percentage expression levels of each treatment relative to controls. Results were collected from 10 –12 replicate experiments in five to six donors. Conditions with similar letters are not significantly different.
Bogacka et al. • Mitochondrial Biogenesis in Human Adipocytes
Results Expression of genes related to mitochondrial biogenesis and FAO
To examine the pathways regulating mitochondrial biogenesis and FAO in WAT, we examined an in vitro model of differentiated human adipocytes treated 96 h with a cAMP/ protein kinase A (PKA) activator, forskolin or agonists of PPAR␥ and PPAR␣. Effect of forskolin
To determine whether forskolin affected mitochondrial biogenesis we measured mtDNA copy number and the expression of genes regulating mitochondrial biogenesis. Four days of treatment of differentiated adipocytes with forskolin significantly increased the mitochondrial copy number (⬃44% increase; P ⬍ 0.01) (Fig 1D) and the expression of genes involved in mitochondrial biogenesis: PGC-1␣ (2-fold increase; P ⬍ 0.0001) (Fig. 1A), mtTFA (50% increase; P ⬍ 0.0001) (Fig. 1B), and cytochrome c (Cyt c) (2.5-fold increase; P ⬍ 0.0001) (Fig. 1C). Forskolin did not change expression of NRF-1, believed to be involved in mitochondrial biogenesis (data not shown). Additionally, forskolin increased a marker of brown adipocytes, UCP-1 mRNA expression, 6-fold (Fig.
Bogacka et al. • Mitochondrial Biogenesis in Human Adipocytes
1E). The incubation of adipocytes with forskolin caused a an up-regulation of mRNA expression for PPAR␣ (P ⬍ 0.0001) (Fig. 2A) and MCAD (P ⱕ 0.05) (Fig. 2B), key factors driving FAO in several tissues, but not CPT-1, the enzyme catalyzing entry of fatty acids into the mitochondrial matrix (Fig. 1C). Effect of PPAR agonists
PPAR␥ as well as PPAR␣ ligands significantly increased mtDNA copy number (Fig. 1D) and mRNA for UCP-1 (7- to 40-fold increase) (Fig. 1E). The addition of the PPAR␥ antagonist T0070907 (28) significantly reduced the stimulatory effect of PIO on mtDNA copy number (Fig. 1D). This antagonist given alone did not change mtDNA compared with control (Fig. 2D). Unexpectedly, PPAR␥ agonists did not change mRNA expression for PGC-1␣, a key factor involved in mitochondrial biogenesis (Fig. 1A), or mitochondrial transcriptional factor A (Fig. 1B). Cyt c mRNA expression was higher after ROSI treatment (P ⬍ 0.05) (Fig. 1C) and tended to increase after PIO, GW 929, and WY-14,643 (P ⫽ 0.081) (Fig. 1C). The presence of the PPAR␥ antagonist T0070907 (28) in the culture, alone or in combination with PIO, significantly reduced mRNA levels of TFA (P ⬍ 0.001) (Fig. 1B) and Cyt c (P ⬍ 0.05) (Fig. 1C) but not PGC-1␣ (Fig. 1A). The treatment of adipocytes with PPAR␥ (PIO, ROSI, and GW 929) or PPAR␣ (WY-14,643) agonists did not significantly change mRNA expression for PPAR␣ (Fig. 2A). The culture of adipocytes with the specific PPAR␥ antagonist T0070907 alone or in combination with PIO also had no effect on PPAR␣ mRNA level. However, all of the factors (PPAR␥ as well PPAR␣ agonists) markedly and significantly increased mRNA expression for MCAD (Fig. 2B) and CPT-1 (Fig. 2C). The classic PPAR␣ target gene, CPT-1 mRNA, increased about 4-fold with all tested agonists of PPAR␥ (P ⬍ 0.0001) (Fig. 2C) and about 2.5-fold after PPAR␣ activation (P ⬍ 0.05) (Fig. 2C). The stimulatory effect of the PPAR␣ agonist on CPT-1 and MCAD mRNA levels was significantly smaller than PPAR␥ agonists. Furthermore, the addition of
FIG. 2. Effects of forskolin (F) (4 M); PIO (1 M), ROSI (1 M), and GW 929 (GW) (100 nM), PPAR␥ agonists; WY-14,643 (WY) (10 M), PPAR␣ agonist; T0070907 (T) (1 M), PPAR␥ antagonist; and T0070907 plus PIO (T⫹PIO) on mRNA expression of genes involved in fatty acid transport and oxidation: PPAR␣ (A), MCAD (B), CPT-1 (C), and CD36 (D). Differentiated in vitro human adipocytes were cultured for 96 h without (control) or with specific treatments. Media and treatments were changed every day. RNA and DNA were extracted, and quantitative real-time PCR was applied to determine the levels of various mRNAs or mtDNA copy number. Data represent the mean percentage expression levels of each treatment relative to controls. Results were collected from 10 –12 replicate experiments in five to six donors (for CD36 from five replicates in two donors). Conditions with similar letters are not significantly different.
J Clin Endocrinol Metab, December 2005, 90(12):6650 – 6656
6653
the specific PPAR␥ antagonist T0070907 in combination with PIO abolished the stimulatory effect of PIO on MCAD and CPT-1 mRNA expression (Fig. 2, B and C, respectively). Interestingly, culture of the cells with PPAR␥ antagonist alone also diminished the expression of the MCAD and CPT-1 compared with control. We have chosen MCAD as a marker of mitochondrial FAO capacity to maintain consistency with previously published data (3). FAO
The end (CO2) and intermediate products (ASPs) of FAO were measured after 48 and 96 h of adipocyte culture with forskolin, PPAR␥ (PIO, ROSI, and GW 929) or PPAR␣ (WY14,643) agonists. Forskolin markedly increased the level of ASPs after 96 h (3-fold increase) (Fig. 3, A and B) as well as CO2 at the two tested time points (2- to 3-fold increase) (Fig. 3, C and D). PPAR␥ as well PPAR␣ agonists generally did not change ASPs levels after 48 h of incubation but slightly (45– 100%) increased after 96 h. The CO2 levels were clearly higher (64 –152%) after ROSI, GW 929, and WY-14,643 but not after PIO treatment. This was consistent across the four replicates, each from a different donor. We observed similar patterns in CO2 release after 48 and 96 h of treatment (Fig. 3, A and B). Glycerol concentration
Glycerol levels were measured after 48 h of treatment of differentiated adipocytes. Addition of forskolin caused a statistically significant, approximately 4-fold increase in glycerol released to the media (Fig. 4). In contrast, culture of adipocytes with PPAR agonists (␥ or ␣) did not change glycerol levels relative to control (Fig. 4). Discussion
Adipocytes are classically divided into two distinct categories: white lipid-storing adipocytes and brown lipid-oxi-
6654
J Clin Endocrinol Metab, December 2005, 90(12):6650 – 6656
Bogacka et al. • Mitochondrial Biogenesis in Human Adipocytes
FIG. 3. Effect of forskolin (F) (4 M); PIO (1 M), ROSI (1 M), and GW 929 (GW) (100 nM), PPAR␥ agonists; and WY-14,643 (WY) (10 M), PPAR␣ agonist, on 14C-labeled ASPs (water-soluble intermediate metabolites) and 14CO2 end products of FAO determined in human differentiated adipocytes after 48 and 96 h of culture with specific treatments. Data represent the mean percent fat oxidation of each treatment relative to controls. Results were collected from four to six replicate experiments in two to three donors.
dizing adipocytes. Earlier in vivo studies from our laboratory suggest that the distinction between white and brown adipocytes is less clear than originally presumed (3), because activation of the PPAR␥ pathway in vivo increased mitochondrial number and genes involved in fat oxidation. These changes were concomitant with a clinically significant reduction in blood triglyceride levels. In the absence of histological localization, those earlier studies could not distinguish the emergence/differentiation of quiescent brown adipocytes in the white fat depot from the true remodeling/ conversion of a white adipocyte into a more oxidative tan phenotype. Our present studies were undertaken to better understand pathways regulating mitochondrial biogenesis and FAO in human differentiated adipocytes.
FIG. 4. Glycerol concentration determined in media after 48-h culture of human differentiated adipocytes with forskolin (F) (4 M); PPAR␥ agonists PIO (1 M), ROSI (1 M), and GW 929 (GW) (100 nM); and PPAR␣ agonist WY-14,643 (WY) (10 M). Results were collected from four replicates. Conditions with similar letters are not significantly different.
We found that forskolin, a well-known activator of the cAMP/PKA pathway, increased mitochondrial copy number measured by real-time PCR. Forskolin also increased the transcription of mitochondrial biogenesis genes (PGC-1␣ and mtTFA) and nuclear encoded mitochondrial gene Cyt c. PGC-1␣ is a positive regulator of mitochondrial biogenesis, and its expression is increased after cold exposure, hyperphagia, or adrenergic stimulators affecting the cAMP/ PKA pathway in brown adipocytes and muscle (29, 30). PGC-1␣ can be activated by at least two ways, first by cAMP/ PKA cascade activating PGC-1␣ gene expression and second by activation of the p38 MAPK and/or cAMP/p38 MAPK cascade leading to direct phosphorylation of the PGC-1␣ protein itself (8). In the present study, we found that forskolin treatment significantly increased expression of the majority of tested genes involved in mitochondrial biogenesis including PGC-1␣, mtTFA, and Cyt c. UCP-1, a specific marker and key regulator of thermogenesis in BAT, was also increased after forskolin treatment. Many reports suggest that the expression and activity of UCP-1 in BAT is predominantly regulated by the sympathetic system via stimulation of -adrenergic receptors (31). The increase in UCP-1 expression in our experiments was accompanied by an increase in FAO. Our results showed that forskolin induces the expression of several genes regulating mitochondrial FAO in WAT as observed in other previously described tissues (31). We observed higher expression of PPAR␣ and MCAD but not CPT-1 after forskolin treatment. Additionally, we found markedly higher FAO measured after 48 and 96 h. We observed a 3.5-fold higher level of glycerol released from adipocytes cultured in the presence of forskolin but no effect of forskolin on expression of the fatty acid transporter FAT/CD36. This indicates that forskolin affects triglyceride stores rather than the import of fatty acids from the extra-
Bogacka et al. • Mitochondrial Biogenesis in Human Adipocytes
cellular space. Summarizing, the effect of forskolin on mitochondrial biogenesis and FAO in human differentiated adipocytes is strong and similar to that previously reported in rodent brown adipocytes and muscle (9, 32). In contrast to forskolin, which exhibited a direct and robust stimulatory effect on mitochondrial biogenesis/FAO pathways, the effect of PPAR agonist on mitochondrial biogenesis and FAO is subtly different in the present study. Our results showed that all three tested PPAR␥ agonists significantly increased mtDNA but had a smaller effect on Cyt c and no effect on PGC-1␣ and mtTFA, factors implicated in mitochondrial replication. In contrast to forskolin, the treatment of cells with a PPAR␥ antagonist alone (28) or in combination with PIO did not change PGC-1␣ mRNA expression but significantly diminished TFA and Cyt c mRNA levels. These in vitro results are only partially consistent with our recently published data in vivo showing that long-term activation of PPAR␥ by PIO in type 2 diabetic patients significantly increased mtDNA copy number and the expression of genes involved in mitochondrial biogenesis (PGC-1␣ and mtTFA but not NRF-1) (3). PIO also had a stimulatory effect on the expression of genes involved in fatty acid transport and -oxidation; those are classically thought of as PPAR␣ targets (3). PIO did not change energy expenditure or substrate oxidations as measured by indirect calorimetry (33). One interpretation of our in vitro results is the possibility of reprogramming of white fat cells into an intermediate fatoxidizing phenotype, i.e. tan or brownish adipocyte. Furthermore, adipose tissue contributes to whole-body energy at rest, albeit only minimally compared with the lean tissue. This may explain the differences between our results and whole-body energy expenditure and fat metabolism. It has been reported that PPAR␥ activators [thiazolidinediones (TZDs) and non-TZD agonists] increase mitochondrial biogenesis, FAO, and white adipocyte remodeling in rodents (31, 34 –36). Recently, Wilson-Fritch et al. (35) demonstrated a stimulatory effect of ROSI on mitochondrial biogenesis and remodeling of WAT with concomitant 30% increase of FAO and oxygen consumption in adipocytes isolated from mice. They observed a 2-fold increase in mitochondrial mass and a higher expression of mitochondrial proteins involved in fatty acid transport and oxidation (35); the mechanisms responsible for these described processes remain to be explored. Although Wilson-Fritch et al. (35) predicted only that PGC-1␣ could play a role in mitochondrial biogenesis, they did not report the gene expression or protein level for this key regulator. In another study performed in rodents, PPAR␥ activation up-regulated UCP-1 and other thermogenic genes (e.g. PGC-1␣) mRNA expression but without an increase in whole-body energy expenditure (31). Higher energy expenditure after non-TZD PPAR␥ agonist treatment occurred only after -adrenergic stimulation (31). In the present study, the higher mtDNA copy number and increased expression of genes involved in fatty acid transport/-oxidation had a similar pattern for three tested PPAR␥ agonists. However, these PPAR␥ agonists did not affect FAO in the same way as determined by the levels of end and intermediate products. We found a clear increase (about 100%) in ASPs and CO2 production determined after 48 or 96 h of incubation for ROSI and GW 929 but not for PIO
J Clin Endocrinol Metab, December 2005, 90(12):6650 – 6656
6655
(all are PPAR␥ agonists). The addition of PIO did not change CO2 levels after 48 or 96 h, although ASP concentration was about 50% higher after 96 h. This observation suggests that although activation of PPAR␥ receptors by PIO and ROSI cause similar changes in body weight and fat remodeling, they have divergent actions on energy dissipation; this may depend upon coactivator recruitment (37, 38). Interestingly, specific activation of PPAR␥ by ROSI and GW increased levels of intermediate and end products of FAO but did not change PPAR␣ mRNA expression, as we found in vivo. We can only predict that activity of PPAR␣, a key factor driving FAO in several tissues, could be changed in our study not by TZDs but by higher expression of lipolysis products. It has been recently shown that lipoprotein lipase generates PPAR␣ ligands in endothelial cells (39). Several reports indicate a stimulatory effect of PPAR␥ inducers on lipoprotein lipase activity in other tissues (25). The question of why PIO increases expression of genes driving the transport of fatty acids into mitochondria (CPT-1) and the first step of FAO (MCAD), but has no effect on FAO, remains unresolved. Another important question is why PIO and ROSI, both TZDs/PPAR␥ compounds, differentially regulate FAO. PPAR␥ activation increased the expression of mRNA for UCP-1 in agreement with our previous in vivo results and many others (31, 35, 40, 41). A functional PPAR response element has been found within the UCP-1 promoter (42), and PPAR␥ agonists promote differentiation in BAT as well as in WAT. UCP-1 is induced in both tissues by TZDs in rodents. The cells expressing UCP-1 were described as newly created brown adipocytes. This is not possible in our fully differentiated adipocytes, suggesting plasticity of white adipocytes into tan adipocytes. The enhanced expression of this brownspecific gene UCP-1 was also observed after exogenous insertion of PGC-1␣ into human adipocytes (41). In our study we demonstrated higher mtDNA copy number and UCP-1 mRNA level, but PGC-1␣ mRNA did not change. The possible explanation for higher mtDNA copy number and no effect on PGC-1␣ mRNA expression could be involvement of additional PPAR␥ ligand-dependent cascades regulating nuclear-encoded mitochondrial genes or directly phosphorylating PGC-1␣ protein, not gene expression (for review see Ref. 8). The limitation of the study was measurement of only gene expression and FAO products. We did not determine protein content. The studies presented herein demonstrate, in fully differentiated adipocytes, that pharmacological activation of the cAMP or PPAR␥ pathway pushes the white adipocyte down the oxidative continuum. This is consonant with earlier studies that genetically modify adipocytes to alter the oxidative phenotype in similar cells (41, 43). The importance of this observation lies in the clinic, where the pharmacological activation of these pathways is known to improve the features of the metabolic syndrome (33, 44). This suggests that the progress of an adipocyte along an oxidative pathway might play a key role in the genesis of the metabolic syndrome. Acknowledgments We acknowledge the helpful technical assistance of Jana Smith and Gail Kilroy.
6656
J Clin Endocrinol Metab, December 2005, 90(12):6650 – 6656
Received May 9, 2005. Accepted September 23, 2005. Address all correspondence and requests for reprints to: Iwona Bogacka, Pennington Biomedical Research Center, Department of Molecular Endocrinology, 6400 Perkins Road, Baton Rouge, Louisiana 70808. E-mail:
[email protected] or
[email protected]. This work was supported by Takeda Pharmaceuticals North America as an unrestricted educational grant.
Bogacka et al. • Mitochondrial Biogenesis in Human Adipocytes
22. 23.
24.
References 1. Fernandez-Silva P, Enriquez JA, Montoya J 2003 Replication and transcription of mammalian mitochondrial DNA. Exp Physiol 88:41–56 2. Kelly DP, Scarpulla RC 2004 Transcriptional regulatory circuits controlling mitochondrial biogenesis and function. Genes Dev 18:357–368 3. Bogacka I, Xie H, Bray GA, Smith SR 2005 Pioglitazone induces mitochondrial biogenesis in human subcutaneous adipose tissue in vivo. Diabetes 54:1392–1399 4. Petersen KF, Dufour S, Befroy D, Garcia R, Shulman GI 2004 Impaired mitochondrial activity in the insulin-resistant offspring of patients with type 2 diabetes. N Engl J Med 350:664 – 671 5. Mootha VK, Lindgren CM, Eriksson KF, Subramanian A, Sihag S, Lehar J, Puigserver P, Carlsson E, Ridderstrale M, Laurila E, Houstis N, Daly MJ, Patterson N, Mesirov JP, Golub TR, Tamayo P, Spiegelman B, Lander ES, Hirschhorn JN, Altshuler D, Groop LC 2003 PGC-1␣-responsive genes involved in oxidative phosphorylation are coordinately downregulated in human diabetes. Nat Genet 34:267–273 6. Patti ME, Butte AJ, Crunkhorn S, Cusi K, Berria R, Kashyap S, Miyazaki Y, Kohane I, Costello M, Saccone R, Landaker EJ, Goldfine AB, Mun E, DeFronzo R, Finlayson J, Kahn CR, Mandarino LJ 2003 Coordinated reduction of genes of oxidative metabolism in humans with insulin resistance and diabetes: potential role of PGC1 and NRF1. Proc Natl Acad Sci USA 100:8466 – 8471 7. Petersen KF, Befroy D, Dufour S, Dziura J, Ariyan C, Rothman DL, DiPietro L, Cline GW, Shulman GI 2003 Mitochondrial dysfunction in the elderly: possible role in insulin resistance. Science 300:1140 –1142 8. Puigserver P, Spiegelman BM 2003 Peroxisome proliferator-activated receptor-␥ coactivator 1␣ (PGC-1␣): transcriptional coactivator and metabolic regulator. Endocr Rev 24:78 –90 9. Puigserver P 2005 Tissue-specific regulation of metabolic pathways through the transcriptional coactivator PGC1-␣. Int J Obes Relat Metab Disord 29(Suppl 1):S5–S9 10. Wu Z, Puigserver P, Andersson U, Zhang C, Adelmant G, Mootha V, Troy A, Cinti S, Lowell B, Scarpulla RC, Spiegelman BM 1999 Mechanisms controlling mitochondrial biogenesis and respiration through the thermogenic coactivator PGC-1. Cell 98:115–124 11. Hagen T, Vidal-Puig A 2002 Mitochondrial uncoupling proteins in human physiology and disease. Minerva Med 93:41–57 12. Crowley V, Vidal-Puig AJ 2001 Mitochondrial uncoupling proteins (UCPs) and obesity. Nutr Metab Cardiovasc Dis 11:70 –75 13. Russell AP, Feilchenfeldt J, Schreiber S, Praz M, Crettenand A, Gobelet C, Meier CA, Bell DR, Kralli A, Giacobino JP, Deriaz O 2003 Endurance training in humans leads to fiber type-specific increases in levels of peroxisome proliferator-activated receptor-␥ coactivator-1 and peroxisome proliferatoractivated receptor-␣ in skeletal muscle. Diabetes 52:2874 –2881 14. Herzig S, Long F, Jhala US, Hedrick S, Quinn R, Bauer A, Rudolph D, Schutz G, Yoon C, Puigserver P, Spiegelman B, Montminy M 2001 CREB regulates hepatic gluconeogenesis through the coactivator PGC-1. Nature 413:179 –183 15. Yoon JC, Puigserver P, Chen G, Donovan J, Wu Z, Rhee J, Adelmant G, Stafford J, Kahn CR, Granner DK, Newgard CB, Spiegelman BM 2001 Control of hepatic gluconeogenesis through the transcriptional coactivator PGC-1. Nature 413:131–138 16. Semple RK, Crowley VC, Sewter CP, Laudes M, Christodoulides C, Considine RV, Vidal-Puig A, O’Rahilly S 2004 Expression of the thermogenic nuclear hormone receptor coactivator PGC-1␣ is reduced in the adipose tissue of morbidly obese subjects. Int J Obes Relat Metab Disord 28:176 –179 17. Puigserver P, Wu Z, Park CW, Graves R, Wright M, Spiegelman BM 1998 A cold-inducible coactivator of nuclear receptors linked to adaptive thermogenesis. Cell 92:829 – 839 18. Kakuma T, Wang ZW, Pan W, Unger RH, Zhou YT 2000 Role of leptin in peroxisome proliferator-activated receptor-␥ coactivator-1 expression. Endocrinology 141:4576 – 4582 19. Lee Y, Yu X, Gonzales F, Mangelsdorf DJ, Wang MY, Richardson C, Witters LA, Unger RH 2002 PPAR␣ is necessary for the lipopenic action of hyperleptinemia on white adipose and liver tissue. Proc Natl Acad Sci USA 99: 11848 –11853 20. Knutti D, Kaul A, Kralli A 2000 A tissue-specific coactivator of steroid receptors, identified in a functional genetic screen. Mol Cell Biol 20:2411–2422 21. Vega RB, Huss JM, Kelly DP 2000 The coactivator PGC-1 cooperates with peroxisome proliferator-activated receptor-␣ in transcriptional control of nu-
25. 26.
27. 28.
29. 30. 31.
32.
33. 34.
35.
36. 37. 38.
39.
40.
41. 42. 43. 44.
clear genes encoding mitochondrial fatty acid oxidation enzymes. Mol Cell Biol 20:1868 –1876 Delerive P, Wu Y, Burris TP, Chin WW, Suen CS 2002 PGC-1 functions as a transcriptional coactivator for the retinoid X receptors. J Biol Chem 277:3913–3917 Hauner H, Entenmann G, Wabitsch M, Gaillard D, Ailhaud G, Negrel R, Pfeiffer EF 1989 Promoting effect of glucocorticoids on the differentiation of human adipocyte precursor cells cultured in a chemically defined medium. J Clin Invest 84:1663–1670 Halvorsen YD, Bond A, Sen A, Franklin DM, Lea-Currie YR, Sujkowski D, Ellis PN, Wilkison WO, Gimble JM 2001 Thiazolidinediones and glucocorticoids synergistically induce differentiation of human adipose tissue stromal cells: biochemical, cellular, and molecular analysis. Metabolism 50:407– 413 Bogacka I, Xie H, Bray GA, Smith SR 2004 The effect of pioglitazone on peroxisome proliferator-activated receptor-␥ target genes related to lipid storage in vivo. Diabetes Care 27:1660 –1667 Muoio DM, Way JM, Tanner CJ, Winegar DA, Kliewer SA, Houmard JA, Kraus WE, Dohm GL 2002 Peroxisome proliferator-activated receptor-␣ regulates fatty acid utilization in primary human skeletal muscle cells. Diabetes 51:901–909 Ukropcova B, McNeil M, Sereda O, de Jonge L, Xie H, Bray GA, Smith SR 2005 Dynamic changes in fat oxidation in human primary myocytes mirror metabolic characteristics of the donor. J Clin Invest 115:1934 –1941 Lee G, Elwood F, McNally J, Weiszmann J, Lindstrom M, Amaral K, Nakamura M, Miao S, Cao P, Learned RM, Chen JL, Li Y 2002 T0070907, a selective ligand for peroxisome proliferator-activated receptor-␥, functions as an antagonist of biochemical and cellular activities. J Biol Chem 277:19649 –19657 Rothwell NJ, Stock MJ 1997 A role for brown adipose tissue in diet-induced thermogenesis. Obes Res 5:650 – 656 Ricquier D, Bouillaud F 2000 Mitochondrial uncoupling proteins: from mitochondria to the regulation of energy balance. J Physiol 529:3–10 Sell H, Berger JP, Samson P, Castriota G, Lalonde J, Deshaies Y, Richard D 2004 Peroxisome proliferator-activated receptor-␥ agonism increases the capacity for sympathetically mediated thermogenesis in lean and ob/ob mice. Endocrinology 145:3925–3934 Marette A, Bukowiecki LJ 1991 Noradrenaline stimulates glucose transport in rat brown adipocytes by activating thermogenesis. Evidence that fatty acid activation of mitochondrial respiration enhances glucose transport. Biochem J 277:119 –124 Smith SR, De Jonge L, Volaufova J, Li Y, Xie H, Bray GA 2005 Effect of pioglitazone on body composition and energy expenditure: a randomized controlled trial. Metabolism 54:24 –32 Wilson-Fritch L, Burkart A, Bell G, Mendelson K, Leszyk J, Nicoloro S, Czech M, Corvera S 2003 Mitochondrial biogenesis and remodeling during adipogenesis and in response to the insulin sensitizer rosiglitazone. Mol Cell Biol 23:1085–1094 Wilson-Fritch L, Nicoloro S, Chouinard M, Lazar MA, Chui PC, Leszyk J, Straubhaar J, Czech MP, Corvera S 2004 Mitochondrial remodeling in adipose tissue associated with obesity and treatment with rosiglitazone. J Clin Invest 114:1281–1289 Toseland CD, Campbell S, Francis I, Bugelski PJ, Mehdi N 2001 Comparison of adipose tissue changes following administration of rosiglitazone in the dog and rat. Diabetes Obes Metab 3:163–170 Wu Y, Chin WW, Wang Y, Burris TP 2003 Ligand and coactivator identity determines the requirement of the charge clamp for coactivation of the peroxisome proliferator-activated receptor-␥. J Biol Chem 278:8637– 8644 Dulloo AG, Gubler M, Montani JP, Seydoux J, Solinas G 2004 Substrate cycling between de novo lipogenesis and lipid oxidation: a thermogenic mechanism against skeletal muscle lipotoxicity and glucolipotoxicity. Int J Obes Relat Metab Disord 28(Suppl 4):S29 –S37 Ziouzenkova O, Perrey S, Asatryan L, Hwang J, MacNaul KL, Moller DE, Rader DJ, Sevanian A, Zechner R, Hoefler G, Plutzky J 2003 Lipolysis of triglyceriderich lipoproteins generates PPAR ligands: evidence for an antiinflammatory role for lipoprotein lipase. Proc Natl Acad Sci USA 100:2730 –2735 Fukui Y, Masui S, Osada S, Umesono K, Motojima K 2000 A new thiazolidinedione, NC-2100, which is a weak PPAR-␥ activator, exhibits potent antidiabetic effects and induces uncoupling protein 1 in white adipose tissue of KKAy obese mice. Diabetes 49:759 –767 Tiraby C, Tavernier G, Lefort C, Larrouy D, Bouillaud F, Ricquier D, Langin D 2003 Acquirement of brown fat cell features by human white adipocytes. J Biol Chem 278:33370 –33376 Sears IB, MacGinnitie MA, Kovacs LG, Graves RA 1996 Differentiation-dependent expression of the brown adipocyte uncoupling protein gene: regulation by peroxisome proliferator-activated receptor-␥. Mol Cell Biol 16:3410 –3419 Digby JE, Montague CT, Sewter CP, Sanders L, Wilkison WO, O’Rahilly S, Prins JB 1998 Thiazolidinedione exposure increases the expression of uncoupling protein 1 in cultured human preadipocytes. Diabetes 47:138 –141 Rangwala SM, Lazar MA 2004 Peroxisome proliferator-activated receptor-␥ in diabetes and metabolism. Trends Pharmacol Sci 251–256
JCEM is published monthly by The Endocrine Society (http://www.endo-society.org), the foremost professional society serving the endocrine community.