Thin-Walled Structures 80 (2014) 46–56
Contents lists available at ScienceDirect
Thin-Walled Structures journal homepage: www.elsevier.com/locate/tws
Structural behavior of concrete filled steel tubular sections (CFT/CFSt) under axial compression Burak Evirgen a,n, Ahmet Tuncan b, Kivanc Taskin b a b
Department of Civil Engineering, Faculty of Engineering, Anadolu University, 26555 Eskisehir, Turkey Anadolu University, Department of Civil Engineering, Turkey
art ic l e i nf o
a b s t r a c t
Article history: Received 6 August 2013 Received in revised form 22 February 2014 Accepted 24 February 2014
In this study, compressive strength, modulus of elasticity and steel tensile coupon tests are performed to determine material properties. Sixteen hollow cold formed steel tubes and 48 concrete filled steel tube specimens are used for axial compression tests. The effects of width/thickness ratio (b/t), the compressive strength of concrete and geometrical shape of cross section parameters on ultimate loads, axial stress, ductility and buckling behavior are investigated. Circular, hexagonal, rectangular and square sections, 18.75, 30.00, 50.00, 100.00 b/t ratio values and 13, 26, 35 MPa concrete compressive strength values are chosen for the experimental procedure. Analytical models of specimens are developed using a finite element program (ABAQUS) and the results are compared. Circular specimens are the most effective samples according to both axial stress and ductility values. The concrete in tubes has experienced considerable amount of deformations which is not expected from such a brittle material in certain cases. The results provide an innovative perspective on using cold formed steel and concrete together as a composite material. & 2014 Elsevier Ltd. All rights reserved.
Keywords: CFT CFST Axial stress Displacement Ductility ABAQUS
1. Introduction Tension and compression stresses occur at different regions according to the loads and load conditions in structural members. It can be seen that the optimum resisting section against these stresses in the same member is the reinforced concrete which has had a composite structure since the 1850s. However, recent studies concerning concrete filled steel tubes (CFST) have become important in the area of structural engineering. Structural members have enough bearing capacity against internal forces according to dead loads and live loads caused by external effects in normal conditions. However, extra shear forces and moments created by seismic movements or dynamic vibrations during earthquakes force the capacities of members. Conventional reinforced cross sections might be of higher dimensions than required during the design stage because of this. Concrete filled steel tubes have a high ductility and bearing capacity. This system provides for rapid construction without removing any formwork. Steel members prevent lateral expansion of concrete as seen with stirrups. Steel tube performs both longitudinal and
n
Corresponding author. Tel.: þ 90 222 3213550x7121; fax: þ 90 222 3239501. E-mail addresses:
[email protected] (B. Evirgen),
[email protected] (A. Tuncan),
[email protected] (K. Taskin). http://dx.doi.org/10.1016/j.tws.2014.02.022 0263-8231 & 2014 Elsevier Ltd. All rights reserved.
lateral reinforcement as well as it is used in formwork. A concrete core resists axial force, at the same time preventing the buckling of steel in an inward direction on a tube. The main design criteria of Turkish Earthquake Codes, based on the human life sustainability during earthquakes, can be easily provided by the ductility behavior of CFST members easily. The use of steel walled composite cross sections is becoming widespread in civil engineering. The main purpose of using CFST members is to provide maximum bearing capacity prior to possible buckling modes. Local buckling is expected in the case of the inadequate confinement effects by steel tube or inadequate concrete core strength in a composite section. The confinement effect is called the radial pressure created by steel tubes. It operates in the same manner as stirrups and alters the buckling mode. Slenderness is also an important effect on the buckling mode determined using the dimensions of members. Most researchers have focused on the strength, ductility, deformation, buckling and confinement effects created by the change of cross section areas and shape, the interaction of composite materials, the strength of materials, strengthening bars, and member lengths and width (or diameter)/thickness ratios (b/t) under normal load or bending moment conditions. Hu et al. [1] investigated the confinement effects on 24 circular, square and strengthened square sectioned specimens with a range of 17–150 b/t ratio under compression. The maximum confinement effects
B. Evirgen et al. / Thin-Walled Structures 80 (2014) 46–56
were seen on circular specimens (b/t o40). Little confinement effects were observed on square sections (b/t430). Other experimental tests were performed on composite stub columns produced with b/t ratio values between 15 and 59. The results indicate that circular shaped specimens produced three dimensional inclusive confinement effects on core concrete (Knowles and Park [2]). An experimental study was performed on elliptical concrete filled tubular specimens with a range of 69–160 b/t ratio under centric loading (Uenaka [3]). They showed that the axial load capacity of elliptical CFST columns can be estimated by the equation including confinement effect of smaller diameter direction. Gupta et al. [4] showed that lower b/t ratios provide higher confinement effects on the test results of 81 specimens having the ratios of between 25 and 39. Hu et al. [5] investigated the interaction and confinement effects on CFT columns under a combination of axial compression and bending moment. More lateral confinement pressure was observed in strengthened circular specimens with an increasing axial loading ratio. The behavior of stub CFT column under concentric loading on 11 specimens was studied by Sakino et al. [6]. Chitawadagi et al. [7] demonstrated that the most effective parameter is the diameter of a steel tube related with the ultimate axial load and axial shortening on highly slender CFTs. Elchalakani et al. [8] performed a series of bending tests on circular hollow
sections. They showed that the effects of nonlinear bending properties and the regulation of existing slenderness criteria are required for circular hollow sections. Yang et al. [9] investigated the ultimate bearing capacity and buckling mechanisms on 28 cold formed steel specimens having the high tensile strength (550 MPa) and the b/t range between 13 and 119. An approximate six percent difference between the experimental and the analytical results was observed according to the finite element model. The buckling and ultimate strength behavior of cold formed steel mid-length columns was investigated on 16 innovative specimens by Narayanan and Mahendran [10]. Ductility behavior and buckling behavior are the other results of this study. Ductility is the total deformation capacity measurement up to an ultimate point. Serious deformation might occur when the strength of the material is approximately constant throughout the ductile structure. Ductility is an important parameter for the dissipation of energy during earthquakes or blasting
Table 1 Amount of materials for 1 m3 concrete mix design. Material
Estimated compressive strength values of concrete
Cement (kg) Water (kg) 0–5 mm aggregate (kg) 5–15 mm aggregate (kg) 15–22 mm aggregate (kg)
10 MPa
20 MPa
30 MPa
240.0 238.6 808.9 529.7 441.3
313.0 237.1 781.6 511.8 426.3
400.0 236.9 749.1 490.6 408.6
Fig. 1. Concrete compression test equipment.
47
Fig. 2. Modulus of elasticity results for concrete specimens.
Fig. 3. Steel tension coupon test equipment.
48
B. Evirgen et al. / Thin-Walled Structures 80 (2014) 46–56
(Celep and Kumbasar [11]). Ductility or strength of specimens will otherwise suffer sudden decrement if any type of buckling occurs. Three different types of buckling behavior are possible for steel members. First of all, the wide part of the member surface becomes unstable and buckles, then lateral buckling also occurs.
Fig. 4. Tension coupon test results for cold formed steel.
If a loaded point ruptures or deflects in the opposite direction of the near points' curvature, it is called local buckling. A member buckling individually under axial compression is called member buckling (Al Nageim and MacGinley [12]). Compression members produced from fairly thin material might collapse with local buckling and is generally called crippling. If a cross section weakens against the twisting, twist-torsion will occur. A twisttorsion mode is rarely observed for tubular sections (Bresler and Lin [13]). Buckling of walls was observed on the square and rectangular specimens according to Schneider [14]. An experimental study was performed on rectangular and square hollow specimens by Goggins et al. [15] under monolithical and cyclic axial loading. They showed that ductility capacity is in direct proportion with slenderness. Broderick et al. [16] showed that concrete filled sections prevent local buckling and increase ductility capacity under compressive strength. O’Shea and Bridge [17] proved that the reduction in strength and ductility depends on an increase in of b/t value. Fujimoto et al. [18] showed that high strength concrete decreases the strain of concrete filled tubes. Investigation of changes in b/t ratio, concrete compressive strength and cross section shape in the same test procedure is a unique aspect of this study. Load–displacement, axial stress, ductility and buckling characteristics are also studied.
2. Experimental investigations Sixty four specimens were used in the experiment. Each was of 400 mm height and variable ‘b/t’ ratios. The letter ‘b’ refers to the diameter or width of specimen and ‘t’ refers to the thickness of
Fig. 5. Shapes of specimens.
Table 2 Testing specimens. Specimen
Width/thickness Ratio (b/t)
na fcc (MPa)
Specimen
Width/thickness ratio (b/t)
fcca (MPa)
SS1500 SS1510 SS1520 SS1530 SS3000 SS3010 SS3020 SS3030 SS5000 SS5010 SS5020 SS5030 SS8000 SS8010 SS8020 SS8030 RS1500 RS1510 RS1520 RS1530 RS3000 RS3010 RS3020 RS3030 RS5000 RS5010 RS5020 RS5030 RS8000 RS8010 RS8020 RS8030
100.00 100.00 100.00 100.00 50.00 50.00 50.00 50.00 30.00 30.00 30.00 30.00 18.75 18.75 18.75 18.75 100.00 100.00 100.00 100.00 50.00 50.00 50.00 50.00 30.00 30.00 30.00 30.00 18.75 18.75 18.75 18.75
Hollow 13.3 26.0 35.3 Hollow 13.3 26.0 35.3 Hollow 13.3 26.0 35.3 Hollow 13.3 26.0 35.3 Hollow 13.3 26.0 35.3 Hollow 13.3 26.0 35.3 Hollow 13.3 26.0 35.3 Hollow 13.3 26.0 35.3
HS1500 HS1510 HS1520 HS1530 HS3000 HS3010 HS3020 HS3030 HS5000 HS5010 HS5020 HS5030 HS8000 HS8010 HS8020 HS8030 CS1500 CS1510 CS1520 CS1530 CS3000 CS3010 CS3020 CS3030 CS5000 CS5010 CS5020 CS5030 CS8000 CS8010 CS8020 CS8030
100.00 100.00 100.00 100.00 50.00 50.00 50.00 50.00 30.00 30.00 30.00 30.00 18.75 18.75 18.75 18.75 100.00 100.00 100.00 100.00 50.00 50.00 50.00 50.00 30.00 30.00 30.00 30.00 18.75 18.75 18.75 18.75
Hollow 13.3 26.0 35.3 Hollow 13.3 26.0 35.3 Hollow 13.3 26.0 35.3 Hollow 13,3 26.0 35.3 Hollow 13.3 26.0 35.3 Hollow 13.3 26.0 35.3 Hollow 13.3 26.0 35.3 Hollow 13.3 26.0 35.3
a
fcc is the average 28-day compressive strength values of the core concrete.
B. Evirgen et al. / Thin-Walled Structures 80 (2014) 46–56
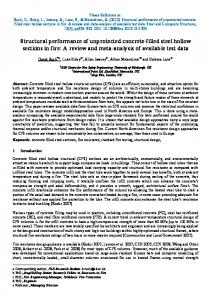
steel plate. Thickness values of 1.5, 3.0, 5.0, 8.0 mm were used providing b/t ratios of 18.75, 30.00, 50.00 and 100.00 for the purpose of determining the effects of duplicated values according to the general literature ranges. 2.1. Material properties The mechanical properties of concrete and steel coupon specimens are examined, having the same strength values as core concrete and tubes. Compressive strength values were chosen within the scope of obtaining the effects of double and triple increased compressive strength values on focused parameters. Concrete mix designs were performed on 27 cylindrical and cubic concrete specimens in total for compressive strength. Seven and 28 days approximate concrete compressive strength values are obtained on the trial samples. The amounts of cement, water and aggregate used during the pour of concrete into the steel tubes are given in Table 1. Compressive strength values are obtained as 13.3, 26.0 and 35.3 MPa after crushing the samples using a compression test machine given in Fig. 1. Modulus of elasticity values were determined as 9150, 21000 and 28000 MPa for concrete specimens using linear interpolation according to the FEMA356 [19] given in Fig. 2. Steel tensile coupon tests were performed on six specimens to determine the mechanical parameters of steel given in Fig. 3. Modulus of elasticity, yield strength, ultimate strength and elongation ratio values were given as 200000 MPa, 255 MPa, 370 MPa and 32.12%, respectively, relating to the average results of tests in Fig. 4. Steel tubes were produced using standard industrial steel plates. Circular tubes were shaped using cylindrical rollers in cold state monolithically and others were spanned using an industrial steel spinning machine. Square, rectangular and hexagonal cross sectional tubes were vertically produced in two equal parts. All twin steel parts and spanned circular sections were welded along the cutting surfaces using an argon welding machine with a minimum 420 MPa yield strength and a minimum 500–640 MPa tensile strength during the welding process. Steel plates of 3 mm thickness and 160 mm by 160 mm or 160 mm by 210 mm dimensions were welded at the top and at the bottom ends as a cap.
Thirty channeled TDS303 type TML data logger was used to obtain a time dependent load versus displacement curve at the same loading steps. Displacement gauges named Linear Variable Differential Transducer (LVDT) were used to measure elongation and shortening along a working axis. Two TML-CDP25 type 2.5 mm capacity LVDTs were used during the tests. A strain gauge was the unit deformation measurement apparatus which worked the electrical output values of the elongation and shortening phenomena placed along the longitudinal direction according to the electrical resistance. The LVDT equipment measured the change in the overall height; with strain gauges measuring the point change. In total, 384 pieces of FLA-6-11-5L type TML of 6 mm length strain gauge equipment was used during testing. The measurement resistance of the strain gauges had to be at 12070.5 Ω range and the bypass of cables had to be prevented. In total, four strain gauges and two
Fig. 6. (a) Location of strain gauges and (b) final position of CFST specimens before tests.
2.2. Test specimens Systematic denotation was used for the geometrical shape of the horizontal cross section of the specimen, wall thickness of steel and compressive strength of core concrete. For example, an SS1500 expression indicates a hollow square specimen with a 1.5 mm wall thickness. The shapes and dimensions of four different models are given in Fig. 5 (SS: square section, RS: rectangular section, HS: hexagonal section, CS: circular section). All the model heights were kept constant at 400 mm. In total, 64 specimens were used to determine the effect of the domain parameters given in Table 2. A circular hole with a 42 mm diameter was bored at the center of the top cap for pouring and vibration of the concrete. A minimum 28-day curing time was applied to gain a standard concrete compressive strength of the core concrete specimens after pouring of concrete into the steel tubes. All the sides of the specimens were covered by hydrated lime to observe possible cracks during the test. 2.3. Test setup and instrumentation Intense labor and time were required for the experimental studies. This study consists of producing specimens, providing materials, designing and placing of concrete, preparing experimental setups, realizing experiments and evaluation of test results.
49
Fig. 7. Axial compression test setup of CFST.
50
B. Evirgen et al. / Thin-Walled Structures 80 (2014) 46–56
Fig. 8. Load displacement curves for hollow specimens.
Fig. 9. Load displacement curves of 13.3 MPa concrete filled tube specimens.
B. Evirgen et al. / Thin-Walled Structures 80 (2014) 46–56
Fig. 10. Load displacement curves of 26.0 MPa for concrete filled tube specimens.
Fig. 11. Load displacement curves of 35.3 MPa for concrete filled tube specimens.
51
52
B. Evirgen et al. / Thin-Walled Structures 80 (2014) 46–56
The increment of ultimate load capacity and displacement of circular and hexagonal hollow specimens were higher than those of square and rectangular specimens as shown in Fig. 8. Circular and hexagonal hollow specimens had two to three times more displacement than the square and rectangular sections according to the confinement effect caused by the composite sections in 13.3 MPa concrete filled steel tube specimens shown in Fig. 9.
In general, deformation values are increased as a result of the elimination of the buckling of steel tube in an inward direction according to the increment of the core concrete compressive strength values. Minimum load can be seen on hexagonal specimens. In addition, circular specimens showed maximum displacement values of 26.0 MPa and 35.3 MPa for concrete filled steel tubes. Square and rectangular specimens carried more load, while they indicated less displacement according to the effective areas of resistance against the load related to the results in Figs. 10 and 11. The changes in ultimate load capacity values are given in Fig. 12 with respect to the cross sectional shape, steel wall thickness and concrete compressive strength. Ultimate load capacity values are also increased according to the increment of concrete compressive strength and steel wall thickness. The ultimate load capacity of composite sections are considerably increased in comparison with the unconfined compressive strength values of concrete and ultimate load capacity values of hollow steel tubes. Some of the specimens with 80 mm steel wall thickness reached the maximum capacity of the compression machine. The increment ratio of ultimate stress capacities of the CFST members, with respect to the initial unconfined concrete compressive strength, are compared according to all the domain parameters given in Table 3. These are average values for each variable. This is one of the main results of this paper. If the steel wall thickness increases, the increment ratio of axial stress values also increases. Despite the decrement in the area of the core concrete, the stress values increase according to the confinement effect increment caused by the steel wall thickness. Maximum axial stress increments are also observed in circular sections for this reason. They have higher values than square and rectangular specimens. Therefore, the axial stress increment ratio of the CFST members decreases with the increment of compressive strength of the core concrete.
Fig. 12. The change in ultimate load values according to the domain parameters.
Fig. 13. The variation of ductility values of CFST specimens.
LVDTs were used for each CFST specimen. Two strain gauges were glued at the front and at the rear sides of the specimens, vertically as shown in Fig. 6. Two other strain gauges were glued to the other sides, vertically. A CLC-2Mna type calibrated TML load cell of 200 t capacity was used to give a required load to the specimen obtained from a hydraulic press rate as shown in Fig. 7. It averaged 0.6 MPa/s of pace rate. The loading capacity was modified using an external energy unit and a stronger loading plate of the required dimensions was produced to eliminate possible errors. Experiments were performed only under the effect of an axial compression load assumption. Possible shear force and bending moment values caused by eccentric loading and deformation during the test process were ignored. The top and bottom ends were assumed to be roller supports that permit only axial force transition.
3. Results The average values of results from two LVDTs and four vertical strain gauges were calculated for each specimen. After this, the average values of these two parameters were bilinearized according to the FEMA356 [19] to obtain the closest realistic estimation of a load displacement curve. 3.1. Load–displacement characteristics
Table 3 Change of ultimate axial stress capacity of composite sections due to the domain parameters. Domain parameter
Increment ratio (%)
Shape of section
Circular 167.8
Hexagonal 150.8
Square 91.1
Rectangular 64.7
Thickness of steel (mm)
1.50 40.4
3.00 99.5
5.00 215.9
8.00 298.3
Compressive strength of concrete (MPa)
13.3 291.6
26.0 122.7
35.3 76.3
B. Evirgen et al. / Thin-Walled Structures 80 (2014) 46–56
53
Fig. 14. Quarter parts of basic CFST specimens at mesh state.
Fig. 15. The variation of ultimate stress values on steel tubes according to the ABAQUS results.
Fig. 16. The variation of ultimate stress values on steel tubes according to the experimental results.
3.2. Ductility characteristics
element (C3D8R eight-node brick element with reduced integration type) were used during the modeling of the core concrete. On the other hand, a deformable, homogeneous shell element (S4R a 4-node doubly curved thin or thick shell, reduced integration type) was used in the modeling of the steel tube. Modulus of elasticity, Poisson's ratio, yield strength and ultimate strength values were defined the same as the mechanical material properties up to the ultimate point for each specimen according to the experimental results. Nonlinear geometry and unsymmetrical solvers were used for the running process with ‘Full Newton’ estimation. Boundary conditions permit only axial deformation along the specimen height. A structured type of mesh control was used to reduce variations of mesh transitions as shown in Fig. 14. In the ABAQUS modeling procedure, estimated displacement of related specimens was applied in a vertical direction as a shortening according to the experimental results. Ultimate stresses on the steel members, which have maximum nodal stress values on specimens, are given in Fig. 15. In the same manner, other graphic data given in Fig. 16 is created for the ultimate stresses that occurred on the steel members for
The circular specimens have maximum ductility behavior when ductility values were analyzed. Ductility values were calculated as a ratio between the maximum deformation at the ultimate load point and the deformation at the elastic limit. All concrete filled specimens have higher ductility than related hollow specimens. The ductility values of 19.8, 11.6, 4.0 and 3.1 are circular, hexagonal, square and rectangular specimens, respectively, as shown in Fig. 13. 3.3. Finite element models of specimens with ABAQUS A finite element analysis of all the CFST specimens was performed with the aim of observing the buckling, deformed shapes and stress values at the same amount of displacement according to the experimental results (strain controlled model) with ABAQUS v.12 software [20]. A quarter of the specimen were used during the modeling of parts symmetrically with respect to both the x and y axis. Three dimensional, deformable and solid
54
B. Evirgen et al. / Thin-Walled Structures 80 (2014) 46–56
Fig. 17. Basic deformed shapes of steel tubes after modeling.
Fig. 18. Comparison of the finite element model distribution and experimental results of the sample specimens. (a) Circular specimen, (b) hexagonal specimen, (c) square specimen, and (d) rectangular specimen.
B. Evirgen et al. / Thin-Walled Structures 80 (2014) 46–56
comparison between experimental and finite element model results. 15–20% or less differences were generally obtained between these results. However, some specimens reached up to almost 40%, which can be identified with possible geometrical or material imperfections. The stress distributions of all the specimens are generally concentrated on the top or bottom end of the specimens. Circular or hexagonal specimens were deformed at the top and at the bottom ends with buckling in an outer direction. However, square or rectangular specimens were deformed at the top and bottom ends, with wall buckling in an inner direction at a 451 angle from the corners, as shown in Fig. 17. Also, local buckling occurred midlength to the outer direction. The deformed shapes of the specimens at the end of the model runs were compared with the experimental failure modes as shown in Fig. 18. The specimens were cut to show the interaction between the concrete and steel due to buckling. Local buckling independently occurred from concrete interaction for the circular and hexagonal sections of 1.50–3.00 mm steel thickness with all types of square and rectangular sections shown in Fig. 19(a). However, core concrete penetrated into the buckled tubes and moved together with the steel in the remaining specimens as shown in Fig. 19(b). The similar buckling types were achieved after finite element modeling of specimens as shown in Fig. 20(a) and (b). This behavior can be due to the confinement effects of steel, the high deformation capability of composite sections or the nonsymmetrical deformation of the material. However, one of the important parameters considered is to be the moisture in concrete from this
55
observation. Steel tube prevents the total hydration of the concrete. Therefore, it is believed that the concrete in tubes has experienced considerable amount of deformations which is not expected from such a brittle material.
4. Conclusions In this paper, both experimental and finite element analyses of 64 CFST stub columns with three different domain parameters in total have been analyzed. The change of mechanical properties, such as ultimate load, ultimate stress, ductility and buckling values are presented in the paper with respect to the domain parameters. Based on the results, the following conclusions may be drawn. Core concrete prevents the buckling of steel tube in an inward direction and steel tube provides a confinement effect for axially loaded CFST stub columns at the same time. Axial strength values increased at CFST columns when these were compared with the unconfined compressive strength of core concrete. Maximum increment ratios are seen in the circular sections at 167.8%. The increment ratio is enhanced with respect to both the thickening of steel tube and a decrease of compressive strength of the concrete. This behavior also consists of a confinement effect along all lateral directions on rounded specimens. Average ductility values were calculated as 19.8, 11.6, 4.0 and 3.1 for the circular, hexagonal, square and rectangular specimens respectively. It can be clearly seen that rounded specimens have higher ductility than angular specimens.
Fig. 19. Experimental buckling types (a) local buckling behavior and (b) penetration of concrete into a buckled tube.
Fig. 20. Analytical buckling types (a) local buckling behavior and (b) Penetration of concrete into a buckled tube.
56
B. Evirgen et al. / Thin-Walled Structures 80 (2014) 46–56
All specimens are modeled with ABAQUS software and approximately 15–20% or less differences were generally obtained between the experimental and FEM results. However, some specimens approached to almost 40%. These differences can often result from possible geometric or material imperfections. Core concrete can behave as a non-brittle material due to the elimination of the desiccation of concrete moisture by steel tube in certain cases. This study shows that CFST members will be innovative and effective structural systems in the related areas of structural engineering. However, real scaled column beam capacities, frames, connection properties and required behavior should be conducted to fully understand the realistic phenomenon of CFST structural members required during construction.
Acknowledgments We would like to give our thanks to the following people and companies; Dr. Ozgur Avsar, Mr. Onur Tunaboyu and Mr. Ozgur Yurdakul (Anadolu University, Civil Engineering Department), Mr. Ibrahim Yildiz (Mipsan Steel Construction Company), Mrs. Ilkay Kara (Has Concrete Company) and Mr. Nadir Kupeli (Kupeliler Company) for their support during the experimental procedures and material supply. This project was financially supported by the Anadolu University Commission of Scientific Research Projects (Project number: 1109F143).
Appendix A. Supplementary Information Supplementary data associated with this article can be found in the online version at http://dx.doi.org/10.1016/j.tws.2014.02.022.
References [1] Hu HT, Huang CS, Wu MH, Wu YM. Nonlinear analysis of axially loaded concrete-filled tube columns with confinement effect. J Struct Eng ASCE 2003;129:1322–99. [2] Knowles RB, Park R. Strength of concrete-filled steel tubular columns. J Struct Div ASCE 1969;95:2565–87. [3] Uenaka K. Experimental study on concrete filled elliptical/oval steel tubular stub columns under compression. Thin Wall Struct 2014;78:131–7. [4] Gupta PK, Sarda SM, Kumar MS. Experimental and computational study of concrete filled steel tubular columns under axial loads. J Constr Steel Res 2007;63:182–93. [5] Hu HT, Huang CS, Chen ZL. Finite element analysis of CFT columns subjected to an axial compressive force and bending moment in combination. J Constr Steel Res 2005;61:1692–712. [6] Sakino K, Nakahara H, Morino S, Nishiyama I. Behavior of centrally loaded concrete-filled steel-tube short columns. J Struct Eng ASCE 2004;130:180–8. [7] Chitawadagi MV, Narasimhan MC, Kulkarni SM. Axial strength of circular concrete-filled steel tube columns – DOE approach. J Constr Steel Res 2010;66: 1248–60. [8] Elchalakani M, Zhao XL, Grzebieta R. Bending tests to determine slenderness limits for cold-formed circular hollow sections. J Constr Steel Res 2002;58: 1407–30. [9] Yang D, Hancock GJ, Rasmussen KJR. Compression tests of cold-reduced high strength steel sections. II: Long columns. J Struct Eng ASCE 2004;130:1782–9. [10] Narayanan S, Mahendran M. Ultimate capacity of innovative cold-formed steel columns. J Constr Steel Res 2003;59:489–508. [11] Celep Z, Kumbasar N. Betonarme yapilar. 4th ed.. Istanbul: Beta Press; 2005. [12] Al Nageim HK, MacGinley TJ. Steel structures practical design studies. 3rd ed.. New York and Canada: Taylor & Francis; 2005. [13] Bresler B, Lin TY, Scalzi JB. Design of steel structures. 2nd ed.. Canada: Wiley; 1968. [14] Schneider SP. Axially loaded concrete-filled steel tubes. J Struct Eng ASCE 1998;124:1125–38. [15] Goggins JM, Broderick BM, Elghazouli AY, Lucas AS. Experimental cyclic response of cold-formed hollow steel bracing members. Eng Struct 2005;27: 977–89. [16] Broderick BM, Goggins JM, Elghazouli AY. Cyclic performance of steel and composite bracing members. J Constr Steel Res 2005;61:493–514. [17] O’Shea M, Bridge R. Design of circular thin-walled concrete filled steel tubes. J Struct Eng ASCE 2000;126:1295–303. [18] Fujimoto T, Mukai A, Nishiyama I, Sakino K. Behavior of eccentrically loaded concrete-filled steel tubular columns. J Struct Eng ASCE, 130; 2004; 203–12. [19] FEMA356. Prestandards and commentary for the seismic rehabilitation of buildings. Virginia: Federal Emergency Management Agency, 2000. [20] ABAQUS 6.12. Analysis user's manual. Providence (RI, USA): Dassault Systèmes Simulia Corp.; 2012.