Ceramics International 45 (2019) 822–831
Contents lists available at ScienceDirect
Ceramics International journal homepage: www.elsevier.com/locate/ceramint
Structural, electrical and magnetic properties of eco-friendly complex multiferroic material: Bi(Co0.35Ti0.35Fe0.30)O3
T
⁎
Nitin Kumara, , Alok Shuklaa, Nripesh Kumara, R.N.P. Choudharyb a b
Department of Physics, National Institute of Technology Mizoram, Aizawl 796012, India Department of Physics, Siksha O Anusandhan (Deemed to be University), Bhubaneswar 751030, India
A R T I C LE I N FO
A B S T R A C T
Keywords: Mixed oxides Raman and Impedance spectroscopy Multiferroics Hysteresis loops
In this communication, studies of basic crystal structure, microstructure, dielectrics, impedance, conductivity, electric polarization and magnetization of an eco-friendly distorted perovskite Bi(Co0.35Ti0.35Fe0.30)O3 (abbreviate as BCTF70/30) have been reported. Analysis of crystal structure, phase formation and composition of the specimen, carried out through the powder X-ray diffraction (XRD) and energy dispersive X-ray spectroscopy (EDXS) techniques, confirms the formation of single-phase orthorhombic system at room temperature. The surface morphology of the compound, evaluated through the field emission scanning electron microscope, displayed the formation of high-density sample with uniform distributions of grains of varying dimensions. The phonon mode, intensity, location and width of the Raman peaks were analyzed using the Raman spectroscopy. The correlation between the frequency-temperature dielectric parameters, impedance parameters and electrical conductivity with structure-microstructure has been established. The influence of grain and grain boundary on the resistive and capacitive features has been examined through impedance spectroscopy formalism with an idealized simulated circuit. Studies of impedance spectroscopic show the semiconductor nature (i.e., negative temperature coefficient of resistance) and the non-Debye type relaxation. Polarization versus electric field analysis of BCTF70/30 sample displays enhanced value of remnant polarization as compared to that of BFO. The magnetic hysteresis loop analysis also exhibits significant improvement in the magnetization values of the compound. Accordingly, based on such enhancement of remnant polarization and magnetic parameters, we assumed that an eco-friendly material of BCTF70/30 could considered as promising material for some new electronic devices.
1. Introduction During the last few decades, attempts have been made to develop environmental or eco- friendly multiferroic materials of the perovskite family for industrial applications, such as data storage devices, transducers, sensors, spintronics, resistive switching elements and so on [1–6]. Multiferroics illustrate coupled ferromagnetic, ferroelectric and ferroelastic orderings features in a same phase [5]. The accomplishment of modifying magnetization by the use of electric field and the accomplishment of changing electric polarization through the use of magnetic field is known as a magneto-electric effect. This effectively establishes multiferroic compounds as a promising solution and emerging applicability for the use of multiple state memories [7]. These features of the materials have extensively been studied as a function of frequency and temperature [8,9]. Among all members of multiferroic family, BiFeO3 (referred as BFO) and its solid solution have drawn
⁎
worldwide attention because of their fascinating multi-ferroics characteristics useful for multifunctional devices [7]. It belongs to perovskite (rhombohedral) symmetry that displays ferroelectric (transition temperature = 1100 K) and anti-ferromagnetic ordering (Neel temperature = 640–653 K) [2]. Nevertheless, to synthesize the pure phase of BFO is complicated because of the formation of secondary phase during synthesis procedure. Additionally, the existence of undesired secondary phases, formation of oxygen vacancies as well as the fluctuation of Fe+3 → Fe+2 ions valences result weak insulation feature of BFO limit its application. Moreover, pure BFO displays very weak magneto-electric effects that is typically not much useful for multifunctional applications. It may have described by the huge difference between transition and Neel temperatures. This material possesses ferromagnetic and ferroelectric behavior mainly due to the presence of partially occupied d-orbital (Fe+3) and lone paired electrons (Bi+3) respectively [10]. Further, pure BFO exhibits higher value of leakage
Corresponding author. E-mail address:
[email protected] (N. Kumar).
https://doi.org/10.1016/j.ceramint.2018.09.249 Received 3 September 2018; Received in revised form 24 September 2018; Accepted 25 September 2018 Available online 27 September 2018 0272-8842/ © 2018 Elsevier Ltd and Techna Group S.r.l. All rights reserved.
Ceramics International 45 (2019) 822–831
N. Kumar et al.
2.2. Measurements and characterization techniques
density because of impurities, non-stoichiometric and defects existence that restricts for better potential applications. The isovalent/heterovalent doping or substitution of the metal ions with the similar/slightly different ionic sizes associated with the metal ions existing at A/B sites or AB sites of the perovskite oxides enhances its electrical features because of further growth in polarization or the structural variations [11]. To eliminate the above deficiencies or minimize the formation of secondary phase, reduction of leakage density, improvement of the ferroelectric and ferromagnetic properties, many attempts have already been made by various substitutions/addition approach and/or fabrication of material with other perovskite materials [12–19]. This kind of addition/substitutions to the material scheme plays significant role in the development of multifunctional devices. An eco-friendly concern and multiferroics features play a great role as well as furnished unique prospects in the area of device fabrication. Additionally, several different approaches have already been proposed to improve further performance of multi-functional properties of bismuth ferrite. Also, few recent studies have been published on the eco-friendly synthesis of nanocomposites by using sol-gel, microwave and combination of hydrothermal and photo-deposition techniques. Nanocomposites based on two metal oxides co-existing in the same matrix have been synthesized for various applications [20], which regarded as intelligent materials due to their excellent multifunctional utility [21–26]. From this significant opinion, we planned to develop materials based on eco-friendly multiferroics with the association of bismuth titanate (perovskite-type) and cobalt titanate (ilmenite-type). Based on the literatures, it is seen that not much attention has been paid on the similar material theme. Therefore, for the said exploration, we have synthesized Bi (Co0.35Ti0.35Fe0.30)O3 which is a solid solution of Bi(Co0.5Ti0.5)O3 and BiFeO3. Accordingly, the multi-doped substitution at B-site (iron) offers an essential correlation in its physical characteristics along with the major reduction of leakage density. Thus, it is important to discuss the dielectric, electrical and multiferroics characteristics of said system for the device applications. Therefore, co-doped (Co, Ti) eco-friendly bismuth ferrite Bi(Co0.35Ti0.35Fe0.30)O3 (abbreviate as BCTF70/30) has been synthesized via a standard mixed oxide method. In this paper, we report the synthesis and characterization (structural, microstructural, dielectric, vibrational, electrical, multiferroics) of BCTF70/30 material for their possible applications.
Before pressing of the calcined powder, it is essentially required to analyze the phase formation and structural features of the material through the X-ray powder diffractrometer (XRD) technique. The diffraction data on the sintered sample were collected by a powder X-ray diffractometer (Rigaku Miniflex 600 Japan) using CuKα radiation in a wide range of the Bragg angle θ (20° ≤ 2θ ≤ 75°). The structural analysis program “POUDMULT” was utilized to examine the basic crystal structure and lattice parameters. Raman spectra of the compound were recorded by using micro-Raman set up (LABRAM HR, Japan). The microstructure/surface morphology of sintered pellet was scanned through entire surface using a field emission scanning electron microscope (FESEM; ZEISS, EVO18, Germany) at room temperature. For the elemental analysis of the BCTF70/30 pellet, the energy-dispersive X-ray spectroscopy (EDXS; Oxford instrument, U.K.) attached with FE-SEM setup was used. For evaluating resistive and capacitive parameters, the pellets were polished by a fine emery paper to make the surfaces flat and parallel, and then both the surfaces were coated with high purity silver paint for dielectric, electrical and ferroelectric measurements. Silver-coated pellet was then annealed at 470 K for two hours to remove the moisture from the pellets, if any. The dielectric and electrical features of BCTF70/30 ceramic sample were measured using high precision phase sensitive multimeter (PSM: 1735, NumetriQ, U. K.) with the variation of temperatures (300–773 K) and frequencies (1–1000 kHz). Both measurements were performed at the same heating rate (1 °C) and constant interval rate of 5 and 25 K respectively. By utilizing the vibrating sample magnetometer (Lake Shore: VSM) and ferroelectric hysteresis loop (Radiant Precision: P-E loop tracer), the multiferroic characteristics (magnetization and polarization) of said sample was recorded at 300 K. The detailed description of sample synthesis process (conventional mixed oxide route) and further characterization has been given in Fig. 1. 3. Results and discussion 3.1. Structural analysis Fig. 2(a–b) displays powder X-ray diffraction (PXRD) profile and Raman spectra of Bi(Co0.35Ti0.35Fe0.30)O3 compound at room temperature (300 K). The unit cell dimension of the material was determined through “POWDMULT’’ indexing and refinement (leastsquares) processes of few reflection peak positions of the XRD pattern [27]. As depicted, the relative intensity of the peaks is sharp and well defined which strongly suggest the crystalline nature of the compound. A better agreement between the observed interplanar distance d (dobserved) and calculated distance d (dcalculated), and the diffraction angle for each refection plane suggests an orthorhombic phase symmetry. The refined cell parameters of the selected system are; a = 4.6068 Å, b = 20.2951 Å, c = 14.5188 Å and volume V = 1357.98 Å3 (with minimum deviation in the lattice dimension of 0.002 Å). The crystallite size (CS) of the sample was estimated mainly using the peak width at half height (β) of a few widely scattered planes (on the scale of Bragg angle), the wavelength (λ) used in Scherrer equation [28].
2. Experimental 2.1. Preparation of sample A complex polycrystalline bismuth ferrite based material of a chemical composition Bi(Co0.35Ti0.35Fe0.30)O3 (referred as BCTF70/30) was synthesized by a standard mixed oxide route. In this method, the starting materials of commercially available oxide powders (analytical grade) of bismuth tri-oxide (Bi2O3), cobalt mono-oxide (CoO), titanium dioxide (TiO2) and iron tri-oxide (Fe2O3) were weighed as per desired stoichiometry using high-precession digital balance. These oxides were to mixed thoroughly by using a mortar and pestle. The resultant mixture was ground in air (dry) as well as methanol (wet) medium for eight hours to make a fine powder. The mixture was then calcined with a constant heating rate (2.5°/min) at 1013 K for eight hours and furnace was cooled in a nature way. Polyvinyl alcohol (2.5 wt%) solution (used as a binder) was mixed with BCTF70/30 calcined powder. Then the powders were pressed into pellets (dimension: diameter = 10 mm, width = 1–1.5 mm) of circular shape. The pellets were sintered at an optimized temperature (1063 K) for eight hours to produce compact high density pellets for further electrical measurements. The calcination and sintering process were performed through a high-temperature furnace in a high-purity of alumina crucible and boats.
CS = k λ /β Cos(θ)
(1)
Where, k is a constant (= 0.89), β is the full width at half maxima of peak intensity, λ is the wavelength of X-ray (= 1.5406 Å) and θ is a Bragg's angle of the diffraction. The average crystallite size of the sample is found to be 29 nm. The observed (obs) and calculated (cal) dspacing of each reflection, with its relative intensities and miller planes are presented in Table 1. Figs. 2(a) (inset) and 2(b) shows the Raman spectra at room temperature and the Gaussian fitted spectra of BCTF70/30 from 100 to 1400 cm−1 respectively. Raman spectroscopy is a technique for 823
Ceramics International 45 (2019) 822–831
N. Kumar et al.
Fig. 1. The representation of synthesis and further characterization process of Bi(Co0.35Ti0.35Fe0.30)O3 eco-friendly material. Table 1 Comparison of observed and calculated d-values in (Å) versus observed relative intensity (I/I0) of XRD peaks. Peak
d-spacing (obs.)
d-spacing (cal.)
I/Io
h
k
l
Two Theta (obs. ± cal.) diff.
1 2 3 4 5 6 7 8 9 10 11 12 13 14 15 16 17 18 19 20 21
4.1912 3.8176 3.5756 3.1996 2.9491 2.7009 2.5197 2.3852 2.2651 2.1542 2.0979 2.0633 2.0153 1.9860 1.9209 1.8468 1.7335 1.6851 1.6396 1.6096 1.4912
4.1961 3.8212 3.5730 3.1984 2.9521 2.7057 2.5202 2.3878 2.2653 2.1535 2.0981 2.0634 2.0156 1.9851 1.9199 1.8470 1.7341 1.6864 1.6384 1.6087 1.4906
21 14 24 100 58 72 19 11 18 14 13 11 12 14 13 11 33 20 19 18 21
1 1 0 0 0 0 0 1 0 0 2 0 2 2 0 0 1 2 1 2 2
2 1 1 3 4 7 4 2 7 9 4 1 4 5 4 5 10 6 3 8 10
0 2 4 4 4 2 5 5 4 2 0 7 2 1 7 7 3 4 8 3 2
0.025 0.022 − 0.019 − 0.018 0.031 0.061 0.008 0.042 0.004 − 0.015 0.003 0.002 0.006 − 0.023 − 0.026 0.004 0.017 0.045 − 0.046 − 0.034 − 0.029
Compound: - Bi(Co0.35Ti0.35Fe0.30)O3. Symmetry: - Orthorhombic.
characterizing and providing the detail description of molecular vibration characteristics of the material. It is also a valuable tool to analyze the subtle variations and possible formation process (during the synthesis) that cannot be identified through conventional X-ray diffractometer [29]. The theoretical exploration predicts eighteen sets of optical phonon modes (4A1 + 5A2 + 9E) for the components of the BFO based solid solution. Here, A1 and E modes are assigned to the Raman and IR-active modes whereas A2 modes mainly belong to Raman as well as IR inactive mode. To establish the relationship
Fig. 2. Room temperature (a) XRD pattern and inset shows Raman spectra (b) analysis of (Gaussian fitting) Raman spectra for Bi(Co0.35Ti0.35Fe0.30)O3 ecofriendly material.
824
Ceramics International 45 (2019) 822–831
N. Kumar et al.
rectangular in morphology and of different size (135–360 nm). The professional ImageJ software has been used to estimate the grain size of the said sample [32]. Although, in bulk BFO, few grains have fused to produce larger grain size (> 50 µm) [33]. As a result, the bulk BFO has a relatively larger grain size, whereas, the BCTF70/30 sample shows smaller grains with highly packed microstructure.
between exact peak frequencies of Raman spectra, we applied Gaussianfitting method of the Raman data. The existence of Raman-active modes produces oxygen ion movement as well as A/B-site ions in the structure. Thus, the observed Raman peak at 137, 159, 201, 273, 329, 489, 532, 724 and 852 cm−1 fitted by Gaussian fitting, give the information about the position. It shows three sharp peaks at around 130, 151 and 201 cm−1, which could be assigned as A1-1, A1-2 and A1-3 phonon modes respectively [30]. The Raman modes of BCTF70/30 attribute through 200 cm−1 because of the bending and stretching modes of an octahedral (FeO6) family of perovskite system [31]. Additionally, the observed distortion in the structure of perovskites compound is mostly occurred due to the size of the A and B site-ions in the specimen. The Goldsmith tolerance factor (symbolized as GTH) often offended an estimating values of the lattice distortion of the perovskites using their ionic radii. The semi-empirical relationship is presented as, GTF = (〈RBismuth〉 + 〈ROxygen〉)/ 2 * (〈RCobalt+Titanium+Iron〉 + 〈ROxygen〉). Herein, the 〈RBismuth〉, 〈RCobalt+Titanium+Iron〉 and ROxygen illustrate the ionic radii of A-site, B-sites (average ionic radii) and oxygen-site respectively. The calculated value of tolerance factor (GTF) is found nearly to be 0.84 for BCTF70/30 that strongly suggests a major distortion in an ideal perovskite.
3.3. Dielectric characteristics Study of dielectric parameters is the most important characterization technique of the materials. This study provides the nature of dielectric permittivity and tangent loss along with the test of the electric field at several sets of temperature and frequency. The dielectric parameters (permittivity and tangent loss) were recorded using the high precession LCR meter connected to a computer the furnace. The dielectric constant was calculated by using the general capacitance formalism at several sets of frequencies and temperatures [34–36].
ε=
1 d Cp ε0 S
Herein, ε = represent measured dielectric constant, d = thickness of the pellet, ε0 = permittivity in free space, S = surface area of the pellet and Cp = capacitance in parallel association.
3.2. Morphological and elemental studies 3.3.1. Temperature dependent dielectric study Fig. 4(a–b) illustrates the temperature dependence of dielectric constant and tangent loss of Bi(Co0.35Ti0.35Fe0.30)O3 material at selected frequencies (1–1000 kHz). The dielectric features of the compound could be influenced by the microstructure as well as synthesis procedure. The features arise due to electric dipole moments, which established the charge transfer phenomenon between divalent and trivalent cations into a structure. It is noticed (dielectrics plots of Fig. 4(a–b)) that the presence of dielectric constant experiences an abrupt increase in working temperature only in the low-frequency region (< 20 kHz), however, in the high-frequency region (25 kHz ≤ dielectric constant ≤ 1000 kHz), an increasing tendency is slow for all working temperatures. The lower values of dielectric constant in this temperature region are observed due to the grain effects. On higher temperature, the grain boundaries and the electrode effects start to dominate their dielectric values. Dielectric constant values increase with increase of temperature might be due to the existence of space charge polarization or arise in conductivity of BCTF70/30. The Schottky barriers create an interface among the grains, grain boundaries, electrodes and the presence of surface effects in this specimen material. The optimum sintered pellet of BCTF70/30 compound, outer surface of the pellet may have some oxygen stoichiometry, and accordingly the resistance goes higher than the inner portion of the pellet. These barriers (Schottky) possess higher capacitance as compare to grains; therefore, higher dielectric constant values detected to paid the construction of barriers. The high dielectric constant at high temperature with lower frequency range are generally originated due to the Maxwell–Wagner polarization process [37,38]. These such higher values of dielectric constant could be attributed to the existence of ferroelectric nature of the compound [39]. In addition, Fig. 4(b) shows the temperature versus the dielectric loss graph at different frequency for BCTF70/30. The spectrum trend is similar as achieved in the dielectric constant plots. By means of which, initially the dielectric constant remains almost constant for both operated temperature and frequency and then registers a simultaneous increase in both operating parameters. This kind of dielectric loss spectrum is originated due to the conduction of smooth curves as well as the relaxation losses referred through a peak at a certain temperature. The dielectric loss introduces numerous kinds of loss phenomenon. Accordingly, the dielectric loss reaches to its maximum peak position at a certain temperature, and then decreases in further higher temperature. Essentially, within the limit of the experimental set-up, the decreasing
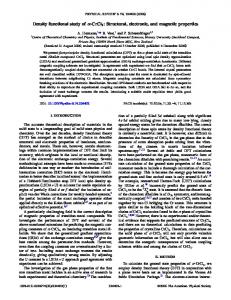
Fig. 3 illustrate (a) energy dispersive X-ray spectroscopy (EDXS) and (b) corresponding field-emission scanning electron microscope (FESEM) spectra of Bi(Co0.35Ti0.35Fe0.30)O3 compound at 300 K. The EDXS analysis provides the existence of all elements (bismuth, cobalt, titanium, iron and oxygen) with their corresponding atomic ratio closes to their stoichiometric concentration. Additionally, the surface morphology of BCTF70/30 grains shows different shape and size, which distributed homogeneously with a few agglomerations nature. The distribution of small and large grains of the said constituents is visibly distinguishable by grain boundaries. It is seen, that the dimension (shape and size) of the most of the particles is spherical, triangular and
Fig. 3. (a) EDXS analysis and (b) corresponding FE-SEM micrograph of Bi (Co0.35Ti0.35Fe0.30)O3 compound at room temperature. 825
Ceramics International 45 (2019) 822–831
N. Kumar et al.
Fig. 4. Temperature dependent (a) dielectric constant and (b) dielectric loss at few selected frequency for Bi(Co0.35Ti0.35Fe0.30)O3 eco-friendly compound. Frequency dependent (c) dielectric constant and (d) dielectric loss at selected temperatures for Bi(Co0.35Ti0.35Fe0.30)O3 eco-friendly compound.
polarization is lagging behind through an applied electric field. It is visibly seen that the dielectric loss trend suppresses with the increase in frequency throughout all operating temperatures (300–773 K). The dielectric loss value (at room temperature) is very small in the vicinity of several frequencies. The large variation in the magnitude of dielectric loss at higher temperature is mainly due to the existence of temperature dependent charge carriers scattering as well as defects/impurity phase during the synthesizing sample [43]. Moreover, the studied compound displays analogous behavior in the permittivity with change in temperature and frequency. The influence of temperature and frequency of the dielectric parameters is summarized in Table 2.
trend is not measured at further temperature. Thus, the dielectric loss has a small value at lower temperature, and on further the increase trend are is observed with the continuous increase of temperature for BCTF70/30 compound. 3.3.2. Frequency dependent dielectric study The dielectric performance measured as a function of frequency at different temperature could offer precious evidence about the behavior of localized electric carriers and polarization mechanism [40]. Fig. 4 shows the frequency dependence of (Fig. 4(c)) dielectric constant and (Fig. 4(d)) dielectric loss plots at several temperatures from 300 to 773 K for BCTF70/30. There are several factors, which are mainly responsible for the variation of dielectric parameters (dielectric constant and loss), including sintering conditions, homogenous nature, morphology of the grain growth, and so on [41]. It is observed from the dielectric spectrum; the magnitude of dielectric constant is found to be in decreasing order with the rise in the frequency at all the temperatures. In the low-frequency zone, these values have higher magnitude as well as, in the high- frequency zone, these values slowly decrease and then saturates. The electronic polarization contribution is more towards higher frequency zone, whereas in the low-frequency zone, the polarizations (space charge and dipolar) and other factors play its role [5]. The grain boundary effects are much dominant throughout the grains, and hence the dielectric dispersion takes place in the low-frequency zone. Therefore, the magnitude of dielectric constant in the high-frequency zone is less than that of the low- frequency zone [42]. Such types of observed anomalies in the dielectric parameters could also be described by Koop's hypothesis [43]. Additionally, the tangent loss (Fig. 4(d)) is related to dielectric relaxation process that denotes the energy loss phenomenon of the material. Generally, similar trend of loss tangent is observed when the
3.4. Electrical characteristics The electrical studies are the most important characterization techniques of the compound. These studies provide an evidence about the electrical nature along with the test of the electric field at several sets of temperature and frequency. The features of the compound could have influenced by the microstructure as well as synthesis procedure. 3.4.1. Complex impedance study Fig. 5 displays the variation of complex impedance through Nyquist diagram at several temperatures for the BCTF70/30 compound. The data of the Nyquist plots (experimental impedance data) have been modeled with an equivalent circuit to provide an accurate picture of the electrical characteristics. The equivalent model circuit [(CR)(CQR)] of the studied material (by means of said ZSIMP WIN software) has been utilized to record their fitting parameters. The best fitting of spectrum lines (shown in red solid lines) have been acquired by using corresponding circuits composed of a parallel association of capacitance (grain boundary capacitance = Cgb) to resistance (grain-boundary 826
Ceramics International 45 (2019) 822–831
N. Kumar et al.
Table 2 Comparison of dielectric parameters (frequency-temperature dependence) at an intermediate temperature between 300 K and 773 K for Bi(Co0.35Ti0.35Fe0.30)O3 compound at a precise frequency of 1 kHz and 1000 kHz. Compound detail
Temperature range
Bi(Co0.35Ti0.35Fe0.30)O3
300 K 323 K 373 K 423 K 473 K 573 K 673 K 773 K
Dielectric parameters at 1 kHz
Dielectric parameters at 1000 kHz
Dielectric constant
Dielectric loss
Dielectric constant
Dielectric loss
305 305 325 355 405 614 844 646
0.08 0.06 0.07 0.13 0.26 0.82 1.76 1.27
267 267 270 280 296 319 332 321
0.01 0.02 0.02 0.04 0.05 0.05 0.07 0.07
3.4.2. Electrical modulus study The electrical response of as-synthesized materials could also be investigated through electric modulus (complex) formalism that provides an alternate method based on their polarization behavior [44]. Moreover, the electric modulus approach is a suitable scheme to examine electrical transport mechanisms (by means of carrier hopping level, conductivity relaxation occurrences) under the influence of operating temperature and frequency [45]. The most advantage of said scheme is to classify or detect the electrode polarization as well as grain a boundary conduction mechanism. The complex electric modulus (CIM) of real and imaginary parts [M* = M′ + jM′′] is represented and calculated using previously reported mathematical equation [15,46]. Herein, M′ = ω C0 Z′′ and M′′ = ω C0 Z′ represents the real and imaginary quantities of the complex electrical modulus. The term ω = 2πƒ = angular frequency; C0 = ε0A/t is the capacitance with ε0 = 8.854 × 10⁻¹² F/m is the permittivity for free space, A is the surface area and t is the thickness of the sample [47]. Fig. 6(a–b) demonstrate the deviation of real and imaginary quantities of an electric modulus for Bi(Co0.35Ti0.35Fe0.30)O3 at different temperatures (300–773 K) and frequency (1–1000 kHz). Fig. 6(a) correlates the most significant behavior of M' with frequency at selected temperatures for BCTF70/30. It is observed that in the low-frequency region, M' nearly approaches to be zero, and then dispersion increases with increasing frequency. The low trend of M' value (nearly zero at higher temperatures) in the said range confirms the presence of electrode and/or ionic polarization [48]. In the high-frequency region, the value of M′ is almost constant and saturated reaching a maximum value at high frequencies, it is due to the relaxation process. Hence, the existence of restoring forces (lack) regulates the mobility of the charge carriers in electric field [49]. Additionally, Fig. 6(b) displays the deviation in imaginary components of electric modulus with frequencies at several temperatures. It is observed that the value of M′′ displays an increasing trend with a peak at each applied temperature as well as further frequency. The center of the M′′max peak is shifted toward higher frequency with further increase of temperature (for process, the relaxation rate increases with rising temperature). The peak position (at lower-frequency), proposes the
Fig. 5. Temperature dependence Nyquist diagram (Complex impedance) of Bi (Co0.35Ti0.35Fe0.30)O3 eco-friendly material measured at several temperatures. Inset shows the intermediate temperature response.
resistance = Rgb) as well as the parallel association of capacitance (bulk capacitance = Cb), constant phase element impedance (ZCPE) term, along with bulk resistance (bulk resistance Rb), (i.e., (CR)(CQR)) model circuit. It is evident, from the spectrum plots of a said compound, the radius (semi-circular arcs) decrease with the increase of temperature above the intermediate temperature (673–773 K). The radius of the semi-circular arc also decreases irregularly, but the origin of spectrum plots is shifted towards the real impedance axis. Furthermore, the Nyquist plot characteristic as semicircle occurs only at high-frequencies, and not inclined spur at the lower frequency region. The trend of forming a single semicircular arc indicates the existence of the single conductivity process, and the semi-circle arcs do not center on the real axis, which is an indicative signature of the non-Debye type of relaxation processes. The detailed description of said circuit, resistive and capacitive component response at different temperature has been summarized in Table 3.
Table 3 Electrical parameters obtained from an equivalent circuit for BCTF70/30 compound at several temperatures. Tempt. (K)
Cb (F/cm2)
Rb (Ω cm2)
Cgb (F/cm2)
CPE
Rgb(Ω cm2)
n
523 573 623 673 698 723 748 773
3.489E − 10 6.203E − 10 2.054E − 09 2.004E − 09 2.016E − 09 2.402E − 09 1.704E − 09 2.126E − 10
1.841E6 6.572E5 1.038E4 6774 4685 3271 2951 1.22E5
1.792E − 10 1.480E − 10 1.306E − 10 1.324E − 10 1.325E − 10 1.319E − 10 1.300E − 10 1.297E − 10
3.904E − 09 4.043E − 09 6.442E − 09 9.758E − 09 1.055E − 08 1.172E − 08 6.801E − 08 1.206E − 08
5.028E5 4.069E5 6.366E5 3.535E5 2.402E5 1.872E5 1.062E5 7.507E4
0.6776 0.6656 0.6171 0.5995 0.6042 0.6024 0.6659 0.6121
Model Circuit: [(CR)(CQR)]. 827
Ceramics International 45 (2019) 822–831
N. Kumar et al.
Fig. 6. Frequency dependence of (a) M′ and (b) M′′ at selected higher temperature (inset shows intermediate temperature response) for Bi (Co0.35Ti0.35Fe0.30)O3 eco-friendly material.
Fig. 7. The relation between (a) σac with frequencies at different temperatures and (b) σac with temperature (inverse) at several frequency for Bi (Co0.35Ti0.35Fe0.30)O3.
transition turnover from short range to long range mobility, where ions are freely capable of traveling long distances whereas, the ions are confined only the localized motion (in the high-frequency region) [50,51]. Furthermore, the asymmetric broadening of peaks manifests the distribution of relaxation through different time constants that visibly proposes the presence of non-Debye relaxation trend [52].
independent term that provides the value of dc-conductivity, C is a temperature dependent thermally activated constant and the symbol β is the frequency dependent exponent that can have value lies between zero and one. On the other hand, the source of frequency dependence conductivity lies in the relaxation process, which rising because of mobile charge carriers. Therefore, this increment in the conductivity values with growth of frequency and temperature recommends the presence of negative temperature coefficient of resistance trend in the BCTF70/30 materials. Additionally, Fig. 7(b) displays the deviation of ac-conductivity with temperature (inverse) at a few sets of selected frequencies for BCTF70/30. In the low- temperature region, the order of ac-conductivity magnitude is nearly constant at all selected frequencies. To understand the nature of ac-conductivity spectrums with frequency and inverse temperature variation, we have divided into several independent regions of temperature and frequencies. In excess of different temperature regions, linear deviation with varying slopes are observed. At high temperature, the σac value displays faster increase with rise of temperature, and the curve trends is utterly linear that obeys Arrhenius trend. The activation energies (Ea) at different temperatures (lower temperature-ILT, intermediate temperature-IIIT and higher temperature-IIIHT) regions with varying frequency has been estimated and deliberately from the plot through Arrhenius relation as; σac = σo exp (− Ea/TKB), where the symbols σo and KB represents the pre-exponential element and the Boltzmann constant respectively. Therefore, the calculated value (from the slope) of activation energy (Ea) for BCTF70/30 compound at high temperature (Region-IIIHT) at frequency 1 kHz and 1000 kHz is 0.45 eV and 0.21 eV, respectively. The magnitude of Ea decreases with increasing frequency. Additionally, the value of Ea at lower temperature (Region-ILT) at frequency 1 and
3.4.3. Electrical conductivity study To understand the effects of several mechanisms and carriers responsible for the electrical conduction in the material, the electrical acconductivity measurement is a significant scheme for revealing reliable evidence. The electrical features have an importance role in the arena of inorganic/organic electronics and opto-electronic devices. It is well established fact that the total conductivity (σTotal) at a definite temperature and frequency is then split namely in two frequency-independent (σdc) and frequency-dependent (σac) terms [53]. Additionally, the ac-conductivity has been deliberated through the dielectric data of an empirical formalism; σac(ω) = ω ε0 εr (tan δ) (herein symbols shows their usual sense) [54,55]. Fig. 7(a) specifies the deviation in ac-conductivity in the large frequency range (1–1000 kHz) at some set of temperatures (300–773 K) for Bi(Co0.35Ti0.35Fe0.30)O3. In the low-frequency region, the material exhibits dispersion and the conductivity plots do not fully dependent on the frequency at high temperatures. The nature of the spectrum also describes the rise in conductivity value slowly with an increase in frequency. At high frequencies, an ac-conductivity (σac) increases with the increase in frequency and approaches to merge at high temperature. The electrical conductivity schemes could be analyzed and fitted through the relation of σac (ω) = σα+Cωβ , well-known Jonscher's power law [56], where the symbol σα represents the frequency 828
Ceramics International 45 (2019) 822–831
N. Kumar et al.
Fig. 8. The relation between current density (J) with electric field (E) at several temperatures for Bi(Co0.35Ti0.35Fe0.30)O3.
Fig. 9. Room temperature magnetic hysteresis diagram for Bi (Co0.35Ti0.35Fe0.30)O3. Inset shows enlarged view of magnetic moment versus magnetic field response.
1000 kHz are 0.05 eV and 0.06 eV, respectively. Hence, an activation energy is the addition of energies that involves for the generation of charge carriers, but for the polycrystalline samples, the defects may deliver an extra acceptor centers at higher temperatures. This result specifies that on rising frequency the magnitude of activation energy drops with decreasing their character as an acceptor. The frequency dependent (strongly) dispersion section could be recognized to the hopping of charge carriers to random positions with flexible barrier heights.
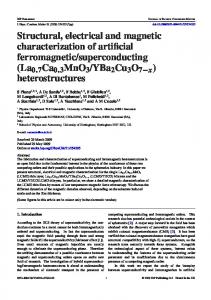
zero value [62,63]. The enhanced magnetic parameter values and ferromagnetic ordering could be explained on the basis of the induced magnetic moment, which extremely affects the structural evolution as well as the ions radii between them. Moreover, for the production of oxygen vacancies, the exchanges of valence state from the Fe3+ to Fe2+ is mostly responsible [64,65]. The existence of Fe2+ ions may have the twin exchange interaction between Fe2+ and Fe3+ ions along with an oxygen atom and as an effect it enhances the ferro-magnetism [66]. Thus, the significant addition of cobalt/titanium ratios into the bismuth ferrite increases much enhanced ferromagnetic parameters.
3.4.4. Leakage current study The leakage current (LC) density measurement of an electronic material has earlier been discussed by Fernando et al. [57]. Fig. 8 displays the leakage current behavior of the Bi(Co0.35Ti0.35Fe0.30)O3 material at a few sets of temperatures (300–773 K). The performance of current density-electric field (J-E spectrum) specifies a small leakage current at low electric field and rapidly increases (leakage current) by increasing electric field. Numerous mechanisms through literature have already been talked about their possible limitation and elimination processes of leakage current in bismuth ferrite related materials [58]. The leakage current mechanism is subjected to bismuth ferrite material through the Poole-Frenkel defects, which are also similar to those of the ferroelectric perovskites [58,59]. This mechanism confirms hopping of charges between the Fe+2 and Fe+3. It is a well-known fact that the pure phases bismuth ferrite shows oxygen vacancies rather than the Fe+2 ions are generally responsible for higher conductivity and perhaps proceed/move as trapping centers [60,61]. The trapped energy creates oxygen vacancies inside the band gap to produce activate mobile electrons, which mainly contribute to the higher conductivity of the specimen [61]. Thus, in BCTF70/30 the remarkable decreasing and reasonably low value of leakage current approves promise materials for the development of multiferroic devices.
3.5.2. Ferroelectric property The existence of a proper ferroelectric hysteresis loop shows the ferroelectricity of the materials. Fig. 10 shows the ferroelectric hysteresis loop of Bi(Co0.35Ti0.35Fe0.30)O3 at room temperature. The impact of said analysis could show the polarization (P) versus electric field (E) loop diagram for few capacitors and resistor based electronic devices. The grain size of the specimen sample plays a vital role in switching effect of the ferroelectric polarization [67]. For polycrystalline ferroelectric materials, the grains are mainly subjected to several possessing parameters, such as temperature, time, pressure and atmosphere, which strongly affects the spontaneous polarization as well as other features. The contribution of grain boundaries almost negligible/infinitesimal for the spontaneous/ferroelectric features. It is happening due to the grain boundaries contain much defects and impurities that suppress the
3.5. Multiferroic studies 3.5.1. Magnetic property Fig. 9 shows the magnetic field dependence of the magnetization of Bi(Co0.35Ti0.35Fe0.30)O3 was examined through vibrating sample magnetometer at room temperature. The magnetic properties of the said multi-doped (cobalt and titanium into bismuth ferrite) compound is depending on their numerous experimental conditions (synthesis procedure, distribution of cations, sintering temperature and particle size). It is observed (from Fig. 9) that the sintered sample shows the high value of coercivity (Hc) at 344 Oe. The maximum saturation magnetization (Ms) with 19.76 emu/g and remnant magnetization (Mr) with 6.52 emu/g. Some reported results on bulk BFO depict a typical antiferro-magnetism behavior without any remnant magnetization with
Fig. 10. The P-E loops diagram of the Bi(Co0.35Ti0.35Fe0.30)O3 material at room temperature. 829
Ceramics International 45 (2019) 822–831
N. Kumar et al.
References
spontaneous polarization/ferroelectric features of the specimen sample. Due to said reasons, the most grains are found to be inhomogeneous spread throughout the scheme. To examine the ferroelectric properties of the studied sample, the P–E loops analysis were performed at a particular frequency (1 kHz) with an existence of different applied electric field (10–30 kV/cm). For BFO, the ferroelectric behavior has been observed due to the existence of lone-pairs (6s2) electron in the Bi3+ cations. Based on the ferroelectric studies of BCTF70/30 compound, observed remnant polarization, coercive field and saturated polarization values are much higher than that of bulk BFO [68]. It is noticed to achieve proper saturated loops, not possible to apply much higher electric field beyond the breakdown voltage because of having the leaky characteristic. The remnant polarization value of the said compound increases with rise of applied electric field. The ferroelectric parameters (coercive field, remnant polarization) values are affected due to the presence of any charge defects, mechanical stresses, thermal treatment and so on [69,70]. Thus, the BCTF70/30 eco-friendly multiferroics may have a significant advantage for the generation of novel devices over the best multiferroic system.
[1] S.-W. Cheong, M. Mostovoy, Multiferroics: a magnetic twist for ferroelectricity, Nat. Mater. 6 (2007) 13–20. [2] W. Eerenstein, N. Mathur, J.F. Scott, Multiferroic and magnetoelectric materials, Nature 442 (2006) 759–765. [3] W. Prellier, M. Singh, P. Murugavel, The single-phase multiferroic oxides: from bulk to thin film, J. Phys. Condens. Matter 17 (2005) R803. [4] A. Singh, V. Pandey, R.K. Kotnala, D. Pandey, Direct evidence for multiferroic magnetoelectric coupling in 0.9BiFeO3–0.1BaTiO3, Phys. Rev. Lett. 101 (2008) 247602. [5] N. Kumar, A. Shukla, R.N.P. Choudhary, Development of lead free multifunctional materials Bi(Co0.45Ti0.45Fe0.10)O3, Prog. Nat. Sci.: Mater. Int. 28 (2018) 308–314. [6] N. Kumar, A. Shukla, C. Behera, R.N.P. Choudhary, Structural, electrical and magnetic properties of Bi(Ni0.45Ti0.45Fe0.1)O3, J. Alloy. Compd. 688 (2016) 858–869. [7] A. Quindeau, I. Fina, X. Marti, G. Apachitei, P. Ferrer, C. Nicklin, E. Pippel, D. Hesse, M. Alexe, Four-state ferroelectric spin-valve, Sci. Rep. 5 (2015) 09749. [8] A.O. Turkey, M.M. Rashad, Z.I. Zaki, I.A. Ibrahim, M. Bechelany, Tuning optical and dielectric properties of calcium copper titanate CaxCu3-xTi4O12 nanopowders, RSC Adv. 5 (2015) 18767–18772. [9] F. Carpi, G. Gallone, F. Galantini, D.D. Rossi, Silicone–poly(hexylthiophene) blends as elastomers with enhanced electromechanical transduction properties, Adv. Funct. Mater. 18 (2008) 235. [10] S. Pattanayak, R.N.P. Choudhary, P.R. Das, S.R. Shannigrahi, Dy-substitution on structural, electrical and magnetic properties of multiferroic BiFeO3 ceramics, Ceram. Int. 40 (2014) 7983–7991. [11] B. Ul-ain, S. Ahmed, M.A.U. Rehman, Y. Huang, C.A. Randall, Electrical and thermoelectric attributes of Ba2Co2Fe12−2x(Ti–Mn)xO22 and their catalytic activity for complete N2O decomposition, New J. Chem. 37 (2013) 2768–2777. [12] J. Wei, R. Haumont, R. Jarrier, P. Berhtet, B. Dkhi, Nonmagnetic Fe-site doping of BiFeO3 multiferroic ceramics, Appl. Phys. Lett. 96 (2010) 102509. [13] Y. Wang, C.-W. Nana, Enhanced ferroelectricity in Ti-doped multiferroic BiFeO3 thin films, Appl. Phys. Lett. 89 (2006) 052903. [14] Z. Wen, G. Hu, S. Fan, C. Yang, W. Wu, Y. Zhou, X. Chen, S. Cui, Effects of annealing process and Mn substitution on structure and ferroelectric properties of BiFeO3 films, Thin Solid Films 517 (2009) 4497–4501. [15] N. Kumar, A. Shukla, R.N.P. Choudhary, Structural, electrical and magnetic properties of (Cd, Ti) modified BiFeO3, Phys. Lett. A 381 (2017) 2721–2730. [16] A. Shukla, N. Kumar, C. Behera, R.N.P. Choudhary, Structural and electrical characteristics of (Co, Ti) modified BiFeO3, J. Mater. Sci.: Mater. Electron. 27 (2016) 7115–7123. [17] N. Kumar, A. Shukla, R.N.P. Choudhary, Structural, electrical and magnetic characteristics of Ni/Ti modified BiFeO3 lead free multiferroic material, J. Mater. Sci.: Mater. Electron. 28 (2017) 6673–6684. [18] A. Shukla, N. Kumar, C. Behera, R.N.P. Choudhary, Structural, dielectric and magnetic characteristics of Bi(Ni0.25Ti0.25Fe0.50)O3 ceramics, J. Mater. Sci.: Mater. Electron. 27 (2016) 1209–1216. [19] N. Kumar, A. Shukla, N. Kumar, S. Sahoo, S. Hajra, R.N.P. Choudhary, Structural, electrical and ferroelectric characteristics of Bi(Fe0.9La0.1)O3, Ceram. Int. (2018), https://doi.org/10.1016/j.ceramint.2018.08.185. [20] S.A. Mousavi, M. Hassanpour, M.S. Niasari, H.S. Hojaghan, M. Hamadanian, Dy2O3/CuO nanocomposites: microwave assisted synthesis and investigated photocatalytic properties, J. Mater. Sci.: Mater. Electron. 29 (2018) 1238–1245. [21] H. Najafian, F. Manteghi, F. Beshkar, M.S. Niasari, Enhanced photocatalytic activity of a novel NiO/Bi2O3/Bi3ClO4 nanocomposite for the degradation of azo dye pollutants under visible light irradiation, Sep. Purif. Technol. 209 (2019) 6–17. [22] M. Hassanpour, H.S. Hojaghan, M.S. Niasari, Rapid and eco-friendly synthesis of NiO/ZnO nanocomposite and its application in decolorization of dye, J. Mater. Sci.: Mater. Electron. 28 (2017) 10830–10837. [23] M. Hassanpour, H.S. Hojaghan, M.S. Niasari, A.Y. Faal, Nano-sized CuO/ZnO hollow spheres: synthesis, characterization and photocatalytic performance, J. Mater. Sci.: Mater. Electron. 28 (2017) 14678–14684. [24] H. Khojasteh, M.S. Niasari, F.S. Sangsefidi, Photocatalytic evaluation of RGO/ TiO2NWs/Pd-Ag nanocomposite as an improved catalyst for efficient dye degradation, J. Alloy. Compd. 746 (2018) 611–618. [25] M. Hassanpour, H.S. Hojaghan, M.S. Niasari, Degradation of methylene blue and Rhodamine B as water pollutants via green synthesized Co3O4/ZnO nanocomposite, J. Mol. Liq. 229 (2017) 293–299. [26] M. Hassanpour, M.S. Niasari, S.A. Mousavi, H.S. Hojaghan, M. Hamadanian, CeO2/ ZnO ceramic nanocomposites, synthesized via microwave method and used for decolorization of dye, J. Nanostruct. 8 (1) (2018) 97–106. [27] E. Wul, PowdMult, An Interactive Powder Diffraction Data Interpretation and Index Program, version 2.1, School of Physical Science, Flinders University of South Australia, Australia. [28] B.D. Cullity, Elements of X-Ray Diffraction, second ed., Addison-Wesley, Publishing Company Inc., Reading, MA, USA, 1978. [29] L.B. Tahar, L.S. Smiri, M. Artus, A.L. Joudrier, F. Herbst, M.J. Vaulay, S. Ammar, F. Fievet, Characterization and magnetic properties of Sm and Gd substituted CoFe2O4 nanoparticles prepared by forced hydrolysis in polyol, Mater. Res. Bull. 42 (2007) 1888–1896. [30] P. Kumar, C. Panda, M. Kar, Effect of rhombohedral to orthorhombic transition on magnetic and dielectric properties of La and Ti co-substituted BiFeO3, Smart Mater. Struct. 24 (2015) 045028. [31] R.K. Mishra, D.K. Pradhan, R.N.P. Choudhary, A. Banerjee, Effect of yttrium on
4. Conclusion Cobalt-substituted BCTF70/30 [Bi(Co0.35Ti0.35Fe0.30)O3] ecofriendly multiferroic material was successfully synthesized via a conventional oxide base reaction route. Powder X-ray diffraction (XRD) refinements and Raman spectroscopy analysis confirms that, the compound found to be crystallized in the single phase of orthorhombic symmetry with an average crystallite size of 29 nm. The microstructure consists of agglomerates of particles (spherical, triangular and rectangular) with grain size between 135 and 360 nm. We have highlighted the importance of dielectric, electrical and multiferroic features of said eco-friendly material. In this way, we have successfully investigated the temperature and frequency dependence of dielectric parameters (dielectric constant and loss). As a result, both dielectric parameters decrease with the rise in frequencies. This behavior is observed at low frequencies because of the presence of electronic and interfacial polarization. We have studied electrical features of BCTF70/30 material by using complex impedance spectroscopy (CIS) technique. The Nyquist diagram displays semicircle arcs, and an electrical circuit model has been proposed to describe the precise description of the impedance. In accordance, the electrical parameters (Z′, Z′′, M′ and M′′) have deliberated an interesting result as a function of both temperature and frequency. The scaling deviations in imaginary electric modulus describes a particular relaxation phenomenon at various temperatures, and gives a peak at a particular frequency that discrete a long range mobility to short range. The ac-conductivity (frequency dependent) plots described through the Jonscher's law, which suggests the conductivity increases with the rise of frequencies. The temperature dependent current density (J) versus electric field (E) diagram proves the non-Ohmic nature of the compound. The enhancement in polarization and magnetization values of BCTF70/30 eco-friendly multiferroic material may be utilized for further potential device applications. Acknowledgements Dr. Nitin Kumar is very much thankful to Indian Institute of Technology Guwahati and Indian Institute of Technology Bombay for providing some characterization facilities. We are also grateful to some people around us for their kind help. Summary statementConflict of interest The authors declare that they have no conflict of interest. It is declared that the work in the original. The work of the thesis has not been published in any journal or submitted for publications. 830
Ceramics International 45 (2019) 822–831
N. Kumar et al.
[32] [33]
[34] [35]
[36] [37]
[38] [39]
[40]
[41]
[42]
[43] [44] [45] [46] [47]
[48] [49] [50] [51]
crystal, J. Phys. Soc. Jpn. 70 (2001) 3129–3133. [52] J.R. Macdonald, Note on the parameterization of the constant-phase admittance element, Solid State Ion. 13 (1984) 147–149. [53] S.A. Saafan, S.T. Assar, Dielectric behavior of nano-structured and bulk Li Ni Zn ferrite samples, J. Magn. Magn. Mater. 324 (2012) 2989–3001. [54] S. Nath, S.K. Barik, S. Hajra, R.N.P. Choudhary, Studies of structural, impedance spectroscopy and magnetoelectric properties of (SmLi)1/2(Fe2/3Mo1/3)O3 electroceramics, J. Mater. Sci.: Mater. Electron. 29 (2018) 12251–12257. [55] B. Pati, R.N.P. Choudhary, P.R. Das, Phase transition and electrical properties of strontium orthovanadate, J. Alloy. Compd. 579 (2013) 218–226. [56] A.K. Jonscher, Universal Relaxation Law, Chelsea Dielectrics Press, London, 1996. [57] M. Fernando, S.M. Gubanski, Leakage currents on non-ceramic insulators and materials, IEEE Trans. Dielectr. Electr. Insul. 6 (5) (1999) 660–667. [58] G.W. Pabst, L.W. Martin, Y.H. Chu, R. Ramesh, Leakage mechanism in BiFeO3 thin films, Appl. Phys. Lett. 90 (2007) 072902–072904. [59] P. Zubko, D.J. Jung, J.F. Scott, Electrical characterization of PbZr0.4Ti0.6O3 capacitor, J. Appl. Phys. 100 (2006) 114113. [60] Z. Yan, K.F. Wang, J.F. Qu, Y. Wang, Z.T. Song, S.L. Feng, Processing and properties of Yb-doped BiFeO3 ceramics, Appl. Phys. Lett. 91 (2007) 082906–082908. [61] X. Qi, J. Dho, R. Tomov, M.G. Blamire, J.L. MacManus-Driscoll, Greatly reduced leakage current and conduction mechanism in aliovalent-ion-doped BiFeO3, Appl. Phys. Lett. 86 (2005) 062903–062905. [62] X.Q. Zhang, Y. Sui, X.J. Wang, Y. Wang, Z. Wang, Effect of Eu substitution on the crystal structure and multiferroic properties of BiFeO3, J. Alloy. Compd. 507 (2010) 157–161. [63] F. Xue, Q.Y. Fu, D.X. Zhou, Y.H. Tian, Y.X. Hu, Z.P. Zheng, L. Zhou, Properties of Bi0.8Ln0.2FeO3 (Ln = La, Gd, Ho) multiferroic ceramics, Ceram. Int. 41 (2015) 14718–14726. [64] S.M.H. Shah, A. Akbar, S. Riaz, S. Atiq, S. Naseem, Magnetic, structural and dielectric properties of Bi1-xKxFeO3 thin films using sol-gel, IEEE Trans. Magn. 50 (2014) 2201004. [65] S. Riaz, F. Majid, S.M.H. Shah, S. Naseem, Enhanced magnetic and structural properties of Ca doped BiFeO3 thin films, Indian J. Phys. 88 (10) (2014) 1037–1044. [66] F. Huang, X. Lu, W. Lin, X. Wu, Y. Kan, J. Zhu, Effect of Nd dopant on magnetic and electric properties of BiFeO3 thin films prepared by metal organic deposition method, Appl. Phys. Lett. 89 (2006) 242914. [67] N. Kumar, A. Shukla, R.N.P. Choudhary, Structural, dielectric, electrical and magnetic characteristics of lead-free multiferroic: Bi(Cd0.5Ti0.5)O3-BiFeO3 solid solution, J. Alloy. Compd. 747 (2018) 895–904. [68] B. Dhanalakshmi1, Pratap Kollu, B. Chandra Sekhar, B. Parvatheeswara Rao, P.S.V. Subba Rao, Enhanced magnetic and magnetoelectric properties of Mn doped multiferroic ceramics, Ceram. Int. 43 (2017) 9272–9275. [69] D. Damjanovic, Ferroelectric, dielectric and piezoelectric properties of ferroelectric thin films and ceramics, Rep. Prog. Phys. 61 (1998) 1267–1324. [70] G.H. Haertling, Ferroelectric ceramics: history and technology, J. Am. Ceram. Soc. 82 (1999) 797–818.
improvement of dielectric properties and magnetic switching behavior in BiFeO3, J. Phys.: Condens. Matter 20 (2008) 045218. 〈https://imagej.net/introduction〉. P. Pandit, S. Satapathy, P.K. Gupta, Effect of La substitution on conductivity and dielectric properties of Bi1-xLaxFeO3 ceramics: an impedance spectroscopy analysis, Physica B 406 (2011) 2669–2677. A.J. Moulson, J.M. Herbert, Electroceramics, 2nd edn., Wiley, Hoboken, NJ, 2003. S. Karadeniz, 60Co γ-ray irradiation effects on dielectric characteristics of tin oxide films of different thicknesses on n-type Si(1 1 1) substrates, Nucl. Instrum. Methods B260 (2007) 571–578. B. Barış, Ac conductivity and dielectric spectroscopy studies on tin oxide thin films formed by spray deposition technique, Physica B 438 (2014) 53–59. M. Viviani, M. Bassoli, V. Buscaglia, M.T. Buscaglia, P. Nanni, Giant permittivity and Maxwell–Wagner relaxation in Yb:CaTiO3 ceramics, J. Phys. D Appl. Phys. 42 (2009) 175407. M. Idrees, M. Nadeem, M. Atif, M. Siddique, M. Mehmood, M.M. Hassan, Origin of colossal dielectric response in LaFeO3, Acta Mater. 59 (2011) 1338–1345. Ming Li, Derek C. Sinclair, Transformation from insulating p-type to semiconducting n-type conduction in CaCu3Ti4O12-related Na(Cu5/2Ti1/2)Ti4O12 ceramics, J. Appl. Phys. 114 (2013) 034106. S.G. Kakade, Y.-R. Ma, R.S. Devan, Y.D. Kolekar, C.V. Ramana, Dielectric, complex impedance, and electrical transport properties of erbium (Er3+) ion-substituted nanocrystalline, cobalt-rich ferrite (Co1.1Fe1.9−xErxO4), J. Phys. Chem. C 120 (2016) 5682–5693. L. Sun, Z. Wang, Y. Shi, E. Cao, Y. Zhang, H. Peng, L. Ju, Sol-gel synthesized pure CaCu3Ti4O12 with very low dielectric loss and high dielectric constant, Ceram. Int. 41 (2015) 13486–13492. N. Adhlakha, K.L. Yadav, Study of dielectric, magnetic and magnetoelectric behavior of (x)NZF-(1-x) PLSZT multiferroic composites, IEEE Trans. Dielectr. Electr. Insul. 21 (5) (2014) 2055–2061. C.G. Koops, On the dispersion of resistivity and dielectric constant of some semiconductors at audio frequencies, Phys. Rev. 83 (1951) 121. M. Kaise, Electrical conductivity and complex electric modulus of titanium doped nickel–zinc ferrites, Physica B 407 (2012) 606–613. M.M. Ayad, E.A. Zaki, Synthesis and characterization of polyaniline films using Fenton reagent, J. Appl. Polym. Sci. 110 (2008) 3410–3419. J.R. Macdonald, Impedance Spectroscopy, John Wily & Sons, New York, 1987. A. Omri, M. Bejar, E. Dhahri, M. Es-Souni, M.A. Valente, M.P.F. Graça, L.C. Costa, Electrical conductivity and dielectric analysis of La0.75(Ca,Sr)0.25Mn0.85Ga0.15O3 perovskite compound, J. Alloy. Compd. 536 (2012) 173–178. N. Hirose, A.R. West, Impedance spectroscopy of undoped BaTiO3 ceramics, J. Am. Ceram. Soc. 79 (1996) 1633. I.M. Hodge, M.D. Ingram, A.R. West, A new method for analysing the a.c. behaviour of polycrystalline solid electrolytes, J. Electroanal. Chem. 58 (1975) 429–432. J. Liu, Ch.-G. Duan, W.-G. Yin, W.N. Mei, R.W. Smith, J.R. Hardy, Dielectric permittivity and electric modulus in Bi2Ti4O11, J. Chem. Phys. 119 (2003) 2812. J.S. Kim, Electric modulus spectroscopy of lithium tetraborate (Li2B4O7) single
831