JOURNAL OF APPLIED PHYSICS 98, 023715 共2005兲
Structural, electrical, optical, and mechanical characterizations of decorative ZrOxNy thin films P. Carvalho, F. Vaz,a兲 L. Rebouta, L. Cunha, C. J. Tavares, and C. Moura Departamento de Física, Universidade do Minho, 4800-058 Guimarães, Portugal
E. Alves Departamento de Física, Instituto Tecnológico Nuclear, Estrada Nacional 10, 2686-953 Sacavém, Portugal
A. Cavaleiro ICMES—Fac. Ciências Tecnologia Universidade de Coimbra, 3030-039 Coimbra, Portugal
Ph. Goudeau, E. Le Bourhis, and J. P. Rivière Laboratoire de Métallurgie Physique, Université de Poitiers, 86960 Futuroscope, France
J. F. Pierson Dpt CREST, Institut FEMTO-ST [UMR Centre National de la Recherche Scientifique (CNRS) 6174], Université de Franche-Comté, 25211 Montbéliard Cedex, France
O. Banakh University of Applied Sciences, Haute École ARC, 7, Avenue de l⬙Hotel-de-Ville, 2400 Le Locle, Switzerland
共Received 7 March 2005; accepted 7 June 2005; published online 28 July 2005兲 The main objective of this work is the preparation of decorative zirconium oxynitride, ZrOxNy, thin films by dc reactive magnetron sputtering. Film properties were analyzed as a function of the reactive gas flow and were correlated with the observed structural changes. Measurements showed a systematic decrease in the deposition rate with the increase of the reactive gas flow and revealed three distinct modes: 共i兲 a metallic mode, 共ii兲 a transition mode 共subdivided into three zones兲, and 共iii兲 an oxide mode. The measurements of target potential were also consistent with these changes, revealing a systematic increase from 314 to 337 V. Structural characterization uncovered different behaviors within each of the different zones, with a strong dependence of film texture on the oxygen content. These structural changes were also confirmed by resistivity measurements, whose values ranged from 250 to 400 ⍀ cm for low gas flows and up to 106 ⍀ cm for the highest flow rates. Color measurements in the films revealed a change from bright yellow at low reactive gas flows to red brownish at intermediate flows and dark blue for the films prepared at the highest flows. Hardness measurements gave higher values for the region where larger grain sizes were found, showing that the grain growth hardening effect is one of the main parameters that can help explain the observed behavior. Also the peak intensity ratio and the residual stress states were found to be important factors for explaining this behavior. © 2005 American Institute of Physics. 关DOI: 10.1063/1.1990261兴 I. INTRODUCTION
In the last few years an emergent field of research involving the so-called decorative thin films is gaining more and more importance. Colored films on high-quality consumer products are supposed to provide both scratch resistance and protection against corrosion, while enhancing their appearance due to surface attractive colorations. Regarding the apparent colorations of thin films, one must distinguish between the inherent colorations 共e.g., nitrides, carbonitrides, or borides兲 and apparent colorations due to interference effects 共e.g., transparent oxide or ultrathin absorbing films兲.1 Since the apparent colorations of interference films are primarily influenced by their thickness,2 their use appears to be a less suitable choice as decorative coatings. However, the increasing demand for low-cost products and reduced material resources is moving research towards the development of a兲
Author to whom correspondence should be addressed; electronic mail:
[email protected]
0021-8979/2005/98共2兲/023715/8/$22.50
deposition procedures that will provide the basis for different colored films, with minimum use of resources. In this sense, the continuous change in deposition procedures, such as material targets and/or reactive gas changes, to obtain different colored films is c1early not suitable. Recently, a c1ass of materials, the metal oxynitrides thin films, MeOxNy 共Me= early transition metal兲,1,3–7 is gaining importance in several technological applications. These are also being investigated for decorative applications. Their relevance arises from the fact that the presence of oxygen allows the tailoring of film properties between those of metallic nitrides, MeN, and those of the correspondent insulating oxides, MeOx. Tuning the oxide/nitride ratio allows one to tune the band gap, bandwidth, and crystallographic order between oxide and nitride and hence the electronic and optical properties of materials, including color. The main purpose of this work consists of the preparation of colored films, based on single-layered zirconium ox-
98, 023715-1
© 2005 American Institute of Physics
Downloaded 16 Sep 2005 to 193.136.74.250. Redistribution subject to AIP license or copyright, see http://jap.aip.org/jap/copyright.jsp
023715-2
J. Appl. Phys. 98, 023715 共2005兲
Carvalho et al.
ynitrides, ZrOxNy. Elucidating the relationship between color and the corresponding physical, structural, and mechanical properties is an important goal of this work.
II. EXPERIMENTAL DETAILS
ZrOxNy thin films were deposited onto high-speed steel 共AISI M2兲, stainless-steel 共AISI 316兲, and single-crystal silicon 共100兲 substrates by reactive dc magnetron sputtering in a laboratory-size deposition system.8 It consisted of two vertically opposed rectangular magnetrons 共unbalanced of type 2兲, in a closed field configuration.9 The films were prepared with the substrate holder positioned at 70 mm in all runs, using a dc density of 100 A m−2 on the zirconium target 共99.6 at. % 兲. A gas atmosphere composed of argon 共working gas兲 and nitrogen ⫹ oxygen 共19:1 ratio兲 reactive mixture was used for the depositions. The Ar flow was kept constant at 55 SCCM 共standard cubic centimeter per minute兲 and the mixed reactive gas flow rate varied from 4 to 17.5 SCCM. The working pressure was approximately constant at 0.4 Pa and the substrates were grounded. The pumping speed was adjusted for 356 l / s. The atomic composition of the asdeposited samp1es was measured by Rutherford backscattering spectroscopy 共RBS兲 using a 2-MeV He+ beam as well as 1.4- and 2-MeV proton beams to increase the accuracy in the oxygen signals. The analyzed area was about 0.5 ⫻ 0.5 mm2. In addition, for some samples, particle-induced x-ray emission 共PIXE兲 measurements were performed to check for impurities. Ball crater tests were used to measure the thickness of the samples. In order to examine the film structure, x-ray-diffraction 共XRD兲 experiments were undertaken in a Philips PW 1710 apparatus, using Cu K␣ radiation. Glancing incidence x-ray-diffraction 共GIXRD- = 2 ° 兲 experiments were also performed on some selected samples, where the phase indexing revealed some doubts. Electrical resistivity was deduced from sheet resistance measurements at room temperature, using the four-point probe method. The characterization of film’s color was computed using a commercial MINOLTA CM-2600d portable spectrophotometer 共wavelength range: 400– 700 nm兲, using diffused illumination at an 8° viewing angle. The spectrophotometer was equipped with a 52-mm diameter integrating sphere and three pulsed xenon lamps. Color specification was computed under the standard CIE illuminant D65 共specular component excluded兲 and represented in the CIELAB 1976 color space.10,11 Film’s hardness and Young’s modulus were determined from the loading and unloading curves, carried out with an ultralow load-depth sensing Berkovich nanoindenter from CSM Instruments 共Switzerland兲. Poisson’s ratio of 0.3 was used for the calculations. The maximum load used was 30 mN, with a loading time of 30 s, holding 30 s, and unloading in 30 s, producing an average number of 15 indentations per sample. The residual stresses were calculated using Stoney’s equation,12 after measuring the parabolic deflections of the thin substrates 共AISI 316兲 by laser triangulation, before and after deposition of the films.
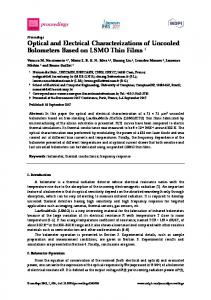
FIG. 1. Variation of the deposition rate of the ZrOxNy films as a function of the reactive gas flow. The figure also shows the amount of oxygen, nitrogen, and their sum 共normalized to the amount of zirconium兲. The solid circles correspond to the deposition rate.
III. RESULTS
The film thicknesses ranged from 3 to 4 m and their oxygen and nitrogen contents 共normalized to the zirconium content兲 will be noted in the text as x and y, respectively. The variation of the deposition rate with the reactive gas flow is plotted in Fig. 1. The figure shows that the evolution of the deposition rate can be divided into three different modes 共regimes兲: 共i兲 a metallic mode, 共ii兲 a transition mode 共which is subdivided in three distinct zones兲, and 共iii兲 an oxide mode. The distinct zones within the transition mode are directly correlated with the structural features of the films. The first regime—metallic mode—includes the group of samples prepared with reactive gas flows from 4 to 5.5 SCCM, with an atomic ratio of nonmetallic to metallic atoms, 共N + O兲 / Zr, lower than and close to 1, exhibiting color appearances from metallic color towards light silver yellow, which is characteristic of sub-stoichiometric zirconium nitride films, ZrNx. In these low reactive gas flows, the sputtering process is in the metallic regime, resulting in higher deposition rates. For reactive gas flows between 5.5 and 15 SCCM there is a transition mode, which can be divided in three distinct zones, the transition zones I, II, and III, as it will be shown later by different analyses. In these transition zones, the deposition rate decreases continuously and tends to stabilize at the highest flow rates—the oxide mode. It is important to note that the transition zone I 共reactive gas flows from 5.5 up to 7 SCCM兲 includes the ZrN film 共prepared with 6.5 SCCM of pure nitrogen reactive gas兲, which can be associated with the transition regime between the metallic and compound regimes in the hysteresis cycle of pure nitrides.13 Additionally, the samples change color from light gold to brownish yellow. The existence of the transition zone II 共reactive gas flows between 7 and 11 SCCM兲 and III 共from 11 up to 15 SCCM兲 is a consequence of the increasing oxygen content of the films. This influence of the oxygen content in the films will be analyzed in more detail later, as well its influence in the other scanned properties. The progressive decrease of the deposition rate within these transition zones is a consequence of the well-known poisoning effect of the target by both
Downloaded 16 Sep 2005 to 193.136.74.250. Redistribution subject to AIP license or copyright, see http://jap.aip.org/jap/copyright.jsp
023715-3
Carvalho et al.
J. Appl. Phys. 98, 023715 共2005兲
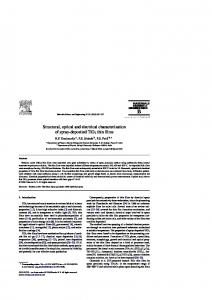
FIG. 2. Variation of the zirconium target potential as a function of the reactive gas flow.
reactive gases.2 Both zirconium nitride and oxide layers form at the surface of the Zr target. Since the sputtering yield of both compounds is lower than that of Zr, a decrease in the deposition rate is expected. From this increasing poisoning, the deposition rate falls from ⬃6.5 to ⬃ 3 m / h. The evolution of the deposition rate with the reactive gas flow is also well correlated with the change of the concentration of nonmetallic elements, x + y, as can be seen in Fig. 1. The metalloid content is lower than 1 for the depositions performed in the metallic mode, increasing to about 1 in the transition zone I, to about 1.2 in the transition zone II, and finally rises to about 1.4, when going from transition zone III to the films deposited at highest reactive gas flows 共oxide mode兲. The above-mentioned target poisoning effect, based on measurements of the Zr target potential, is shown in Fig. 2. For very low reactive gas flows, all the available gas is consumed and the target potential is roughly constant 共UZr varies from 314 to 318 V兲, corresponding to the metallic mode regime. With an increase in the reactive gas flow, the target potential progressively rises up to a value close to 337 V, then remains constant for the highest flows, which corresponds to the regime of target poisoning. It is worth of mentioning that the value of target potential for “pure” ZrN was 314 V, which does not follow the growth tendency, due to the absence of oxygen in the reactive gas during its preparation. The presence of oxygen in the oxynitride samples is certainly a factor that has to be taken into account, since this element affects the sample behavior. In order to understand the mechanisms of chemical reactions occurring within the different sputtering modes, a detailed structural characterization was carried out. Figure 3 shows the x-ray-diffraction patterns for the samples prepared within the different sputtering modes, where the differences in preferential orientation within each of the zones are clearly visible. For the metallic mode regime, the films crystallize in a B1–NaCl crystal structure, typical for ZrN. Similar behavior was observed in transition zone I, although the peak intensity ratio, I共200兲 / 关I共111兲 + I共200兲兴 in Fig. 4, is increasing. Hence, indicating some preferential crystalline growth change. This preferred orientation change occurs for
FIG. 3. XRD and GIXRD patterns for five different ZrOxNy films. The vertical lines indicate the diffraction peak position of the reference ZrN phase.
the films prepared in intermediate zone II, where the 共200兲 becomes the dominant growth. The effect of the increasing reactive gas and the amount of oxygen 共and the correspondent variation in the deposition rate, Fig. 1兲 is a parameter that influences this variation. In the literature there are several references to similar texture changes. Wu et al.14 showed that ZrN films 共stoichiometric and substoichiometric兲 grow preferentially 具111典 oriented, even on different types of substrates. The change of growth direction towards 具100典 at a high nitrogen partial pressure was also reported by Ramana et al.,15 Gall et al.,16
FIG. 4. Variation of the peak intensity ratio and lattice parameter in the films from metallic and intermediate zones I and II, as a function of the reactive gas flow.
Downloaded 16 Sep 2005 to 193.136.74.250. Redistribution subject to AIP license or copyright, see http://jap.aip.org/jap/copyright.jsp
023715-4
Carvalho et al.
FIG. 5. Film residual stress evolution as a function of the reactive gas flow.
and Shin et al.17 Several models for preferred orientation changes in the sputtered metallic nitride films, MeN 共Me = Ti, Zr, Cr, etc.兲, have been extensively discussed in the literature.18–21 Pelleg et al.22 and Oh and Je23 proposed that the preferred orientation in these metallic nitrides is determined by a competition between the two thermodynamic parameters, the tendency to decrease the surface energy and the tendency to decrease the strain energy. Since the 共200兲 planes are associated with the lowest surface energy, a 具100典 orientation should then be observed at low residual stress conditions.4 However, these parameters cannot explain themselves all the behaviors, since for some cases of low reactive gas flows, there are also small values of stress for the films exhibiting a 具111典 orientation.4 Mahieu et al.24 stated that this change from 具111典 to 具100典 can also be the result of distinct growth modes, such as the microstructure changes from zone T to zone I, according to Thornton’s zone model.25 These changes were also reported in our previous works as a result of the increasing gas flow.4 The 具100典 orientation within the intermediate zone II is decreasing continuously as can be seen from the peak intensity ratio 共Fig. 4兲. In fact, for a reactive gas flow of 11 SCCM, this parameter is already below 0.4, which shows that the films are mostly randomly oriented. Also the lattice parameter is decreasing significantly within this region. This reduction of lattice parameter is in good agreement with the evolution of the residual stresses 共Fig. 5兲, which follows the same behavior. Indeed, the evolution of the film structure is dependent on the lattice defect formation, such as the oxygen interstitials/substitutions, and the type of crystalline phases 共nitride/oxide/oxynitride兲 that are formed. Moreover, the high residual stresses cannot be attributed to ion bombardment, since the samples were grounded during its preparation. The reason might be in the insertion of oxygen atoms in the ZrN lattice in interstitial 共tetrahedrical兲 positions. However, the insertion of oxygen atoms only happens for low 共or intermediate兲 oxygen content, where in the presence of thermodynamic and kinetic constraints the probability of having oxygen atoms as nearest neighbors to the Zr atoms in the ZrN arrangements is relatively high. Increasing the oxygen
J. Appl. Phys. 98, 023715 共2005兲
content, the concentration of oxygen atoms increases, increasing also the probability of having other oxygen atoms as nearest neighbors, and thus favoring the formation of oxide phases, or other phases, rather than those oxygen-doped nitride phases. This will also decrease the ZrN fcc lattice parameters as well as the residual stress states. Regarding the x-ray diffractograms for the films prepared with reactive gas flows between 11 and 15 SCCM—transition zone III—the results suggest that the development of a crystalline structure that does not match with that of fcc ZrN. The peak located at 2 ⬇ 32.2° presents a shift from the 共111兲 reference ZrN of about 2°. The results from glancing geometry experiments further attested this behavior, while a very broad peak around 56° also appeared. One possibility is that this could be the result of the formation of an oxygen-doped zirconium nitride phase 共also with possible nitrogen interstitials兲, resulting in a structure close to that of Zr3N4.26 The diffraction peak at 2 ⬇ 32.2° would then correspond to the 共320兲 plane of that doped Zr3N4-type structure or even to a mixture of several peaks predicted in this region for this structure. The peak at 2 ⬇ 56° could relate or be a mixture of diffraction peaks predicted for the Zr3N4-type structure16 in the region 2 = 54° – 56°. Several authors have already indicated the shift of the 共111兲 peak of the ZrN 共NaCl-type phase兲 towards smaller angles for the films prepared with high nitrogen flows,16,27–30 which resulted in the development of a poorly crystallized Zr3N4 phase. In the case presented here, the reduced number of diffraction peaks does not allow any further conclusions about the exact nature of the crystalline phase to be made. Furthermore, the flow rate used for the preparation of pure ZrN was about 6.5 SCCM, and in the case of the films from transition zone III, the reactive gas flows used were between 11 and 15 SCCM 共more than twice that of pure ZrN兲. It was also seen, in Fig. 1, that the amount of N + O elements in this third zone is about 1.4, with an amount of nitrogen close to 1.1 共less than that normally present for the development of the Zr3N4 phase,16,27–30 but similar to pure nitrogen reactive atmospheres兲. This means that if that phase is developed, it probably involves oxygen. In fact, when preparing the ZrNx films with amounts of reactive gas 共pure nitrogen兲, such as those of the reactive gas mixture used within this transition zone III 共between 11 and 15 SCCM兲, the only phase observed was the one related to ZrN, which means that the oxygen content is ruling this phase transition. According to some authors, this Zr3N4 phase 共orthorhombic兲 is formed as a result of cell expansion by incorporation of nitrogen 共and oxygen兲 atoms in interstitial positions.26,31–33 Other authors have described it as a relaxed NaCl structure with some Zr vacancies.27,28 For the films deposited in the oxide mode 共with reactive gas flows higher than 15 SCCM兲, there is another structural change, but again, the reduced number of visible diffraction peaks does not allow a detailed and conclusive analysis. Nevertheless, the diffraction peak at 2 ⬇ 30.1° could correspond to the 共011兲 planes of a tetragonal zirconium oxide, ZrO2, or the 共111兲 planes of a cubic zirconium oxide structure.34 The diffraction peak at 2 ⬇ 31.3° could be assigned to the 共111兲 planes of a zirconium oxide monoclinic-
Downloaded 16 Sep 2005 to 193.136.74.250. Redistribution subject to AIP license or copyright, see http://jap.aip.org/jap/copyright.jsp
023715-5
Carvalho et al.
J. Appl. Phys. 98, 023715 共2005兲
FIG. 6. Change in the film grain size as a function of the reactive gas flow.
FIG. 7. Variation of film electrical resistivity as a function of the reactive gas flow.
type structure. The possibility of the development of a zirconium oxide orthorhombic structure should also be considered, which would then result from the evolution of that oxygen-doped Zr3N4 phase towards an oxide-type one 共with possible nitrogen inclusions兲. The diffraction peak at 2 ⬇ 30.1° would then correspond to the 共111兲 planes. Again, the preparation of pure zirconium oxide, ZrOx, films with increasing oxygen content led to the development of similar mixture of oxide phases, but with higher oxygen flows. This indicates that nitrogen is also influencing the phase evolution, even in this oxide mode. Although the formation of amorphous oxides structures is very often found, several authors claim the formation of both monoclinic and tetragonal oxide phases in the oxide sputtering regime.35–37 These distinct behaviors in the transition zone III and the oxide mode regime is also seen from Fig. 2, where the target potential grows steadily up to 15 SCCM, the region of the oxygendoped Zr3N4 region, stabilizing for higher flows, the oxide regime. In order to follow these structural transitions, XRD peak simulation and grain size evaluation, by integral breadth, were carried out 共Fig. 6兲. The results show that the films within transition zone II have larger grains, while the films within transition zone III and in the oxide mode show the smallest ones, revealing an increasing tendency for the films to become amorphous with growing oxygen content 共increasing of reactive gas flow兲. The amount of oxygen is also an important factor for the changes occurring in transition zones I and II. In fact, when preparing the nitride films 共only nitrogen in the reactive gas兲, the transition from 具111典 to 具200典 growth with increasing gas flow was followed by a decrease in grain size. Similar behavior is also reported in the literature.16 In the case of the oxynitrides reported here, this transition is followed by an increase in grain size 共Fig. 6兲, showing that it is not just a case of a surface energy minimization dominant process, but also a deformation energy dominant process that is mainly due to the oxygen incorporation in the ZrN lattice and thus the creation of inherent structural defects. The distinct behaviors occurring within the different
zones can also be correlated with the resistivity values 共taken at room temperature兲, as a function of the reactive gas flow 共Fig. 7兲. The initial low values of resistivity are related with the “roughly” metallic nature of the films, with compositions between that of Zr and substoichiometric ZrN共O兲 共see Fig. 1兲. The low oxygen content and the similar structure obtained—共111兲—for all the films make them very similar in structural terms. The increase of resistivity for reactive gas flows higher than 7 SCCM can be explained by the decrease of the metallic bond contribution and the formation of oxygen-doped ZrN crystalline phase towards a nitrogenoxygen-rich phase, similar to that of Zr3N4. The decrease of the metallic bond contribution can be described by a model of bonding of metal 共oxy兲nitrides. The electron charges of the transition-metal transfer to nitrogen 共and oxygen兲 forms the transition-metal 共oxy兲nitride. Accordingly, higher N / Zr and O / Zr atomic ratios result in a higher consumption of the free d electrons from zirconium atoms and thus fewer free d electrons are available for conduction. This reduction of the number of free electrons decreases the metallic bond contribution and increases the covalent Zr–N and ionic Zr–O bonds,38 thus increasing the resistivity. Another factor that could decrease the metallic bond contribution39 and subsequently increasing the resistivity is the growing incorporation of oxygen and nitrogen within the ZrN matrix, which leads to lattice distortions. Finally, another factor that is also important for the increase of resistivity observed for reactive gas flows higher than 7.0 SCCM is the increase of the grain boundaries 共grain size is reduced as a function of reactive gas flow in this region and thus the number of grain boundaries increases兲, which favors the scattering of electrons and thus the increase of resistivity. The development of an oxygen-doped crystalline phase similar to that of Zr3N4, as a consequence of growing incorporation of interstitial atoms 共mostly nitrogen, but also possibly oxygen兲, is consistent with the high values of resistivity within the region, where this insulating phase25 was identified by XRD. On increasing the gas flow/oxygen contents further on, the films revealed a tendency to develop different structures, which were identified as oxide phases. The occur-
Downloaded 16 Sep 2005 to 193.136.74.250. Redistribution subject to AIP license or copyright, see http://jap.aip.org/jap/copyright.jsp
023715-6
Carvalho et al.
J. Appl. Phys. 98, 023715 共2005兲
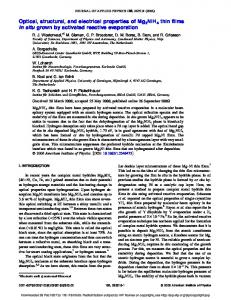
FIG. 9. Hardness and Young’s modulus of the sputtered ZrOxNy films as a function of the reactive gas flow.
FIG. 8. Average color coordinates in the CIELAB 1976 color space 共see Refs. 10 and 11兲 under the standard CIE illuminant D65, for the films prepared with different reactive gas flows.
rence of these highly insulating phases is also consistent with the fact that it was not possible to measure the resistivity values of these films. Figure 8 shows the color coordinates L*, a*, and b*, represented in the CIELAB 共1976兲 color space.10,11 As can be seen from the figure, with increasing flow rate from 4 to 5.5 SCCM 共increasing oxygen content兲, the value of a* 共redness兲 decreases, while b* 共yellowness兲 and L* 共brilliance兲 values increase. The color changes from a very bright yellow pale at the metallic mode to a golden one in transition zone I. With further increase of the flow rate, the film color changes to red brownish 共high values of a*兲 in transition zone II and dark blue 共negative b* values and relatively low a* values兲 at higher flow rates 共艌11 SCCM兲. A significant decrease of L* for the films deposited at flows between 5.5 and 10 SCCM was observed. For reactive gas flows higher than 10 SCCM the L* coordinate becomes almost constant at a value of about 55. These results indicate a strong influence of the reactive gas flow on film color, which is directly related to the oxygen content in the films. The optical properties of a material, including its color, are defined by its electronic structure, namely, intra- and interband electronic transitions, occurring during the interaction of material with incident light. The optical properties of the metalliclike Zr–O–N films of transition zone I are dominated by the intraband transitions, due to free electrons. The dielectric function spectra of these films, as measured by spectroscopic ellipsometry, showed a Drude-like behavior, typical for metallic materials, with r negative up to 2.95 eV. The optical parameters 共refractive index n and extinction coefficient k taken at 633 nm兲 of the film deposited at 5.5 SCCM are, respectively, 1.04 and 2.74. With increasing gas flow the contribution of the interband transitions, due to bound electrons, became more pronounced, while the contribution of the intraband transitions is less important. This effect can be observed by the decrease in the brightness 共L*兲
and a progressive shift of r to positive values with increasing gas flow. The optical parameters of the films also evolve with gas flow, n633 increases and k633 decreases, indicating a decrease in film opacity. The optical parameters n633 and k633 for the film deposited at 7.5 SCCM are 1.66 and 1.63, and for the film deposited at 9 SCCM, 2.0 and 1.1, respectively. In the metallic regime, the films exhibit a color, which is between metallic gray 共typical for Zr兲 and golden 共characteristic of near-stoichiometric ZrN兲. In transition zone I 共golden films兲, there is almost no change in the colorimetric coordinates, which is consistent with the presence of the nearstoichiometric ZrN films, and also with the resistivity measurements 共Fig. 7兲. In transition zone II, a reduction of L*, an increase of a*, and a reduction of b* can be explained by the decreasing metallic character of the films 共less metallic Zr–Zr bonds兲. The electron charge transfer from Zr atoms to metalloid 共O and N兲 atoms increases with increasing metalloid content in Zr–O–N. Higher metalloid content results in higher consumption of free d electrons from Zr atoms and less free d electrons are available for conductivity. Consequently, brilliance 共L*兲 drops with increasing metalloid content. The XRD data of the films in transition zone III and oxide regime 共Fig. 3兲 indicate the development of overstoichiometric nitride 共oxide兲 and oxide phases. The film resistivity values 共Fig. 8兲 become extremely high. The optical properties of these films are governed explicitly by the interband transitions, which are characteristic of semiconducting materials. The influence of the reactive gas mixture flow variation and its effect on the structural properties of the film can also be correlated with the evolution of its mechanical properties. Figure 9 shows the change in film hardness and Young’s modulus as a function of the reactive gas flow. The first noticeable result is the increase in hardness when going from the metallic regime films towards those of transition zones I and II, following the change from a 共111兲 texture to a 共200兲 one. The maximum value of hardness occurs in the second transition zone, which is then followed by a decrease reaching an approximately constant value of about 24 GPa for flows higher than 12 SCCM. It is also worth noting that the region of the highest peak intensity ratio, I共200兲 / 关I共111兲 + I共200兲兴 共Fig. 4兲, corresponds to the region of the highest hardness.
Downloaded 16 Sep 2005 to 193.136.74.250. Redistribution subject to AIP license or copyright, see http://jap.aip.org/jap/copyright.jsp
023715-7
J. Appl. Phys. 98, 023715 共2005兲
Carvalho et al.
Although the structural changes seem to dictate this evolution, Figs. 5 and 6 suggest that other parameters are playing an important role. In fact, there are several works in the literature that try to explain how hardness evolves, taking into account structural parameters, such as the lattice parameter variations, the peak intensity ratio, grain size, residual stresses, and among others.40 When using ternary nitrides, based on the introduction of an element in a well-known binary nitride, such as here adding oxygen to ZrN, the concentration of the added element is seen as a major parameter with a significant role for the observed behavior. This seems to be also the case here. For low oxygen contents 共6 – 8 at. % 兲, hardness values are very similar to that of pure ZrN. For intermediate oxygen contents there is a maximum in hardness, which can result from oxygen doping of the ZrN lattice, giving rise to a solid solution hardening mechanism. With oxygen insertion, an increased strength of the material due to lattice distortions is expected.41 The distortion inhibits the mobility of the dislocations, thus inducing an enhancement in hardness. The fact that no bias voltage was used 共no ion bombardment兲 results in low surface mobility and thus the opportunity for oxygen insertions and grain growth 共Fig. 6兲. This figure shows that the grain growth is playing an important role and that the region where larger grain sizes are developed is the one where higher hardness values are obtained. By comparing the hardness evolution with the trend associated with the residual stress in Fig. 5, one might conclude that beyond these mentioned parameters, the compressive residual stress state of the samples is also a factor to take into account. However, it is clear that stresses are not the only important parameter for the interpretation of the hardness data, since the hardest samples 共prepared with gas flows within the region of 7.5– 9 SCCM, and having the hardness values ranging from 34 to 36 GPa兲 show a residual stress decrease from −4.1 to − 2.4 GPa. Furthermore, a comparison between Figs. 5 and 9 shows that the hardness can vary from about 25 to ⬃ 35 GPa, for the films with residual stresses around −3 GPa. These relatively high residual stresses could be associated with the incorporation of oxygen within the ZrN lattice, which would induce lattice defects in the film structure that act as obstacles for the dislocation motion,42,43 thus enhancing hardness. IV. CONCLUSIONS
Thin Zr–O–N films were prepared by dc reactive magnetron sputtering. A systematic decrease in the deposition rate with the increase of the oxygen fraction was observed, revealing the existence of three different sputtering modes—a metallic mode, a transition mode 共subdivided in three distinct zones兲, and an oxide mode. These different modes can be explained by the target poisoning by both reactive gases. The measurements of the target potential are consistent with the changes in the deposition rate. The structural characterization revealed a strong dependence of the film texture on the oxygen content, exhibiting a change from a 共111兲 fcc ZrN-type growth to 共200兲 for low gas flows. On increasing the gas flow 共increase of oxygen content兲, the
films tend to develop a structure that might be similar to that of Zr3N4 with oxygen inclusions. For relatively high gas flows, the films exhibited only crystalline structures that were indexed as oxide phase. These structural changes were also correlated with the electrical and optical properties of the films 共resistivity and color兲. The initial low values of resistivity are related with the roughly metallic nature of the films, with compositions between that of Zr and substoichiometric ZrN共O兲. The resistivity of the films increases for reactive gas flows higher than 7 SCCM, which can be explained by the decrease of the metallic bond contribution and the formation of oxygen-doped ZrN crystalline phase towards a nitrogen+ oxygen-rich phase, similar to that of Zr3N4. The color changes from a very bright yellow pale in the metallic regime to golden one in transition zone I. With further increase of the flow rate, the film color changes to red brownish 共high values of a*兲 in transition zone II and dark blue 共negative b* values and relatively low a* values兲 at higher flow rates 共艌11 SCCM兲. Hardness measurements revealed higher values for the films in the region where larger grains were developed and also a dependence of hardness on the residual stress states. Together with these factors, the structural parameter 共XRD peak intensity ratio兲 and the compositional parameter 共oxygen content兲 are the factors resulting in such behavior. ACKNOWLEDGMENTS
The work described in this paper is supported by the European Union through the NMP3-CT-2003 505948 project “HARDECOAT.” The authors are also grateful to the financial support of the Portuguese FCT institution by the Project No. POCTI/CTM/38086/2001 cofinanced by European community fund FEDER. R. Franchy, Surf. Sci. Rep. 38, 195 共2000兲. M. Ohring, The Materials Science of Thin Films 共Academic, New York, 1992兲. 3 E. Ariza et al., Thin Solid Films 469–470, 274 共2004兲. 4 F. Vaz et al., Thin Solid Films 469–470, 11 共2004兲. 5 F. Vaz et al., Thin Solid Films 447–448, 449 共2004兲. 6 E. Alves, A. Ramos, N. Barradas, F. Vaz, P. Cerqueira, L. Rebouta, and U. Kreissig, Surf. Coat. Technol. 180–181, 372 共2004兲. 7 F. Vaz, P. Cerqueira, L. Rebouta, S. M. C. Nascimento, E. Alves, Ph. Goudeau, and J. P. Rivière, Surf. Coat. Technol. 174–175, 197 共2003兲. 8 E. Ribeiro, A. Malczyk, S. Carvalho, L. Rebouta, J. V. Fernandes, E. Alves, and A. S. Miranda, Surf. Coat. Technol. 151–152, 515 共2002兲. 9 B. Window and N. Savvides, J. Vac. Sci. Technol. A 4, 196 共1986兲. 10 Colorimetry, CIE Publication No. 15 共Commission Internationale de L’Éclairage, Paris, 1971兲. 11 Recommendations on Uniform Color Spaces, Difference-Difference Equations, Psychometric Color Terms, CIE Publication, Suppl. No. 2–70 共Commission Internationale de L’Éclairage, Paris, 1978兲. 12 G. G. Stoney, Proc. R. Soc. London, Ser. A 82, 172 共1909兲. 13 D. A. Glocker and S. Ismat Shah, Thin Film Process Technology 共Institute of Physics, Bristol, UK, 1995兲. 14 D. Wu, Z. Zhang, W. Fu, X. Fan, and H. Guo, Appl. Phys. A: Mater. Sci. Process. 64, 593 共1997兲. 15 J. V. Ramana, S. Kumar, C. David, A. K. Ray, and V. S. Raju, Mater. Lett. 43, 73 共2000兲. 16 D. Gall, S. Kodambaka, M. A. Wall, I. Petrov, and J. E. Greene, J. Appl. Phys. 93, 9086 共2003兲. 17 C. S. Shin, D. Gall, Y. W. Kim, N. Hellgren, I. Petrov, and J. E. Greene, J. Appl. Phys. 92, 5084 共2002兲. 18 R. Lamni, E. Martinez, S. G. Springer, R. Sanjinès, P. E. Schmid, and F. Lévy, Thin Solid Films 447–448, 316 共2004兲. 1 2
Downloaded 16 Sep 2005 to 193.136.74.250. Redistribution subject to AIP license or copyright, see http://jap.aip.org/jap/copyright.jsp
023715-8 19
J. Appl. Phys. 98, 023715 共2005兲
Carvalho et al.
B. Okolo, P. Lamparter, U. Welzel, T. Wagner, and E. J. Mittemeijer, Thin Solid Films 474, 50 共2005兲. 20 Z. B. Zhao, Z. U. Rek, S. M. Yalisove, and J. C. Bilello, Surf. Coat. Technol. 185, 329 共2004兲. 21 J.-H. Huang, K.-W. Lau, and G.-P. Yu, Surf. Coat. Technol. 191, 17 共2005兲. 22 J. Pelleg, L. Z. Zervin, S. Lungo, and N. Croitoru, Thin Solid Films 197, 117 共1991兲. 23 U. C. Oh and J. H. Je, J. Appl. Phys. 74, 1692 共1993兲. 24 S. Mahieu, G. Winter, D. Depla, R. De Gryse, and J. Denul, Surf. Coat. Technol. 187, 122 共2004兲. 25 J. A. Thornton, Annu. Rev. Mater. Sci. 7, 239 共1977兲. 26 D. I. Bazhanov, A. A. Knizhnik, A. A. Safonov, A. A. Bagatur’yants, M. W. Stoker, and A. A. Korkin, J. Appl. Phys. 97, 044108 共2005兲. 27 L. Pichon, T. Girardeau, A. Straboni, F. Lignou, P. Guérin, and J. Perrière, Appl. Surf. Sci. 150, 115 共1999兲. 28 L. Pichon, T. Girardeau, A. Straboni, F. Lignou, J. Perrière, and J. M. Frigerio, Nucl. Instrum. Methods Phys. Res. B 147, 378 共1999兲. 29 H. M. Benia, M. Guemmaz, G. Scmerber, A. Mosser, and J. C. Parlebas, Appl. Surf. Sci. 200, 231 共2002兲. 30 H. M. Benia, M. Guemmaz, G. Scmerber, A. Mosser, and J. C. Parlebas, Appl. Surf. Sci. 211, 146 共2003兲. 31 J. P. Dauchot, S. Edart, M. Wautelet, and M. Hecq, Vacuum 46, 927 共1995兲. 32 M. Yoshitake, T. Nosaka, A. Okamoto, and S. Ogawa, Jpn. J. Appl. Phys., Part 2 32, L113 共1993兲.
33
B. O. Johansson, H. T. G. Hentzell, J. M. E. Harper, and J. J. Cuomo, J. Mater. Res. 1, 442 共1986兲. 34 J. P. Holgado, J. P. Espinos, F. Yubero, A. Justo, M. Ocana, J. Benitez, and A. R. Gonzalez-Elipe, Thin Solid Films 389, 34 共2001兲. 35 S. Venkataraj, O. Kappertz, H. Weis, R. Drese, R. Jayavel, and M. Wuttig, J. Appl. Phys. 92, 3599 共2002兲. 36 K. Koski, J. Holsa, and P. Juliet, Surf. Coat. Technol. 120–121, 303 共1999兲. 37 S. A. Catledge, M. Cook, Y. K. Vohra, E. M. Santos, M. D. Mcclenny, and K. D. Moore, J. Mater. Sci.: Mater. Med. 14, 863 共2003兲. 38 D. Pilloud, A. S. Dehlinger, J. F. Pierson, A. Roman, and L. Pichon, Surf. Coat. Technol. 174–175, 338 共2003兲. 39 P. Schwarzcopf and R. Kieffer, Refractory Hard Metals 共Macmillan, New York, 1953兲, p. 37. 40 A. Cavaleiro, B. Trindade, and M. T. Vieira, Nanostructured Coatings— The Influence of the Addition of a Third Element on the Structure and Mechanical Properties of Transition Metal-Based Nanostructured Hard Films; Part I—Nitrides, edited by J. M. Th. De Hosson and A. Cavaleiro 共Kluwer, New York, in press兲. 41 D. Sherman and D. Brandon, Handbook of Ceramic Hard Materials 共Wiley-VCH, New Jersey, 2000兲. 42 K. Karlsson, L. Hultman, and J.-E. Sundgren, Thin Solid Films 371, 167 共2000兲. 43 H. Oettel, T. Bertram, V. Weihnacht, R. Wiedemann, and S. V. Zitzewitz, Surf. Coat. Technol. 97, 785 共1997兲.
Downloaded 16 Sep 2005 to 193.136.74.250. Redistribution subject to AIP license or copyright, see http://jap.aip.org/jap/copyright.jsp