Structural Health Monitoring for Sustainable and Resilient Infrastructure Management Sarah Dalton, Sez Atamturktur* and Hsein Juang Glenn Department of Civil Engineering, Clemson University, South Carolina 29634, US
Abstract This manuscript introduces a methodology to build a new framework, Structural LifeCycle Assessment (S-LCA), for quantifying the structural sustainability and resiliency of built systems. This research brings together techniques and concepts from two distinct disciplines: Structural Health Monitoring (SHM) of Civil Engineering and Life Cycle Assessment (LCA) of Environmental Engineering to construct the aforementioned S-LCA charts. The intellectual innovations of this manuscript lie in the advancement in infrastructure management techniques through the development of S-LCA charts, which can be useful as an infrastructure monitoring and decision-making tool, for quantifying the structural sustainability and resiliency of built systems. Such a tool would be of great use in aiding infrastructure managers when prescribing maintenance and repair schemes. Moreover, a quantitative, real-time evaluation of structural damage after a disaster would support emergency managers in resource allocation. The manuscript integrates science based modeling and simulation techniques with advanced monitoring and sensing tools, resulting in scientifically defendable, objective and quantitative metrics of sustainability and resiliency to be used in infrastructure management. *
Corresponding author. E-mail:
[email protected]
Keywords: Damage detection, Diagmostic evaluation, Prognostic framework
Dalton, S., Atamturktur, S. and Juang, H.
55
1. Introduction Civil infrastructure ages and deteriorates due to degradation of materials, environmental and location specific issues, overloading and operational factors, inadequate maintenance and inspection schemes, among other reasons. Deteriorating infrastructure is a worldwide problem, particularly in the United States where a significant portion of the civil infrastructure is approaching, or has passed, its original design lifespan (Zhu & Popovics, 2008). The American Society of Civil Engineers (ASCE) conducts an infrastructure assessment every two to four years and creates a report card for the nation’s infrastructure systems. Since 1998, ASCE has categorized the condition of the nation’s civil infrastructure as critical with a grade of D (American Society of Civil Engineers,1998; 2009). In 2009, ASCE estimated that $2.2 trillion is needed over a five-year period to bring the nation’s infrastructure to a good condition (American Society of Civil Engineers, 2009). The need to upgrade the nation’s aging and deteriorating civil infrastructure with constrained budgets poses an enormous challenge to infrastructure managers. Thus, it is not only essential to retrofit and reconstruct existing deteriorating infrastructure systems, but to do so through the use of sustainable infrastructure practices, the purpose of which is to seek maintenance and inspection alternatives that minimize economic and social costs while maximizing the operational life span of such systems. In order to bring infrastructure to this condition, major measures must be taken and society’s views on how to manage and maintain infrastructure will need to change. A paradigm shift towards proactive and sustainable infrastructure management schemes is required. One necessary step in this direction is to equip infrastructure managers with science-based techniques rather than the current qualitative guidelines for monitoring and assessing the nation’s infrastructure. Current inspection practices rely heavily on expert judgment through visual metrics (ASCE/SEI-AASHTO Ad-Hoc Group on Bridge Inspection, Rating, Rehabilitation, and Replacement, 2009). Infrastructure systems such as bridges and buildings are assessed based on qualitative guidelines measured against the healthy state of the system (Stillman, 1992; Schmaltz & Stiemer, 1995; U.S. Department of Transportation, 1995). There is, however, no efficient way of comparing current structural states of a system to the healthy structural state. Because multiple inspectors conduct assessments over the entire lifespan of a structure, a consistent condition baseline is not established over its lifespan. Also, the subjective nature of these guidelines can yield vastly different outcomes when completed by different engineers. Moreover, there is a noticeable lack
56
BUILT 2, 2013
of correlation between visual appearance and structural reliability for safety. Thus, metrics and rubrics have been developed by various government and private sector organizations in an attempt to normalize outcomes by providing key elements and condition ratings for inspectors to utilize when performing inspections. Tables 1 and 2 show two different qualitative inspection metrics for bridges and buildings, respectively (U.S. Department of Transportation, 1995; Applied Technology Council, 1995). It is essential to equip infrastructure managers with effective quantitative, science-based techniques, rather than these qualitative guidelines for monitoring and assessing the true condition of the nation’s infrastructure. Structural Health Monitoring (SHM) is a monitoring system that has been shown to be useful in the diagnosis of structural damage (Farrar & Worden, 2007). SHM tools, if integrated into a structural system during construction, can gather realtime in situ measurements of an infrastructure’s performance over its entire life and reduce maintenance costs by locating structural damage before it becomes debilitating (Enright & Frangopol, 2000). SHM also brings a quantitative metric that, when used properly, can compare current and healthy states to determine the extent of degradation and damage and, moreover, can be applied to predict the lifespan of structural systems. This tool can be used to measure the steady decline in structural functionality, or condition, due to the degrading effects of age and environmental conditions, as well as the severity of damage induced after a disastrous event such as an earthquake, blast, or hurricane. With the ability to quantitatively compare health states, infrastructure managers can easily assess when maintenance is needed, and in the event of a disaster, relay information to emergency managers on severely affected geographical locations needing immediate attention. This research serves as a proof-of-concept study for the application of long-term monitoring of infrastructure systems to gather information not only on the structural functionality of the system, but also its sustainability or resiliency as it ages, degrades, and/or becomes damaged over time. This research focuses on the structural sustainability; however, this approach can be similarly applied to the problem of resiliency. This can be completed through the development of a novel decision making tool called Structural Life Cycle Analysis (S-LCA) charts. In this study, these charts are created using simulated SHM data for a built system as a proof-of-concept; however, the work can be easily extended and applied to data gathered from actual real-time instrumentation. In Section Two, we will explain the background concepts, which apply to the conceptual proof of this research, followed by a description
of the methodology of S-LCA charts and the models employed in conducting this research in Section Three. Section Four presents the results gained from the completion of the study. Finally, Section Five will overview the main findings of this study and discuss lessons learned and plans for future work. 2. Background The following section establishes a theoretical framework, which is categorized by the two distinct topics this research is rooted in: (1) Structural Health Monitoring and (2) Life Cycle Analysis.
2.1 Structural Health Monitoring Structural Health Monitoring (SHM) is the process of observing a structural system over time using periodically spaced measurements in an effort to compare measured data to a priori data of a system. This comparison is then used to gather information on the condition of a system and detect damage (Doebling, Farrar, Prime, and Shevitz, 1996). In this context, damage is defined as changes introduced into a system, which adversely affect the functionality of said system, either currently or in the future. General damage types include changes in geometry, material properties, or support
Table 1. National Bridge Inspection Standards condition ratings (courtesy of US-DOT, printed with permission).
Code Description N
Not Applicable
-
9
Excellent Condition
-
8
Very Good Condition
No problems noted
7
Good Condition
Some minor problems
6
Satisfactory Condition Structural elements show some minor deterioration
5
Fair Condition
All primary structural elements are sound but may have some minor section loss from corrosion, cracking, spalling, or scour
4
Poor Condition
Advanced section loss, deterioration, spalling, or scour
3
Serious Condition
Loss of section, deterioration, spalling, or scour have seriously affected primary structural components. Local failures are possible. Fatigue cracks in steel or shear cracks in concrete may be present.
2
Critical Condition
Advanced deterioration of primary structural elements. Fatigue cracks in steel or shear cracks in concrete may be present or scour may have removed substructure support. Unless closely monitored it may be necessary to close the bridge until corrective action is taken.
1
“Imminent” Failure Condition
Major deterioration or section loss present in critical structural components or obvious vertical or horizontal movement affecting structure stability. Bridge is closed to traffic but corrective action may put back in light service.
0
Failed Condition
Out of service - beyond corrective action. Table 2. Post-disaster building inspection metric (courtesy of ATC-20, printed with permission).
Minor/None
Moderate
Severe
Comments
Collapse or partial collapse
________________
Building or story leaning
________________
Other _______________
________________
Foundations
________________
Roofs, floors (vertical loads)
________________
Columns, pilasters, corbels
________________
Diaphragms, horizontal bracing
________________
Precast connections
________________
Other _______________
________________
Overall Hazards:
Structural Hazards:
Dalton, S., Atamturktur, S. and Juang, H.
57
conditions, such as alterations in boundary conditions or a reduction in the elastic modulus due to cracking or corrosion (Farrar & Worden, 2007; Worden, Farrar, Manson, & Park, 2007; Sohn et al., 2004). The ability to detect damage and prescribe appropriate rehabilitation schemes motivates system managers to utilize SHM. Maintenance and repair costs decrease by employing this long-term monitoring technique, while life-safety is increased. Detecting damage early on reduces the necessity for redundancies, reduces system down-time due to debilitating damage, and alerts officials when systems are unsafe for operation. The basic concept employed in SHM principles is the dependency of a structure’s system responses, or features, to its inherent physical properties and characteristics such as mass, stiffness, and damping. As damage occurs and accumulates, these characteristics are altered as is evident through changes in measured responses of the system. Damage detection, as applied in this research, is possible through the comparison of two system states using supervised learning, where data is available from both a damaged and undamaged system, to measure accumulated damage from a base line healthy state (Farrar & Worden, 2007; Worden, Farrar, Manson & Park, 2007). For long-term SHM, features are periodically extracted and updated to quantify the ability of a structural system to continue to perform its intended function despite unavoidable aging and damage accumulation resulting from operations and environmental exposure. SHM methods to quantify damage are especially useful in Civil Engineering applications where damage can occur in places that are not accessible in typical maintenance and inspection routines. Concrete, in particular, can exhibit fatal internal cracks and rebar corrosion that can go unseen in current visual inspection schemes. SHM has the capability to detect internal flaws and even predict how much useful life remains in a structural system. This is advantageous for infrastructure managers by allowing them to retrofit damaged structural systems before there is external evidence of damage, an indispensable feature for the development of proactive and sustainable maintenance and inspection schemes. Several monitoring campaigns utilizing physicsbased features such as strain, displacement, or acceleration have been successfully completed (Catbas, Grimmelsman, & Aktan, 2000; Jeary, Soarks & DeSouza, 1981; Jeary, Chui & Wong, 2001; Wenzel & Pichler, 2005; Asmussen, 1997; Brownjohn, 2007); however, none have extended monitoring techniques into an infrastructure management framework to develop science-based metrics to both quantify the health and the sustainability and resiliency of a system over its entire life-span.
58
BUILT 2, 2013
2.2 Life Cycle Analysis of Environmental Engineering The Life Cycle Analysis (LCA), as understood in Environmental Engineering, is a cradle–to-grave investigation and evaluation of the environmental, social, and economic impacts of a given product during the production, use, and disposal phases of its life (Scientific Applications International Corporation [SAIC], 2006). LCA follows a product from the collection and extraction of raw materials from the earth to the point where all parts are disposed and returned to the earth (Trusty & Horst, 2003; Kibert, 2005). The purpose of LCA is to serve as a decision making tool by showing the environmental and social tradeoffs between alternative designs or alterations in a product or system in an effort to improve sustainability. Thus, decision makers may choose the least environmentally, economically, and socially burdensome of the available options (Curran, 1996). LCA tools are quite effective in investigating the impacts caused by a product’s existence on a materials, energy, and emissions scale utilizing current LCA frameworks, such as that provided by the US Environmental Protection Agency (LCA 101) (SAIC, 2006) or the International Organization for Standardization (ISO 14040) (International Organization for Standardization, 2006). Although the LCA framework was originally developed to study the rapid depletion of fossil fuels and the concurrent changes in global climate, a great deal of research has been conducted on the life cycle of building products, especially in resource extraction, manufacturing, and construction phases. Several organizations and agencies have created computer software for this comparative analysis tool, which include the National Institute of Standards and Technology’s Building for Environmental and Economic Sustainability (BEES), capable of completing life-cycle assessments of over 230 building products (Lippiatt, 2007), the Athena Institute’s LCA Model, capable of completing a LCA of whole buildings as well as assemblies for new buildings and renovations (Athena Institute, 2010), and Carnegie Mellon University’s Economic Input-Output LCA (EIO-LCA), able to estimate the materials and energy resources required, as well as emissions produced for daily activities in an economy (Carnegie Mellon University Green Design Institute, 2010). There is currently no tool available, however, that can scientifically measure the structural sustainability of a system over its entire operational life, in regard to its measured versus designed performance, rather than on an energy scale. As durability, i.e. the ability of a built system to endure, is a key component in sustainability, along with more common factors such as energy consumption and environmental impact, the design life of structures must be incorporated into current LCA practices and programs for a full cradle-tograve analysis of a built system. Thus, this research aims to
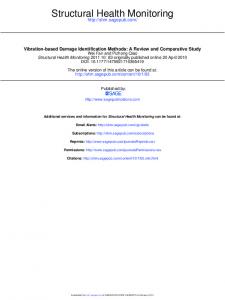
develop a methodology to be incorporated or coupled with the operational life phase of current LCA tools to develop a more holistic operational use phase of the LCA calculation. 3. Methodologies and Model 3.1 Structural Life Cycle Assessment Concept Utilizing the principles and theories discussed above, it is hypothesized that science-based monitoring and assessment techniques can be developed to provide objective and quantitative information about not only the sustainability, but also the resiliency of our built systems. Such tools can aid in the development of the most cost-effective long-term infrastructure management plans and reduce the footprint impact of infrastructure maintenance on energy and materials. For this purpose, this research proposes the construction of Structural Life-Cycle Analysis (S-LCA) charts. The research methodologies and results presented herein aim to provide a framework for the development of such a metric by modifying the existing concepts of LCA to provide a holistic, novel, and quantitative approach for structural assessment based on Structural Health Monitoring techniques. Figure 1 shows a conceptual view of the proposed S-LCA. A built system may be considered 100% structurally functional on the day construction is finished. The degrading
effects of aging over the lifespan of a structure will result in a gradual decrease in structural functionality. The rate at which this reduction occurs depends upon the structural sustainability of the built system (1/α in Figure 1). During disastrous events, the built system experiences structural damage, the effects of which are evident in the life-cycle chart as an immediate drop of the structural functionality curve. The level at which this reduction occurs depends upon the structural resiliency of the built system (1/Δ in Figure 1). It should be noted that in the context of this research, structural sustainability is a measure of the degradation rate, whereas structural resiliency is a measure of the resistance to damage. For given environmental and operational conditions, a sustainable and resilient infrastructure would maximize the area under the curve in Figure 1. In SHM, structural degradation and damage are defined as changes that adversely affect the future performance of a built system (Sohn et al., 2004). Therefore, implicit in the definitions of structural degradation and damage are comparisons against a “reference” system, which often represents the built system in its initial, undamaged condition. We can consider the day the construction is completed as the reference point for new construction. For an existing structure, however, a reference point for structural functionality must be determined according to the current structural condition. In our
* Structural Sustainability is a concept analogous to material durability, but focusing on the performance at the global level of structural behavior. It is a measure of the system’s ability to resist structural degradation.
Figure 1. SHM can enable us to construct Life-Cycle charts for Structural Sustainability and Resiliency of a structural system.
Dalton, S., Atamturktur, S. and Juang, H.
59
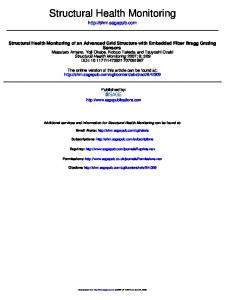
formulation, SHM will monitor the deviations of the structure’s response from these reference points. The structural degradation and damage accumulation will result in changes in the material and/or geometric properties of the structure. Throughout the lifetime of a built system, the stiffness, mass, or energy dissipation of the structure will be altered, which in turn will result in a measurable change in its system responses. This method can alert infrastructure managers when the functionality drops below a certain level, or if the degradation rate becomes too high. Using health indices, a numerical value for a chosen feature (system response), or features, can be transformed into a structural functionality percentage. To do so, mathematically convenient features are desirable, which are not hidden under large measurement or post-processing errors. For example, a feature that can produce false positives, a damaged system identification on a truly healthy system, or false negatives, a more serious error in that a truly damaged system is identified to be healthy, is not preferable. The feature should remain valid over the entire serviceable life of the system, and lastly, the feature must provide a rational transformation to condition of the entirety of the structure (Catbas & Aktan, 2002). A successful implementation of SHM can be established through the utilization of the feature qualities discussed above. 3.2 Prototype Structure For this simulation based proof-of-concept study, a two-story, two-bay, reinforced concrete frame structure was chosen as the prototype. The geometry of the structure is illustrated in Figure 2. A structural design for the frame was completed in accordance to ACI 318-08: Building Code Requirements for Structural Concrete and Commentary Standard, 2008 version (American Concrete Institute, 2008). The columns are assumed to be fixed to the ground and an idealized operational static wind load was applied to the structure as seen in Figure 3, where P is defined as 16 psf.
60
BUILT 2, 2013
Figure 2. Prototype geometry – (a) elevation view (b) plan view.
Column A-1
Column A-2 Column A-3
3.3 Finite Element Formulation Toward the goals outlined in this study, a numerical model of the prototype structure, described in Section 3.2, was developed using the commercial FE modeling package, ANSYS version 13.0. To simulate the complex nonlinear behavior of concrete, Solid65, a solid isoparametric element, is utilized. This particular element is a three-dimensional brick element with eight nodes, each allowing three translational degrees of freedom in the global x, y, and z directions (ANSYS, 2004). As seen in Figure 4, a multilinear constitutive material model based on the triaxial behavior of concrete developed by William and Warnke was used to define the nonlinear material model in the simulation
Column B-1
Column A-1
Figure 3. Prototype loading.
Figure 4. Concrete material model.
of failure (William & Warnke, 1975). With the use of Solid65, the concrete is capable of cracking in three orthogonal directions, plastic deformation, and creep; however, in order to achieve convergence, crushing capabilities were turned off. This element was of particular interest due to the ability to incorporate reinforcement bars directly into the element by assuming a smeared cross-section, thereby increasing the computational efficiency of the simulation. Although smeared, the rebar modeled in Solid 65 is still capable of tension, compression, plastic deformation, and creep.
is idealized into two steps (Bertolini, Elsener, Pedeferri & Polder, 2004; Polder & de Rooij, 2005). The first is an initiation stage, where harmful chlorides penetrate through the solid concrete, eventually reaching the rebar with enough force to initiate corrosion. Here, negligible steel is lost, however, once initiation is reached, the propagation step starts where significant levels of damage are attained (Martin-Perez & Lounis, 2003). It has been proven experimentally that the initiation period for offshore structures can last ten years, at which point the propagation phase begins and corrosion accumulates (Melchers & Li, 2009). One method of modeling the propagation of corrosion is through the loss of cross-sectional area in the rebar due to pitting and rust development. In a study monitoring the corrosion process of a concrete beam over a 17 year period, researchers found an average loss of two percent of the beam’s rebar per year from corrosion after exposure to a chloride rich environment (Vidal, Castel & Francois, 2007). Accordingly, this study assumes an initiation period of 10 years and a subsequent two percent reduction in total cross-sectional area per year of operation.
3.4 Degradation Mechanisms Concrete degradation models are developed to simulate the decrease in structural integrity over a 50 year operational structural lifespan. Herein, the concrete frame is assumed to be located in a marine environment with an average humidity of 70%. With this assumption, it can with good confidence be assumed that corrosion in the concrete frame is inevitable. Therefore, this research will simulate the degrading effects of corrosion while simultaneously modeling the loss of strength due to cracking and general aging. Steel corrosion is one of the predominant mechanisms of degradation in reinforced concrete structures, the driving forces of which are both complex and widely studied (Zhao, Yu & Jin, 2011; Bhargava, Yasuhiro & Ghosh, 2011; Zhong, Gardoni & Rosowsky, 2010). The most commonly accepted corrosion model was developed by Tuutti (Tuutti, 1982) and depicted in Figure 5. Known as a bi-linear damage model, the corrosion process
When concrete degrades, it not only corrodes, but also simultaneously loses strength from cracking caused by tensile pressures induced by corrosion, fatigue loading, shrinkage and expansion due to large changes in temperature, and dissolution in material properties due to aging (Zhao, Yu & Jin, 2011; Bhargava, Yasuhiro, & Ghosh, 2011; Zhong, Gardoni & Rosowsky, 2010). This deterioration in the solid concrete can be captured through an equivalent elastic modulus (Ē) which is found by scaling the healthy design elastic modulus (E) by a damage variable (d) as seen in Figure 6a and expressed in Equation 1 (Hanganu, Oñate & Barbat, 2002). Ē = (1–d)E
Figure 5. Corrosion degradation trends over time. (Source: Tuutti, 1982)
[1]
The damage variable is a function bounded by 0 < d < 1, where a zero value of d represents a healthy structure and a value of one
Dalton, S., Atamturktur, S. and Juang, H.
61
Figure 6. Schematics of solid concrete degradation mechanisms – (a) Degradation trend of elastic modulus (b) Relationship of damage variable d used in the degradation of the elastic modulus over time.
is an unreachable value without complete failure. This research assumes d is an exponential decay function with a mean lifetime of 0.5 resulting in the exponential decay function found in Equation 2. A graphical schematic of the degradation mechanism is provided in Figure 6a.
d = e –2t
[2]
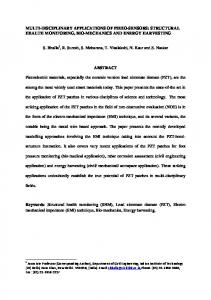
Developed in the stress-strain realm, this relationship must be defined over time bounded by 0 < t < 1. In the absence of a model for concrete that specifies a precise amount of degradation per time unit, an exponential relationship between the degradation variable and time is assumed. An example of this relationship is seen in Figure 6b. In this research, the two aforementioned degradation schemes are applied concurrently to the prototype structure discussed in Section 3.2. Degradation is non-uniform over the entire structure; therefore, the intent is to study the effect and extent of degradation on the Structural Sustainability of a built system and the influence of localization of degradation. The frame is divided into 52 segments as shown in Figure 7. Thirty-five segments are then randomly selected for degradation by corrosive and general degradation forces over a representative 50 years. It should also be noted that exposure to environmental effects is considered when specifying corrosion levels. If we assume the cross-sectional area of rebar in corner columns degrade at a level of two percent
62
BUILT 2, 2013
Figure 7. Schematic of different degradation locations.
annually from surface vulnerabilities due to chemical penetration, then beams, columns, and girders with a single exterior face degrade at a rate of 0.75 times over this maximum two percent rate. Similarly, interior beams are specified to degrade at a rate of 0.5 times that of the corner column’s two percent. The means used to detect the simulated degradation is discussed in the next section. 3.5 Structural Health Monitoring Campaign Maximum lateral displacement is one potential feature commonly used for developing health metrics (Catbas & Aktan, 2002). Since displacement is inversely related to stiffness, which is affected when cracking or corrosion occurs, the displacements should theoretically increase with a decrease in stiffness properties. This feature, which follows the guidelines for feature selection outlined in Section 3.1, will be used to develop health indices in this study.
The vector sum of displacement will be measured at the roof and first floor level of each column (Figure 2b). Due to the asymmetry of the structure, and subsequent twisting that can occur in deformed shapes caused by damage and degradation, the maximum displacement may change location as the ‘effected region’ is spatially varied. Therefore, the maximum lateral displacement on the frame is calculated for each of the 35 degradation scenarios and used in the formulation of S-LCA charts. The SHM process outlined in Figure 8 guides the development of health indices. In this process, a negative discrepancy between the damaged structure’s response (ω) and the healthy reference point (ωR) indicates the structure has been degraded or damaged, while a positive discrepancy indicates an improvement in the structural functionality due to repair or recovery campaigns (Figure 8). This calculation can then be used to provide data to alert infrastructure managers of the health of a system. 4. Results and Discussion First, a health index is developed ranging from 100% functionality (healthy) to an unattainable value of 0% functionality (failure) by normalizing all data to the lateral displacements of the healthy structure. Theoretically, the displacement value of the healthy structure should be the smallest measured value*. Since the relationship between displacement and health is inversely proportional, i.e. displacement increases with a decrease in health, the normalized values must be inverted to obtain a scale in which the healthy displacement value is a maximum
at 100% functionality and functionality is lost as the system degrades or is damaged. When this health index is plotted over the entire lifespan of the structural system, the S-LCA charts proposed in this research materialize. As pictured in Figure 1 and discussed in Section 3.1, Structural Sustainability is a measure of the degradation rate and inversely relates to the slope of the S-LCA curve. The structural sustainability is calculated in ten year increments as defined in Equation 3: Ii (n–1) SS = ∑ –h hi–1 i
[3]
where SS is structural sustainability, Ii is the inspection interval (number of years between health measurements, 10 in this case), n is the number of health measurements taken (including the healthy measurement), hi-1 is the health index value of the previous measurement point, and hi is the health index value at the current measurement point. With this metric, the greater the Structural Sustainability, the more apt you are to maximize the area under the S-LCA curve, after all with a slope of zero, this metric yields a Structural Sustainability value of infinity. Thus, infrastructure managers can compare current and past Structural Sustainability performance. Structural Sustainability values can be periodically updated as more measurements are taken throughout the life of the structure through which the S-LCA chart develops over time.
* This is true unless there is retrofitting, which brings the structure’s condition to a level that exceeds the initial healthy value.
Figure 8. SHM campaign methodology for health monitoring.
Dalton, S., Atamturktur, S. and Juang, H.
63
Year 10
2 segments @10 yr rate
Year 20
5 segments @ 10 yr rate, 2 segments @ 20 yr rate
Year 30
7 segments @ 10 yr rate, 5 segments @20 yr rate, 2 segments @30 yr rate
Year 40
9 segments @ 10 yr rate, 7 segments @ 20 yr rate, 5 segments @ 30 yr rate, 2 segments @ 40 yr rate
Year 50
12 segments @ 10 yr rate, 9 segments @ 20 yr rate, 7 segments @ 30 yr rate, 5 segments @ 20 yr rate, 2 segments @ 50 yr rate
To demonstrate, first, a degradation scheme as outlined in Table 3 is adopted, where segments are sequentially added to the degradation process such that the cumulative effect of aging on the structure increases with time. To account for many possible locations of such structural defects forming, multiple degradation scenarios are simulated where the degradation location varies. Figure 9 shows an ensemble plot of 20 random degradation scenarios, and demonstrates the increase in global degradation with multiple segments simultaneously degraded.
Figure 9. Ensemble figure for 20 random degradation scenarios with multiple segments simultaneously degraded.
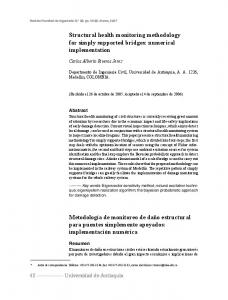
The mean values of the 20 random degradation scenarios, shown in Figure 9 as red boxes, are used to create the final form of the SLCA chart for the concrete frame structure studied herein. The mean response values, plotted against 100% health in Figure 10, were chosen to represent the likely response that the frame structure will experience regardless of the location of degradation. As SHM supplies multiple inspection data at discrete and periodic intervals, the Structural Sustainability can be calculated according to Equation 3 for each interval as shown in Table 4. This produces a quantitative value for the structure’s ability to resist degradation over time and for the structure considered herein, the average Structural Sustainability over the structure’s entire lifespan is calculated to be 196. While Figure 1 idealized what form S-LCA charts might take, Figure 10 illustrates that the degradation rate of a structure might be non-constant over the structure’s entire life. Table 4 shows the evolution of this metric as the structure ages and degradation is accumulated. This chart is not only advantageous when measuring
64
BUILT 2, 2013
Table 3. Degradation scheme for multiple segments degrading simultaneously.
Figure 10. S-LCA chart for multiple segments simultaneously degraded over the structure’s whole life (red line indicates infinite structural sustainability).
Structural Sustainability
Year 0-10
Year 10-20
Year 20-30
Year 30-40
Year 40-50
Average
166
384
193
137
99
196
past performance, but also for prognostic purposes. Through the establishment of degradation trends, infrastructure managers can predict when maintenance will be necessary. 5. Conclusions With aging infrastructure systems in the United States, it has become ever more important to develop indices and metrics to serve as proactive infrastructure management schemes. To mitigate similar circumstances from occurring again, it is necessary
Table 4. Structural Sustainability values over time.
to develop metrics to quantitatively measure the degradation of infrastructures. This will allow rehabilitation to be completed when damage and detectable deterioration occur, not when they become debilitating. Such proactive measures can save vast capital and support sustainable maintenance schemes. By allowing managers to view and quantify a decrease in degradation, they can maximize the area under the S-LCA curve. Thus, this manuscript casts sustainability and resiliency in a quantifiable framework where designs can be compared and implemented accordingly. This research proposes Structural Life Cycle Assessment (S-LCA) charts as a potentially suitable method for quantifying the health and sustainability of an infrastructure system through its entire life cycle via implementation of Structural Health Monitoring practices and Life Cycle Assessment principles. In the proof of concept application studied herein, degradation is simulated in a concrete frame structure through corrosive forces, represented by a loss in cross-sectional area in the steel rebar, and loss of strength, represented through the application of an effective elastic modulus. To apply a realistic degradation scheme and to illustrate the development of the sustainability metric, the sequential addition of degraded members is simulated. Through this method, the time dependent accumulation of degradation is captured with a visual decrease in both the Health Index and the Structural Sustainability metric over time. The results presented herein successfully defend the research hypothesis presented in this paper through a proof-of-concept example. However, because this simulation based study encompassed only factors intentionally introduced to affect the system, possible false diagnostics from ambient factors, which are encountered in operational settings, are not considered. Future research must utilize real-life data from in-situ monitoring systems considering the inherent uncertainties in data collection to improve and expand upon the concepts presented here and validate the applicability of the proposed method to long-term monitoring. Moreover, the robustness of features used in the construction of S-LCA charts should be explored to find those that are least influenced by factors that can cause noise and false diagnostics. Accounting for load fluctuations (such as wind) and changes in temperature and humidity is also necessary before this method can be fully embraced by infrastructure managers. Also, this study only explored the sustainability aspect of S-LCA charts, thus a future study in resiliency to extreme factors should be conducted.
Acknowledgements This material is based upon work supported by the National Science Foundation under Grant No. 1011478. Any opinions, findings, and conclusions or recommendations expressed in the material are those of the author and do not necessarily reflect the views of NSF. The authors thank Godfrey Kimball for his editorial help. References American Concrete Institute. (2008). Building code requirements for structural concrete and commentary (ACI 318-08). Farmington Hills, Michigan, MI: Author. American Society of Civil Engineers [ASCE]. (1998). 1998 Report Card for America’s Infrastructure. Reston, Virginia, VA: Author. American Society of Civil Engineers [ASCE]. (2009). 2009 Report Card for America’s Infrastructure. Reston, Virginia, VA: Author. ANSYS, Inc. (2004). Theory reference for ANSYS and ANSYS Workbench. Canonsburg, PA: Author. Applied Technology Council [ATC]. (1995). ATC-20 Set procedures for post earthquake safety evaluation of buildings & addendum. California, CA: Author. ASCE/SEI-AASHTO Ad-Hoc Group on Bridge Inspection, Rating, Rehabilitation and Replacement. (2009). White paper on bridge inspection and rating. Journal of Bridge Engineering, 14(1), 1-5. Asmussen, J. C. (1997). Modal analysis based on the random decrement technique – application to civil engineering structures. Ph.D. Thesis. Department of Building Technology and Structural Engineering, University of Aalborg, Denmark. Athena Institute. (2010). LCA Model. Retrieved from http://www.athenasmi.org/about/lcaModel.html Bertolini, L., Elsener, B., Pedeferri, P. & Polder R. (2004). Corrosion of steel in concrete. Weinheim, Germany: Wiley-VCH. Bhargava, K., Mori, Y., & Ghosh, A. K. (2011). Time-dependent Reliability of Corrosion-affected RC Beams – Part 1: Estimation of time-dependent strengths and associated variability. Nuclear Engineering and Design, 241(5), 1371-1384. Brownjohn, J. M. (2007). Structural health monitoring of civil infrastructure. Philosophical Transactions of the Royal Society, 365, 589-622. Carnegie Mellon University Green Design Institute. (2010). Economic input-output life cycle assessment. Retrieved from http://www.eiolca.net/
Dalton, S., Atamturktur, S. and Juang, H.
65
Catbas, F. N. & Aktan, A. E. (2002). Condition and damage assessment: Issues and some promising indices. Journal of Structural Engineering, 128(8), 1026-1036. Catbas, F. N., Grimmelsman, K. A. & Aktan, A. E. (2000). Structural identification of the commodore barry bridge. Proceeding of SPIE 3995, Nondestructive Evaluation of Highways, Utilities and Pipelines IV (pp. 84-97). Newport Beach, CA: SPIE. Curran, M. A. (1996). Environmental life-cycle assessment. New York, NY: McGraw Hill. Doebling, S. W., Farrar, C. R., Prime, M. B. & Shevitz, D. W. (1996). Damage identification and health monitoring of structural and mechanical systems from changes in their vibration characteristics: A literature review (Rep. No. LA-13070-MS). Los Alamos, New Mexico, NM: Los Alamos National Laboratory, University of California. Enright, M. P. & Frangopol, D. M. (2000). Reliability based lifetime maintenance of aging highway bridges. Proceedings of SPIE 3995, Nondestructive Evaluation of Highways, Utilities and Pipelines IV (pp. 4-13). Newport Beach, CA: SPIE. Farrar, C.R. & Worden, K. (2007). An introduction to structural health monitoring. Philosophical Transactions of the Royal Society A, 365, 303-315. Hanganu, A. D., Oñate, E. & Barbat, A. H. (2002). A finite element methodology for local/global damage evaluation in civil engineering structures. Computers and Structures, 80, 1667-1687. International Organization for Standardization. (2006). Environmental management - life cycle assessment principles and framework (Rep. no. ISO 14040:2006(E)) (2nd ed.). Switzerland: Author. Jeary, A. P., Chui, G. C. & Wong, J. C. K. (2001). Wholistic structural appraisal. Proceedings from the 8th Interna tional Conference and Structural Safety and Reliability: ICOSSAR 200. Jeary, A. P., Soarks, P. R. & DeSouza, V. C. M. (1981). A study on the use of ambient vibration measurements to detect changes in the structural characteristics of a building. Proceedings from ASCE EMD Specialty Conference – Dynamic Response of Structures (pp. 189 199). GA: Atlanta. Kibert, J. (2005). Sustainable construction: Green building design and delivery. Hoboken, NJ: John Wiley & Sons. Lippiatt, B. C. (2007). BEES 4.0: Building for environmental and economic sustainability technical manual and user guide (Rep. no. NISTIR 7423). Gaithersburg, MD: National Institute of Standards and Technology.
66
BUILT 2, 2013
Martin-Perez, B. & Lounis, Z. (2003). Numerical modelling of service life of reinforced concrete structures. Proceedings of the 2nd International RILEM Workshop on Life Prediction and Aging Management (pp. 71-79). Paris, France. Melchers, R. E. & Li, C. Q. (2009). Reinforcement corrosion initiation and activation times in concrete structures exposed to severe marine environments. Cement and Concrete Research, 39, 1068-1076. Polder, R. B. & de Rooij, M. R. (2005). Durability of marine concrete structures—Field investigations and modelling. Heron, 50(3), 133-153. Schmaltz, T. C. & Stiemer, S. F. (1995). Consideration of design life of structures. Journal of Performance of Constructed Facilities, 9(3), 206-219. Scientific Applications International Corporation [SAIC]. (2006). Life cycle assessment: Principles and practice (Rep. no. 68-C02-067). Cincinnati, Ohio: National Risk Management Research Laboratory, Office of Research and Development, U.S. Environmental Protection Agency. Sohn, H., Farrar, C. R., Hemez, F. M., Shunk, D. D., Stinemates, D. W., Nadler, B.R. & Czarnecki, J. J. (2004). A review of structural health monitoring literature: 1996-2001 (Rep. No. LA-13976-MS). Los Alamos, New Mexico, NM: Los Alamos National Laboratory, University of California. Stillman, J. (1992). Design life and the new code. In Somerville, G., Blackie and Son Ltd (Eds.), The design life of structures. Glasgow, NZ: Spon Press. Trusty, W. B. & Horst, S. (2003). Integrating LCA tools in green building rating systems. The Athena Institute. Retrieved from http://www.athenasmi.ca Tuutti, K. (1982). Corrosion of steel in concrete. CBI Research Report, 4(82), pp.17-21. Stickholm: Swedish Cement and Concrete Research Institute. U.S. Department of Transportation. (1995). Recording and coding guide for the structure inventory and appraisal of the nation’s bridges (Rep. No. FHWA-PD-96-001). Washinghton, DC: Office of Engineering Bridge Division. Vidal, T., Castel, A. & Francois, R. (2007). Corrosion process and structural performance of a 17 year old reinforced concrete beam stored in chloride environment. Cement and Concrete Research, 37(11), 1551-1561. Wenzel, H. & Pichler, D. (2005). Ambient vibration monitoring. Chichester, UK: John Wiley & Sons. William, K. J. & Warnke, E.D. (1975). Constitutive model for the triaxial behaviour of concrete. Proceedings of the International Association for Bridge and Structural Engineering, 19 (p.174). Bergamo, Italy: ISMES.
Worden, K., Farrar, C. R., Manson, G. & Park, G. (2007). The fundamental axioms of structural health monitoring. Proceedings of the Royal Society A: Mathematical, Physical and Engineering Sciences (pp. 1639-1664). London: Royal Society Publishing. Zhao, Y., Yu, J. & Jin, W. (2011). Damage analysis and cracking model of reinforced concrete structures with rebar corrosion. Corrosion Science, 53(10), 3388-3397. Zhong, J. Q., Gardoni, P. & Rosowsky, D. (2010). Stiffness degradation and time cracking of cover concrete in reinforced concrete structures subject to corrosion. Journal of Engineering Mechanics, 136(2), 209-219. Zhu, J. & Popovics, J. S. (2008). Non-contact NDT of concrete structures using air coupled sensors. Chicago, Illinois: Newark Structural Engineering Laboratory, University of Illinois at Urbana-Champaign.
Dalton, S., Atamturktur, S. and Juang, H.
67
68
BUILT 2, 2013