materials Article
Structural, Morphological, Optical and Photocatalytic Properties of Y, N-Doped and Codoped TiO2 Thin Films Zeineb Hamden 1 , David Conceição 2 , Sami Boufi 3 , Luís Filipe Vieira Ferreira 2, * and Soraa Bouattour 1, * 1 2
3
*
Faculty of Science, LCI, University of Sfax, BP1171-3018 Sfax, Tunisia;
[email protected] Centro de Química-Física Molecular and Institute of Nanoscience and Nanotechnology, Instituto Superior Técnico, University of Lisbon, 1049-001 Lisbon, Portugal;
[email protected] Faculty of Science, LSME, University of Sfax, BP1171-3018 Sfax, Tunisia;
[email protected] Correspondence:
[email protected] (L.F.V.F.);
[email protected] (S.B.); Tel.: +351-21-841-9252 (L.F.V.F.); +216-98-660-535 (S.B.)
Academic Editor: Klara Hernadi Received: 11 April 2017; Accepted: 25 May 2017; Published: 31 May 2017
Abstract: Pure TiO2 , Y-N single-doped and codoped TiO2 powders and thin films deposited on glass beads were successfully prepared using dip-coating and sol-gel methods. The samples were analyzed using grazing angle X-ray diffraction (GXRD), Raman spectroscopy, time resolved luminescence, ground state diffuse reflectance absorption and scanning electron microscopy (SEM). According to the GXRD patterns and micro-Raman spectra, only the anatase form of TiO2 was made evident. Ground state diffuse reflectance absorption studies showed that doping with N or codoping with N and Y led to an increase of the band gap. Laser induced luminescence analysis revealed a decrease in the recombination rate of the photogenerated holes and electrons. The photocatalytic activity of supported catalysts, toward the degradation of toluidine, revealed a meaningful enhancement upon codoping samples at a level of 2% (atomic ratio). The photocatalytic activity of the material and its reactivity can be attributed to a reduced, but significant, direct photoexcitation of the semiconductor by the halogen lamp, together with a charge-transfer-complex mechanism, or with the formation of surface oxygen vacancies by the N dopant atoms. Keywords: titanium dioxide; photochemistry; band-gap engineering; photocatalysis
1. Introduction Nowadays, organic pollutants produced by some industries are harmful to human health and living creatures. Owing to the urgent need for a clean and comfortable environment, photocatalysis offers great potential for the elimination of toxic chemicals in the environment through its efficiency and broad applicability. Among many semiconductors and photocatalysts, titanium dioxide TiO2 , in the form of thin films, powders or nanostructured layers, is close to be an ideal bench mark photocatalyst in the environmental photocatalysis applications, due to its many desirable properties such as inexpensive, readily available, biologically and chemically inert, and good photoactivity [1,2]. However, the application of TiO2 is limited by problems associated with the fast charge (electron/hole) recombination phenomenon, and the band gap belonging to the UV region, since the absorption behavior and the separation efficiency of electron–hole pairs are two essential factors on which the photodegradation of TiO2 strongly depends [3]. Thus, several approaches have been used in order to overcome these difficulties,
Materials 2017, 10, 600; doi:10.3390/ma10060600
www.mdpi.com/journal/materials
Materials 2017, 10, 600
2 of 13
including doping with other species [4,5]. Between many chemical elements used as dopants for TiO2 , rare earth elements such as (Y, Eu, Er, Nd . . . ) have been widely studied [6,7]. Doping TiO2 with rare earth elements is employed to enhance the photochemical activity regarding degradation of organic pollutants in aqueous media and to shift the irradiation wavelength from the UV to the visible range. Narayan et al. [8] have studied the effect of rare earth (Y, Yb, Gd) ions on TiO2 properties using a co-precipitation/hydrolysis method and its photocatalytic activity was evaluated for the degradation of Congo red under visible light irradiation. They demonstrated that Y modified TiO2 provided the best photocatalytic activity due to the smaller particle size of photocatalyst and effective separation of electron–hole pairs. Wang et al. [9] synthesized also yttrium doped TiO2 through the sol–gel method and reported that Y-TiO2 has about 1.50 times greater photocatalytic activity compared to undoped TiO2 for the methyl orange degradation. Moreover, in a previous research work, Bouattour et al. [10], studied the photocatalytic activity of nanopowders of yttrium doped titania using sol–gel, solid state process, and 2-naphthol as a pollutant model, under sunlight irradiation. Results showed a great enhancement of the photocatalytic efficiency with the incorporation of Y in samples prepared by solid grinding. Kallel et al. [11] has studied Rb-Y codoped TiO2 . They demonstrated that, according to the XPS and XRD analysis, the Y3+ dopant did not enter the TiO2 crystal lattice to substitute for Ti4+ . It was dispersed uniformly onto TiO2 nanoparticles. Wu et al. [12] concluded in their studies that the incorporation of interstitial boron dopants would create oxygen vacancies (Ov¨) and reduce Ti4+ to Ti3+ to form the [Ov¨-Ti3+ ]+ complex, which would then trap the excited charge carriers and prolong carrier lifetime. Moreover, Y3+ ions could also trap the photo-excited electrons to form Y2+ ions, which would then react with the absorbed O2 on TiO2 surface to generate reactive species. On the other hand, research on the incorporation of non-metal ions (N, C, S, F) into TiO2 has increased since few years [13], for the reason that doping with these atoms can largely enhance the photoactivity efficiency of TiO2 . However, there are still many controversies on the modification of TiO2 by these species, especially the nitrogen, since different hypotheses concerning the state of nitrogen in the N-TiO2 lattice and the mechanism of band gap modification have been derived. For example, Asahi et al. [4] proposed that substitutional-type doping using N was effective for the band gap narrowing of TiO2 due to the mixing of N 2p with O 2p states in the valence band based on spin-restricted local density approximation calculations on the anatase phase. However, Irie et al. [14] confirmed that interstitial-type doping of N atoms was related to the photothreshold energy decrease, which induced localized N 2p states within the band gap just above the top of the valence band, facilitating the production of oxygen vacancies. A third research group suggest that the band edge narrowing can occur when doping levels reach a critical concentration that exceeds 20% in anatase TiO2 [13]. From the above-mentioned references, it appears that the effect of dopants on the structural properties and the photocatalytic activity of TiO2 is a complex problem that depends not only on the dopant nature but also on the preparative procedure of the materials and the pollutant to degrade. Thus, we have considered that studying codoped TiO2 thin films with N as one of the dopants should be interesting to try to identify the effect of the each dopant on the properties and TiO2 performance. In this context, we have prepared a series of Li-, N-doped and Li-N codoped TiO2 thin films and powders [15]. We have demonstrated that the energy gap increases and the electron/hole recombinations are delayed for all the samples. An Li-N codoped sample exhibits interesting photoactivity compared to undoped and Li-N monodoped TiO2 under visible light irradiation using aromatic amines as pollutants models. In the present work, Y-N doped or codoped titania thin films with controlled composition were prepared by the sol-gel process using the dip-coating method. The effect of Y and N dopants on the structure and the phase stability was studied by X-ray diffraction and Raman spectroscopy. The efficiency of these samples as photocatalysts was investigated for the degradation of toluidine as organic compound models under a halogen lamp used as an irradiation source.
Materials 2017, 10, 600 Materials 2017, 10, 600
3 of 13 3 of 13
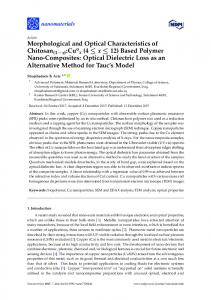
2. Results and Discussion 2. Results and Discussion 2.1. SEM Analysis 2.1. SEM Analysis Surface morphology of pure TiO2 , single doped and Y-N codoped TiO2 thin film, calcined at morphology pureThe TiOundoped 2, single doped and Y-N codoped TiO2 thin film, calcined at 400 °C, 400 ◦ C,Surface is shown in Figure of 1a–d. and N doped TiO2 was already fully characterized [14]. is shown in Figure 1a–d. The undoped and N doped TiO2 was already fullyand characterized [14]. As As can be seen from these FE-SEM micrographs, relatively dense, uniform, nano-granular film can be seen from these FE-SEM micrographs, relatively dense, uniform, and nano-granular film was was obtained for all samples. Higher magnification revealed a nanostructured films composed with obtained for all samples. Higher magnification revealed a nanostructured films composed with relatively uniform shape nanoparticles with average grain size between 20 and 30 nm as estimated relatively uniform shape nanoparticles with average grain size between 20 and 30 nm as estimated from scratched film (see inset Figure 1d). The thickness of film was in the range of 300–500 nm as from scratched film (see inset Figure 1d). The thickness of film was in the range of 300–500 nm as estimated from the edge as shown in Figure 1d. estimated from the edge as shown in Figure 1d.
Figure 1. FE-SEM images of: (a) undoped TiO2 (b): 2% N dopedTiO2 (c): 2% Y doped TiO2 and (d): 2% Figure 1. FE-SEM images of: (a) undoped TiO (b): 2% N dopedTiO2 (c): 2% Y doped TiO2 and (d): 2% Y-N codoped TiO 2 thin films annealed at 4002°C. Y-N codoped TiO2 thin films annealed at 400 ◦ C.
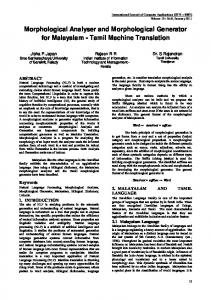
2.2. GXRD Characterization 2.2. GXRD Characterization Grazing angle X-ray diffraction (GXRD) was carried out to investigate the effect of nitrogen and Grazing angle diffraction (GXRD) carried outthe to investigate the of effect of nitrogen yttrium doping onX-ray the crystal structure of TiO2was . Figure 2 shows GXRD patterns undoped TiO2, and yttrium doping onY-N the TiO crystal structure of TiO2at. Figure shows the patterns, GXRD patterns of undoped N-TiO 2, Y-TiO 2, and 2 thin films calcined 400 °C.2From these it is clear that the diffractogram recorded forY-N the undoped 2, is slightly thatFrom of TiO 2 doped with 2% TiO TiO2 thinTiO films calcinedsimilar at 400to◦ C. these patterns, it N. is For clear 2 , N-TiO2 , Y-TiO 2 , and both, only one weak reflection associated to the anatase phase was observed, indicating their low that the diffractogram recorded for the undoped TiO2 , is slightly similar to that of TiO2 doped with Y asassociated dopant improves the crystallinity TiO2. Indeed, five 2%crystallinity. N. For both,However, only one introducing weak reflection to the anatase phase wasofobserved, indicating reflections are observed for Y-TiO 2, 2% Y-N 2 and 4% Y-N TiO 2 samples. Theyofappear at 2θ their low crystallinity. However, introducing Y TiO as dopant improves the crystallinity TiO2 . Indeed, values: 25.3°, are 37.9°, 48.03°, 53.9°, 55.1°2 and corresponding to the (101), (004), (200), (105), (211) five reflections observed for Y-TiO , 2%62.7°, Y-N TiO 2 and 4% Y-N TiO2 samples. They appear at 2θ ◦ ◦ ◦ ◦ ◦ ◦ and (204) planes, respectively. All of them are associated to the anatase phase.(004), No reflection related values: 25.3 , 37.9 , 48.03 , 53.9 , 55.1 and 62.7 , corresponding to the (101), (200), (105), (211) to (204) a secondary due to YAll or of N dopants distinguished. This resultphase. is in agreement with related those and planes,phase respectively. them areisassociated to the anatase No reflection by Khan and Cao Zhang etisal.distinguished. [17], showing that theisanatase phase iswith obtained to reported a secondary phase due to[16] Y orand N dopants Thisonly result in agreement those for TiO2 powders doped TiO2 using various Y concentrations. On the other hand, a careful analysis
Materials 2017, 10, 600
4 of 13
reported by Khan and Cao [16] and Zhang et al. [17], showing that only the anatase phase is obtained Materials 2017, 10, 600 4 of 13 for TiO 2 powders doped TiO2 using various Y concentrations. On the other hand, a careful analysis of the GXRD patterns reveal a slight refection broadening with increasing Y-doping concentration, of the GXRD patterns reveal a slight refection broadening with increasing Y-doping concentration, suggesting a systematic decrease in the grain size. Applying Scherrer formula [18] and taking into suggesting a systematic decrease in the grain size. Applying Scherrer formula [18] and taking into account the full width at half maximum (FWHM) for the (101) reflection, typical values of crystallite account width at half maximum (FWHM) for the (101) reflection, typical values of crystallite Materials the 2017,full 10, 600 4 of 13 sizes sizes are calculated from XRD patterns (Figure 2). The average sizes of 2% Y doped TiO , 2% Y-N are calculated from XRD patterns (Figure 2). The average sizes of 2% Y doped TiO2,2 2% Y-N ◦ codoped TiO and 4% Y-N codoped TiO particles, calcinated at 400 C, are found to be 18, 16 and 2TiO2 and 2 2 particles, of the GXRD patterns reveal a slight TiO refection broadening with increasing codoped 4% Y-N codoped calcinated at 400 °C,Y-doping are foundconcentration, to be 18, 16 and 14 3+ 14 nm,nm, demonstrating that doping TiO with YY3+size. or contributed tolowering lowering thesize sizetaking theinto crystallite, suggesting a systematic decrease in2 the grain Applying Scherrer formula [18] and demonstrating that doping TiO 2 with or N N contributed to the ofofthe crystallite, account the fullthe width halfof maximum (FWHM)Furthermore, for the (101) reflection, typical values of crystallite therefore inhibiting growth TiO ititisisworth to that thepresence presenceofof 2 particle. therefore inhibiting theatgrowth of TiO 2 particle. Furthermore, worth to note note that the sizes are calculated from XRD patterns (Figure 2). The average sizes of 2% Y doped TiO 2, 2% Y-N Y enhanced the crystallization of the TiO phase. However, it is important to be precise thatthese these Y enhanced the crystallization of the TiO be precise that 2 2 phase. However, it is important codoped TiO2 and 4% Y-N codoped TiO2 particles, calcinated at 400 °C, are found to be 18, 16 and 14 two factors: the presence of anatase phase and decreaseofofparticles particles nanosize nanosize are two factors: the presence of anatase phase and thethe decrease are favorable favorabletotothe the nm, demonstrating that doping TiO2 with Y3+ or N contributed to lowering the size of the crystallite, photocatalytic activity. photocatalytic activity. therefore inhibiting the growth of TiO2 particle. Furthermore, it is worth to note that the presence of Y enhanced the crystallization of the TiO2 phase. However, it is important to be precise that these (101) two factors: the presence of anatase phase and the decrease of particles nanosize are favorable to the : Anatase photocatalytic activity. (004)
(101)
TiO2+4%Y-N
(200)
(105) (211)
(204)
: Anatase
Intensity (a.u.) Intensity (a.u.)
TiO +2%Y-N
(004)
2 TiO2+4%Y-N
(200)
(105) (211)
(204)
TiO2+2%Y
TiO2+2%Y-N
TiO2 +2%N
TiO2+2%Y
TiO2Undoped +2%N TiO2
20
30
40
50
60 TiO Undoped 2
70
2θ (°) 20
30
40
50
60
70
2 and 2%, 4% Y and/or N doped TiO2 thin films annealed 2. GXRD patterns of undoped the undoped FigureFigure 2. GXRD patterns of the TiOTiO 2 and 2θ (°)2%, 4% Y and/or N doped TiO2 thin films annealed at◦ 400 °C. at 400 C.
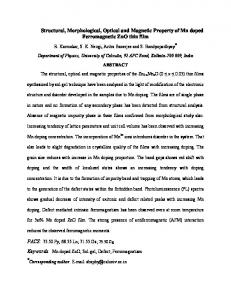
Figure 2. GXRD patterns of the undoped TiO2 and 2%, 4% Y and/or N doped TiO2 thin films annealed at 400 °C. Figure 3 shows the GXRD patterns of 2% Y-N codoped TiO2 thin film calcined at
different
Figure 3 shows the of 2% Y-N codoped calcined at different 2 thinatfilm temperatures. Only theGXRD anatasepatterns phase is observed for the samplesTiO calcined 500 °C, 550 °C and 650 °C. ◦ C and Figure 3 shows the GXRD patterns of 2% Y-Nfor codoped TiO2 thincalcined film calcined at ◦different temperatures. Only the anatase phase is observed the samples at 500 C, This result suggests that the typical anatase-rutile phase transformation [19] is delayed550 to higher temperatures. Only the anatase phase is observed for the samples calcined at 500 °C, 550 °C and 650 °C. 650 ◦ C. This resultThe suggests that theistypical anatase-rutile transformation [19] ions is delayed temperature. anatase phase probably stabilized by phase the surrounding earth throughto This result suggests that the typical anatase-rutile phase transformation [19] is rare delayed to higher higher temperature. The anatase phase is probably stabilized by the surrounding rare earth ions the formation of Ti-O-rare earth bonds [20]. temperature. The anatase phase is probably stabilized by the surrounding rare earth ions through throughthe the formation of Ti-O-rare earth bonds [20]. formation of Ti-O-rare earth bonds [20]. : :
(101) (101)
Anatase
Anatase
Intensity Intensity(a.u.) (a.u.)
(004) (200)(200) (105)(211)
(004)
650°C
650°C (105)(211) (204) (204) (110)(220)(215) (215) (110)(220)
550°C550°C 500°C500°C 10 10
20 20
3030
40 40
50 50
60 60 70
70 80
80
2 2 Figure 3. GXRD patterns of the 2% Y-N codoped TiO2 thin films annealed at different temperature.
Figure 3. GXRD patterns of the codoped TiO 2 thin filmsannealed annealed at at different different temperature. Figure 3. GXRD patterns of the 2% 2% Y-NY-N codoped TiO films temperature. 2 thin
Materials 2017, 10, 600
5 of 13
Materials 2017, 10, 600
5 of 13
2.3. Raman Spectroscopy 2.3. Raman Spectroscopy The structural characteristics and phase composition of the samples were further investigated by The structural characteristics and phase composition of the samples were further investigated micro-Raman spectroscopy. Figure 4a,b shows the Raman spectra of undoped TiO2 and Y-N-doped by micro-Raman spectroscopy. Figure 4a,b shows the Raman spectra of undoped TiO2 and or codoped TiO2 , films and powders, respectively. Only the anatase phase, which is characterized Y-N-doped or codoped TiO2, films and powders, respectively. Only the anatase phase, which is by six Raman active modes (A1g + 2B1g + 3Eg) [21], is observed for all samples. The dominant Eg characterized by six−1Raman active modes (A1g + 2B1g + 3Eg) [21], is observed for all samples. The observed at 144 cm is associated with the Ti-O bending vibration. It is also attributed to the two −1 is associated with the Ti-O bending vibration. It is also attributed dominant Eg observed at 144 − cm 1 weak bands at 197 and 638 cm . However, B1g and the (A1g + B1g ) bands are shown around 395 cm−1 to the two weak bands at 197 and 638 cm−1. However, B1g and the (A1g + B1g) bands are shown around − 1 and 517−1cm , respectively. Furthermore, data in Figure 4a indicated a Raman band broadening for −1 395 cm and 517 cm , respectively. Furthermore, data in Figure 4a indicated a Raman band Y-N codoped TiO2 . These results can be ascribed to phonon confinement and surface strain effects, broadening for Y-N codoped TiO2. These results can be ascribed to phonon confinement and surface usually observed in nanostructured materials [22]. These outcomes are in good agreement with values strain effects, usually observed in nanostructured materials [22]. These outcomes are in good of crystallite size determined using Scherrer’s formula and XRD studies. agreement with values of crystallite size determined using Scherrer’s formula and XRD studies.
b)
a)
145
TiO2 + 4% Y-N
TiO2 + 2% Y-N 638
TiO2 + 2% Y
TiO2 + 2% N
TiO2 undoped
TiO2 + 2% Y-N
Raman Intensity (a.u.)
517
Ram an Intensity (a.u.)
397
TiO2 +2%Y
TiO2 + 2% N
144 395
200
300
400
500
-1 Wavenumber cm
600
700
200
300
400
TiO2 undoped 638 517
500
600
Wavenumber cm-1
700
Figure 4. 4. Raman doped and and codoped codoped TiO TiO22 thin Figure Raman spectra spectra of of undoped undoped and and 2% 2% Y-N Y-N doped thin films films (a) (a) and and powder powder ◦ (b) annealed annealed at at 400 400 °C. (b) C.
Additionally, micro-Raman analyses for the nanopowders in Figure 4b show that the Additionally, micro-Raman analyses for the nanopowders in Figure 4b show that the introduction introduction of N decreases the anatase crystallinity by means of a broadening effect mainly of N decreases the anatase crystallinity by means of a broadening effect mainly observed on the 395, observed on the 395, 517 and 638 cm−1 peaks of the Raman signal. The anatase structure is greatly 517 and 638 cm−1 peaks of the Raman signal. The anatase structure is greatly affected by the codoping affected by the codoping with 2% Y-N and 4% Y-N, and it does not change with the introduction of with 2% Y-N and 4% Y-N, and it does not change with the introduction of Yttrium as a single dopant. Yttrium as a single dopant. 2.4. Ground State Diffuse Reflectance Spectra 2.4. Ground State Diffuse Reflectance Spectra In Figure 5, one can see the ground state diffuse reflectance spectra of samples with different In Figure 5, one cannanoparticles see the ground state were diffuse reflectance of samples with different dopants. TiO2 undoped spectra also included spectra for comparison. A significant tail dopants. TiO 2 undoped nanoparticles spectra were also included for comparison. A significant tail was observed in all diffuse reflectance spectra, reaching the visible range of wavelengths. The cut-off was observedwere in allobtained diffuse reflectance spectra, of reaching the visibleextrapolations range of wavelengths. cut-off wavelengths via the intersection the straight-line below andThe above the wavelengths were obtained via the intersection of the straight-line extrapolations below and above small photon energy knee, in the Tauc plots from the curves presented in Figure 5a, which provided the gap small photon energy knee, in inTable the Tauc plots5bfrom the the curves presented in band Figure 5a,energies which the energy values presented 1. Figure presents calculation of the gap provided gappure energy presented in Table 1. Figure 5b presents the calculation of the band in the casethe of the TiOvalues 2 and TiO2 + N samples. gap energies in the case of the pure TiO2 and TiO2 + N samples.
Materials 2017, 10, 600
6 of 13
Materials 2017, 10, 600
6 of 13
Figure 5. (a) ground-state diffuse reflectance absorption spectra of undoped, doped and codoped Figure 5. (a) ground-state diffuse reflectance absorption spectra of undoped, doped and codoped TiO2 TiO2 with N and Y, annealed at ◦400 °C; (b) Tauc plots of pure and N-doped TiO2 samples, evidencing with N and Y, annealed at 400 C; (b) Tauc plots of pure and N-doped TiO2 samples, evidencing the the calculation of the band gap energies for these two samples. calculation of the band gap energies for these two samples. Table 1. Energy gaps and λabs for TiO2 undoped, doped and codoped with N and Y. Table 1. Energy gaps and λabs for TiO2 undoped, doped and codoped with N and Y.
Sample Sample Undoped TiO2 Undoped N dopedTiO2 doped 2% YNdoped 2% Y doped 2%2% Y-N codoped Y-N codoped 4%4% Y-N codoped Y-N codoped
λabs (nm) Eg (ev) Eg (ev) 396 3.13 396 3.13 392 3.17 392 3.17 400 3.10 400 3.10 385 385 3.223.22 396 396 3.133.13
λabs (nm)
Ground the nanopowders show that, while thethe N Groundstate statediffuse diffusereflectance reflectanceabsorption absorptionstudies studiesfor for the nanopowders show that, while dopant causes deviations of of thethe band gap N dopant causes deviations band gaptotohigher higherenergies, energies,doping dopingTiO TiO2 2with withYY suggests suggests the the opposite effect. Indeed, the value of energy gap ∆E increased from 3.13 eV (undoped) to about 3.16 opposite effect. Indeed, the value of energy gap ∆E increased from 3.13 eV (undoped) to about 3.16 eV eV in TiO 2 doped with N and to 3.22 eV with 2% Y-N, and it reached 3.13 eV for 4% Y-N (Table 1). in TiO2 doped with N and to 3.22 eV with 2% Y-N, and it reached 3.13 eV for 4% Y-N (Table 1). On the On thehand, otherwith hand, 2% Y ∆E dopant, ∆E decreased 3.10 eV,that showing that Yttrium shifts the other 2%with Y dopant, decreased to 3.10 eV,toshowing Yttrium shifts the wavelength wavelength absorption range to higher values and this also explains the difference between absorption range to higher values and this also explains the difference between 2% Y-N and2% 4% Y-N Y-N. and 4% Y-N. The same trend was found in the work of Zhao and co-workers [23], which showed that The same trend was found in the work of Zhao and co-workers [23], which showed that Y-doping Y-doping also induced a red shift of the absorption edge. Concretely, the absorption threshold also induced a red shift of the absorption edge. Concretely, the absorption threshold shifted from shifted from 395 nm (undoped) to 405 nm (3% Y-TiO2). The most probable reason was that Y doping 395 nm (undoped) to 405 nm (3% Y-TiO2 ). The most probable reason was that Y doping induced a induced a part of the Y 4d states to extend into the TiO2 conduction band, resulting in a narrowing of part of the Y 4d states to extend into the TiO2 conduction band, resulting in a narrowing of the band the band gap of anatase. Therefore, these results suggest that the introduction of these two elements gap of anatase. Therefore, these results suggest that the introduction of these two elements (N, Y) can (N, Y) can modify the optical behavior of the material in different ways, presumably due to opposite modify the optical behavior of the material in different ways, presumably due to opposite functions functions related with the modification of the energy band gap and/or the creation of surface traps related with the modification of the energy band gap and/or the creation of surface traps for the for the semiconductor’s charge carriers. semiconductor’s charge carriers. 2.5. 2.5. Laser LaserInduced InducedLuminescence LuminescenceStudies Studies Figure spectra (λ (λexc exc = Figure 6a–e 6a–e shows shows the the laser laser induced induced luminescence luminescence spectra =337 337nm, nm, ~1.3 ~1.3mJ mJper perexcitation excitation pulse), at 77 K of the powdered samples. The initial curve was obtained immediately after pulse), at 77 K of the powdered samples. The initial curve was obtained immediately after laser laser pulse, pulse, and and the the other other curves curves are are separated separated by by steps steps of of 20 20 ns. ns. The The used used time time gate gate width width was was one one microsecond. 2 is is presented in Figure 6a, with a microsecond.The Thelaser laserinduced inducedemission emissionspectra spectraofofundoped undopedTiO TiO presented in Figure 6a, with 2 maximum at 520 nm. It exhibits a decay with a lifetime of aproximately 59 ns. This luminescent a maximum at 520 nm. It exhibits a decay with a lifetime of aproximately 59 ns. This luminescent emission is attributed attributedtoto typical well-known luminescent of anatase. This emission is thethe typical andand well-known greengreen luminescent band ofband anatase. This emission emission occurs due to the recombination of thecharge excited chargethe carriers, theand electron and hole occurs due to the recombination of the excited carriers, electron hole pair, frompair, trap from trap states located either at the surface or within the bulk phase of the crystalline material [24]. states located either at the surface or within the bulk phase of the crystalline material [24]. Figure 6b Figure 6b presents the luminescence spectra of TiO2, doped with N. The fluorescence lifetime of the sample changes, increasing to approximately 65 ns. It was previously mentioned that, with the introduction of N, the energy band gap increased, compared with the undoped TiO2. It seems that,
Materials 2017, 10, 600
7 of 13
presents the luminescence spectra of TiO2 , doped with N. The fluorescence lifetime of the sample 7 of 13 to approximately 65 ns. It was previously mentioned that, with the introduction of N, the energy band gap increased, compared with the undoped TiO2 . It seems that, as the energy as the energy bang gap is higher, so is the fluorescence lifetime. These results suggest that, together bang gap is higher, so is the fluorescence lifetime. These results suggest that, together with the with the broadening effect of N observed in Raman spectra, the element could serve as surface broadening effect of N observed in Raman spectra, the element could serve as surface defects, which defects, which can decrease the material’s crystallinity but simultaneously enhance the electron-hole can decrease the material’s crystallinity but simultaneously enhance the electron-hole separation, separation, functioning in this case as trap sites for the separated charged states of the functioning in this case as trap sites for the separated charged states of the semiconductor. The results semiconductor. The results presented in Figure 6c prove that, as opposed to N-doped sample, presented in Figure 6c prove that, as opposed to N-doped sample, Yttrium should enable the creation of Yttrium should enable the creation of intraband gap states that do not alter the crystallinity but intraband gap states that do not alter the crystallinity but actually change the electronic recombination actually change the electronic recombination mechanism of the semiconductor. In this case, a mechanism of the semiconductor. In this case, a significant quenching of the fluorescence signal is significant quenching of the fluorescence signal is observed, together with a small decrease of the observed, together with a small decrease of the fluorescence lifetime, which is now approximately fluorescence lifetime, which is now approximately 58 ns. This points out to a slight increase of the 58 ns. This points out to a slight increase of the recombination rate of the electron-hole pair. Figure 6d,e recombination rate of the electron-hole pair. Figure 6d,e confirm the trend, presenting a significant confirm the trend, presenting a significant change in the fluorescence lifetime from the codoped 2% Y-N change in the fluorescence lifetime from the codoped 2% Y-N sample to the codoped 4% Y-N sample to the codoped 4% Y-N sample, which infers a decrease of approximately 59 ns to around 44 ns, sample, which infers a decrease of approximately 59 ns to around 44 ns, respectively. Therefore, the respectively. Therefore, the photoluminescence of these samples is, as expected, directly correlated photoluminescence of these samples is, as expected, directly correlated with the recombination with the recombination process of the electron-hole pair [25]. Indeed, by increasing the energy gap and process of the electron-hole pair [25]. Indeed, by increasing the energy gap and while delaying the while delaying the recombination carrier, the radiative recombination lifetime should be higher, leading recombination carrier, the radiative recombination lifetime should be higher, leading also to higher also to higher luminescence lifetimes. The doping of Yttrium into titania quenches the fluorescence luminescence lifetimes. The doping of Yttrium into titania quenches the fluorescence signal because signal because the excited electron can transfer from the valence band to the new levels that exist the excited electron can transfer from the valence band to the new levels that exist beneath the beneath the conduction band, which can decrease the photoluminescence intensity. In this way, TiO2 conduction band, which can decrease the photoluminescence intensity. In this way, TiO2 doped with doped with N and co-doped with 2% Y-N could have a higher photo-catalytic activity by delaying the N and co-doped with 2% Y-N could have a higher photo-catalytic activity by delaying the electron-hole recombination, despite their lower absorption in the visible range, when compared with electron-hole recombination, despite their lower absorption in the visible range, when compared the sample doped with 2% Y. However, it is important to be precise that the value of the lifetime of with the sample doped with 2% Y. However, it is important to be precise that the value of the photoexcited charge in 2% Y-N is much smaller than the observed one in the 2% Li-N codoped sample, lifetime of photoexcited charge in 2% Y-N is much smaller than the observed one in the 2% Li-N which is 72 ns [15]. codoped sample, which is 72 ns [15]. Materials 2017, 10, 600 changes, increasing
Figure 6. Cont.
Materials 2017, 10, 600
8 of 13
Materials 2017, 10, 600
8 of 13
Figure 6. 6. Time Time resolved resolved laser laser induced induced luminescence luminescence spectra, spectra, at at 77 77 K, K, of: of: anatase anatase undoped undoped (a); (a); doped doped Figure with N N (b); (b); doped doped with with 2% 2% Y Y (c); (c); codoped codoped with with 2% 2% (d) (d) and and 4% 4% of of Y-N Y-N (e). (e). The The excitation excitation wavelength wavelength with was 337 nm. The initial curve was obtained immediately immediately after after the laser pulse, and, for all of other curves, the time step was 20 ns annealed at 400 ◦°C. C.
2.6. Photocatalytic 2.6. Photocatalytic Degradation Degradation The photocatalytic photocatalytic activity all prepared was by evaluated the The activity of allofprepared samples samples was evaluated measuringbythemeasuring decomposition decomposition of toluidine underfrom photoexcitation from a halogen light source. 7 shows rate of toluidinerate under photoexcitation a halogen light source. Figure 7 shows theFigure degradation of the degradation of the organic solute model without any catalyst and in the presence of undoped the organic solute model without any catalyst and in the presence of undoped TiO2 , N or Y doped TiO2Y-N , N or Y doped Y-N codoped TiO2 at a level of 2%. As shown in Figure 7, the residual and codoped TiOand 2 at a level of 2%. As shown in Figure 7, the residual concentration of toluidine ◦ films calcined concentration of toluidine after 8 h of irradiation in the of undoped TiO2 thin after 8 h of irradiation in the presence of undoped TiOpresence 2 thin films calcined at 400 C is about 64%, at 400 °C is about 64%, attesting the low photocatalytic activity of the pure TiO 2. Doping TiO2 with N attesting the low photocatalytic activity of the pure TiO2 . Doping TiO2 with N or Y notably affects the or Y notably affects theResults photocatalytic Results reported in Figure revealed different trends photocatalytic activity. reportedactivity. in Figure 7 revealed different trends7 depending on the doping depending on the doping element. The largest catalytic effect is observed in the presence of 2% Y-N, element. The largest catalytic effect is observed in the presence of 2% Y-N, for which the residual for which the residual concentration of toluidine attained 12% after 8 h of light irradiation. One concentration of toluidine attained 12% after 8 h of light irradiation. One should note that, although all should note that, although all of the samples crystallize in the anatase form of TiO 2, their of the samples crystallize in the anatase form of TiO2 , their photocatalytic activities differ considerably. photocatalytic differ considerably. Thisinrules the assignment of the difference in the This rules out activities the assignment of the difference the out degradation performance to the structural degradation performance to the structural properties. However, this result is probably due to the properties. However, this result is probably due to the synergetic role of the dopants dispersed on the synergetic role of the dopants dispersed on the TiO 2 surface (as demonstrated by the decrease of TiO2 surface (as demonstrated by the decrease of crystallite sizes of the samples), yielding low average crystallite between sizes of the yielding low as average thetodopant centers acting distances thesamples), dopant centers acting traps. distances However,between compared 2% Y-N codoped TiOas 2, traps. However, compared to huge 2% Y-N codoped TiOphotocatalytic 2, increasing the Y level leads to huge decreases increasing the Y level leads to decreases in the performance. Indeed, the residual in the photocatalytic performance. the44% residual of toluidine reached 39% and concentration of toluidine reachedIndeed, 39% and in theconcentration case of 3% Y-N and 4% Y-N, respectively. 44% in the case of 3% Y-N and 4% Y-N, respectively. We argue that lower Y doping more We argue that lower Y doping is more beneficial to the degradation process compared toishigher beneficial degradation process compared todoping higher Y doping. In addition, with the increase of Y doping. to Inthe addition, with the increase of the Y level, the distance between trapping sites the Y doping level, the distance between trapping sites decreases. The Y site at the surface of TiO decreases. The Y site at the surface of TiO2 nanoparticles can act as the charge carrier recombination2 nanoparticles can act as the carrier recombination center [17], which results in a contributes decrease of center [17], which results in charge a decrease of the number of photogenerated charge, which thethenumber of process. photogenerated charge, which contributes in well thewith degradation process. in degradation Photoluminescence analysis corroborates these experimental Photoluminescence analysis corroborates well with these experimental observations, since observations, since the lifetime significantly decreases with increasing the doping level of Y from the 2% lifetime significantly decreases with increasing the doping level of Y from 2% Y-N to 4% Y-N. Y-N to 4% Y-N. In summary, summary, careful careful analysis analysis of of the the experimental experimental results results reveals reveals energy energy gap gap values, values, which which only In only allows the absorption of irradiation in the UV region. However, interesting performance was allows the absorption of irradiation in the UV region. However, interesting performance was evidenced evidenced for the photodegradation toluidineunder pollutant under halogen lamp,inespecially in the for the photodegradation of toluidineofpollutant halogen lamp, especially the presence of presence of 2% Y-N codoped TiO 2. Both sunlight and W-Hal lamp have a small tail in the UV region, 2% Y-N codoped TiO2 . Both sunlight and W-Hal lamp have a small tail in the UV region, and this and explain this may the observed photocatalytic activity. explain this trend, numerous may theexplain observed photocatalytic activity. To explain thisTo trend, numerous hypotheses have hypotheses have been proposed, some relevant ones that claimed that the N dopant atoms resulted been proposed, some relevant ones that claimed that the N dopant atoms resulted in the creation of in the creation of surface oxygen (OVs) [26]. On the other Y the dopant seems to surface oxygen vacancies (OVs) [26]. vacancies On the other hand, Y dopant seems to hand, promote recombination promote the recombination process, thereby decreasing the photocatalytic efficiency. This reactivity process, thereby decreasing the photocatalytic efficiency. This reactivity was also attributed by other was alsotoattributed by other authors to a charge-transfer-complex in which neither the authors a charge-transfer-complex mechanism, in which neither mechanism, the photocatalyst nor the organic photocatalyst nor the organic compounds absorb visible light by themselves [27,28]. compounds absorb visible light by themselves [27,28].
Materials 2017, 10, 600 Materials 2017, 10, 600 Materials 2017, 10, 600
9 of 13 9 of 13 9 of 13
Figure 7. Evolution of the residual concentration of toluidine in the presence of undoped, Y-N doped Figure 7. of residual concentration of toluidine in the presence of undoped, Y-N doped Figure 7. Evolution Evolution ofthe the residual concentration films annealed at 400 °C. of toluidine in the presence of undoped, Y-N doped and codoped TiO2 thin 2 thin films annealed at 400 °C. and codoped TiO ◦ and codoped TiO thin films annealed at 400 C. 2
2.7. Reuse of the Photocatalyst 2.7. Reuse of the Photocatalyst 2.7. Reuse of the Photocatalyst In view of practical application, the photocatalyst should be chemically and optically stable In view of practical application, the photocatalyst should be chemically and optically stable view repeated of practical application, the photocatalyst should beN, chemically optically stable afterIn several cycles. To investigate the reusability of 2% 2% Y andand 2% Y-N doped and after several repeated cycles. To investigate the reusability of 2% N, 2% Y and 2% Y-N doped and after several repeated cycles. To investigate the reusability of 2% N, 2% Y and 2% Y-N doped and codoped TiO2 in the photocatalytic degradation of toluidine experiment was repeated three times. codoped TiO2 in the photocatalytic degradation of toluidine experiment was repeated three times. codoped TiO2 in the photocatalytic degradation of toluidine repeated three times. The concentration of the organic pollutant was measured afterexperiment 8 h exposedwas to lamp irradiation. After The concentration of the organic pollutant was measured after 8 h exposed to lamp irradiation. After The concentration of the organic pollutant was measured after 8 h exposed to lamp irradiation. After each decomposition reaction, the beads were rinsed with water, dried and used again in the same each decomposition reaction, the beads were rinsed with water, dried and used again in the same each decomposition reaction, the beads with water, dried and used again in conditions. As shown in Figure 8, the were betterrinsed results were observed in the presence ofthe 2%same Y-N conditions. As shown in Figure 8, the better results were observed in the presence of 2% Y-N conditions. As2,shown in Figure the better results weredecrease observedininphotodegradation the presence of 2%efficiency Y-N codoped codoped TiO for which, after8,three cycles, a slight was codoped TiO2, for which, after three cycles, a slight decrease in photodegradation efficiency was TiO , for which, after three cycles, a slight decrease in photodegradation efficiency was observed. 2 observed. In fact, in this case, the residual concentration of toluidine increased from 12% to 16%. observed. In fact, in this case, the residual concentration of toluidine increased from 12% to 16%. In fact, in this case, the by residual concentration of intermediate toluidine increased 12% to 16%. This may be This may be explained the formation of some speciesfrom that remained adsorbed at the This may be explained by the formation of some intermediate species that remained adsorbed at the explained the formation some intermediate species2% that remained adsorbed theregarded surface of surface of by catalyst particles.of Judging from these results, Y-N codoped TiO2 canatbe as surface of catalyst particles. Judging from these results, 2% Y-N codoped TiO2 can be regarded as catalyst particles. Judging from these results, 2% Y-N codoped TiO can be regarded as stable and stable and owing a considerable reproducibility of photodegradation 2 of toluidine, which makes its stable and owing a considerable reproducibility of photodegradation of toluidine, which makes its owing a considerable reproducibility ofcourse, photodegradation which its usefactors in the use in the practical process possible. Of further workofistoluidine, required to bettermakes understand use in the practical process possible. Of course, further work is required to better understand factors practical process possible. Of course,rate further workY-N is required to better understand factors that affect that affect the photodegradation of 2% codoped TiO2 and to further improve the that affect the photodegradation rate of 2% Y-N codoped TiO2 and to further improve the the photodegradation rate of 2% Y-N codoped TiO and to further improve the photocatalyst stability. photocatalyst stability. 2 photocatalyst stability.
Figure 8. 8. Evolution Evolution of of the the residual residual concentration concentration of of toluidine toluidine after after three three degradation degradation cycles cycles in in the the Figure Figure 8. Evolution of the residual concentration of toluidine after three degradation cycles in the 2 photocatalyst annealed at 400◦°C. presence of 2% N, 2% Y and 2% Y-N codoped TiO presence of of 2% 2% N, N, 2% 2% Y Y and and 2% 2% Y-N Y-N codoped photocatalyst annealed C. annealed at at 400 400 °C. presence codoped TiO TiO22 photocatalyst
Materials 2017, 10, 600
10 of 13
3. Materials and Methods 3.1. Preparation of Films and Powders Y-N co-doped TiO2 samples were deposited using the sol–gel chemical process and dip-coating techniques with Ti(OBu)4 as precursor and acetylacetone (C5 H8 O2 ) as solvent. To achieve the doping, YCl3 ·6H2 O and CH3 (CH2 )4 CH2 NH2 were used as sources of yttrium and nitrogen dopants, respectively. As a first step, an appropriate amount of YCl3 ·6H2 O was dissolved in acetylacetone. Three different solutions corresponding to three atomic ratios Y/Ti = 0.02, 0.03 and 0.04 were elaborated. The hexylamine was then slowly added to the limpid solution under vigorous stirring (Atomic ratio N/Ti = 0.02). Afterwards, Ti(OBu)4 were introduced. Then, the activated substrate of glass was immersed in the prepared sol for 2 min. The obtained transparent thin films were then calcined at different temperatures: 400, 500, 550 and 650 ◦ C for 2 h by heating at a rate of 5 ◦ C/min followed by a free cooling. The remaining solutions were kept under stirring for several hours to obtain the powdered samples. For comparison purposes, undoped and Y or N monodoped TiO2 were prepared using the same synthetic protocol. 3.2. Physical and Chemical Characterization of the Catalysts The surface morphology of the Y-, N-doped or codoped TiO2 thin films was studied by field-emission scanning electron microscopy (FE-SEM) using ZEISS SUPRA40 (ZEISS, Germany) fully controlled from a computer workstation. The electron source, a hot cathode producing electrons by Schottky effect, is a tungsten filament coated with a ZrO layer. Images are created by the software SMARTSEM. The crystal structure of the obtained films was characterized by the grazing angle X-ray diffraction GXRD technique using an X-ray diffractometer Panalytical Xpert with CuKα radiation. The scanning range (2θ) was from 20◦ to 75◦ with a scanning rate of 0.05◦ /min and an incidence angle of 0.5◦ . The Raman spectra of the powders were obtained in a back-scattering micro-configuration, with 532 nm excitation (Cobolt Samba CW DPSSL, 300 mW, Stockholm, Sweden) and by the use of a SuperHead 532 from Horiba JobinYvon (JY) (Villeneuve-d’Ascq, France) with a 50× Edmund long working distance objective. The Raman probe was coupled to a Shamrock 163 with a 100 µm entrance slit) and a Newton DU 971P-BV camera from Andor (Belfast, UK) was used as a detector for the Raman signals, working at −60 ◦ C. Data acquisition was performed with the Andor software and data processing, namely, the baseline corrections, when needed, were made with the LabSpec software from JY (version 5.25.15, Villeneuve-d’Ascq, France). The spectral resolution of this Raman spectrometer was ~2 cm−1 . For the thin films, Raman spectra were recorded on a JYT64000 Raman spectrometer. A signal was obtained on excitation of the samples by an ArKr laser (514.5 nm). Measurement was done with the beam path set at (50×) and an exposure time of 2 × 300 s. Ground-state absorption studies were performed using a homemade diffuse reflectance laser flash photolysis setup, with a 150 W tungsten-halogen lamp as monitoring lamp, triggering the system in the normal way but without the laser fire, and, in this way, recording the lamp profile for all samples under study and also for two standards, barium sulfate and magnesium oxide powders. A fixed monochromator coupled to an intensified charge coupled device (ICCD) with time gate capabilities was used for detecting the reflectance signals. The reflectance, R, from each sample was obtained in the UV–Vis-NIR (UV–Ultraviolet; Vis–visible; NIR-near infrared) spectral regions and the remission function, F(R), was calculated using the Kubelka–Munk equation for optically thick samples. The remission function is F(R) = (1 − R)2 /2R. The set-up for time resolved luminescence LIL (laser induced fluorescence, LIF, and laser induced phosphorescence, LIP) is presented in Refs. [29,30]. Time-resolved emission spectra were performed in the nanosecond to second time range with an N2 laser (Photon technology international-PTI, model
Materials 2017, 10, 600
11 of 13
2000, ca. 600 ps, full width half maximum (FWHM), about 1 mJ per pulse, 337 nm of excitation, PTI, ON, Canada). 3.3. Photocatalytic Activity Measurements The photocatalytic performance of the Y-N codoped TiO2 was quantified by measuring the rate of degradation of organic solute model under halogen light irradiation. In a typical measurement, 25 mL of 5.10−4 mol L−1 solution of the organic solute was prepared. Titanium dioxide films deposed on beads of glass were introduced as photocatalysts. Prior to illumination, the suspension was stirred in the dark for 1 h to establish an adsorption/desorption equilibrium between the photocatalyst and pollutant molecules. Then, the photocatalytic degradation of pollutant model was initiated. The degradation test was carried out using a 47 W halogen lamp power (230 V), as a source of irradiation. The use of a lamp assures a constant light output in opposition to the fluctuation in solar intensity with season and time of day. To evaluate the organic solute concentration during the photodegradation reaction under constant irradiation, 1 mL of the suspension was taken out at a given time interval and the UV absorbance at their corresponding λmax (at 280 nm) was measured. The concentration was evaluated from the calibration curve previously established with a known concentration of aliquot. 4. Conclusions In this work, Y-, N-doped or codoped TiO2 powders and thin films deposited on glass beads were successfully prepared using the sol-gel method, Ti (OBu)4 as Ti precursor. Structurally, the samples were found to be anatase with uniform shape nanoparticles (20–30 nm) as evidenced by FE-SEM observation. Ground state diffuse reflectance absorption studies showed that doping with N or codoping with N and Y led to an increase of the band gap. Laser induced luminescence analysis revealed a decrease in the recombination rate of the photogenerated holes and electrons. The photocatalytic activity of the prepared catalysts, under halogen light irradiation, was evaluated using toluidine as pollutant model. Results showed a great enhancement in the photocatalytic efficiency following the corporation of Y-N simultaneously, which is probably due to an electron-transfer mechanism, in which neither the photocatalyst nor the organic compounds absorb visible light by themselves. The photocatalyst was reusable for several degradation cycles with only a small reduction in the degradation efficiency. This advantage is important in the continuous photocatalytic degradation process. Acknowledgments: Thanks are due to FCT (Portugal’s Foundation for Science and Technology), for the funding project UID/NAN/50024/2013 and for the PhD fellowships (SFRH/BD/95358/2013) of David Conceição. Author Contributions: S.B., S.B. and L.F.V.F. conceived and designed the experiments; Z.H. and D.C. performed the experiments; D.C., S.B., S.B. and L.F.V.F. analyzed the data; S.B. and L.F.V.F. contributed reagents/materials/analysis tools; and S.B. and L.F.V.F. wrote the paper. Conflicts of Interest: We declare that we do not have any commercial or associative interests that represent a conflict of interest in connection with the work submitted.
References 1. 2.
3. 4.
Sreekanta, S.; Ahazan, R.; Lockman, Z. Photoactivity of anatase-rutile TiO2 nanotubes formed by anodization method. Thin Solid Films 2009, 518, 16–22. [CrossRef] Hamdi, A.; Ferraria, A.M.; Rego, A.M.B.; Ferreira, D.P.; Conceição, D.S.; Ferreira, L.F.V.; Bouattour, S. Bi–Y doped and codoped TiO2 nanoparticles: Characterization and photocatalytic activity undervisible light irradiation. J. Mol. Catal. A Chem. 2013, 380, 34–42. [CrossRef] Nosaka, Y.; Matsushita, M.; Nishino, J.; Nosaka, A.Y. Nitrogen-doped titanium dioxide photocatalysts for visible response prepared by using organic compounds. Sci. Technol. Adv. Mater. 2005, 6, 143–148. [CrossRef] Asahi, R.; Morikawa, T.; Ohwaki, T.; Aoki, K.; Taga, Y. Visible-Light Photocatalysis in Nitrogen-Doped Titanium Oxides. Science 2001, 293, 269–271. [CrossRef] [PubMed]
Materials 2017, 10, 600
5.
6. 7. 8. 9. 10. 11. 12. 13. 14. 15.
16.
17. 18. 19.
20. 21. 22. 23.
24.
25.
26.
12 of 13
Morikawa, T.; Ohwaki, T.; Suzuki, K.; Moribe, S.; Kubota, S.T. Visible-light-induced photocatalytic oxidation of carboxylic acids and aldehydes over N-doped TiO2 loaded with Fe, Cu or Pt. Appl. Catal. B Environ. 2008, 83, 56–62. [CrossRef] Chen, X.; Luo, W. Optical spectroscopy of rare earth ion-doped TiO2 nanophosphors. J. Nanosci. Nanotechnol. 2010, 10, 1482–1494. [CrossRef] [PubMed] Hamden, Z.; Ferreira, D.P.; Ferreira, L.V.; Bouattour, S. Li–Y doped and codopedTiO2 thin films: Enhancement of photocatalytic activity under visible light irradiation. Ceram. Int. 2014, 40, 3227–3235. [CrossRef] Narayan, H.; Alemu, H.; Setofolo, L.; Macheli, L. Visible Light Photocatalysis with Rare Earth Ion-Doped TiO2 Nanocomposites. ISRN Phys. Chem. 2012. [CrossRef] Wang, Y.; Lu, K.; Feng, C. Photocatalytic degradation of methyl orange by polyoxometalates supported on yttrium-doped TiO2 . J. Rare Earth 2011, 29, 866–877. [CrossRef] Bouattour, S.; Rego, A.M.B.; Ferreira, L.F.V. Photocatalytic activity of Li+ –Rb+ –Y3+ doped or codoped TiO2 under sunlight irradiation. Mater. Res. Bull. 2010, 45, 818–825. [CrossRef] Kallel, W.; Bouattour, S.; Kolsi, A.W. Structural and conductivity study of Y and Rb co-doped TiO2 synthesized by the sol-gel method. J. Non-Cryst. Solids 2006, 352, 3970–3978. [CrossRef] Wu, Y.; Gong, Y.; Liu, J.; Zhang, Z.; Xu, Y.; Ren, H.; Li, C.; Niu, L. B and Y co-doped TiO2 photocatalyst with enhanced photodegradation efficiency. J. Alloys Compd. 2017, 695, 1462–1469. [CrossRef] Kuvarega, A.T.; Krause, R.W.M.; Mamba, B.B. Nitrogen/Palladium-Codoped TiO2 for Efficient Visible Light Photocatalytic Dye Degradation. J. Phys. Chem. C 2011, 115, 22110–22120. [CrossRef] Irie, H.; Watanabe, Y.; Hashimoto, K. Nitrogen-Concentration Dependence on Photocatalytic Activity of TiO2 -xNxPowders. J. Phys. Chem. B 2003, 107, 5483–5486. [CrossRef] Hamden, Z.; Boufi, S.; Conceicão, D.S.; Ferraria, A.M.; Rego, A.M.B.; Ferreira, D.P.; Ferreira, L.F.V.; Bouattour, S. Li–N doped and codoped TiO2 thin films deposited by dip-coating: Characterization and photocatalytic activity under halogen lamp. Appl. Surf. Sci. 2014, 314, 910–918. [CrossRef] Khan, M.; Cao, W. Preparation of Y-doped TiO2 by hydrothermal method and investigation of its visible light photocatalytic activity by the degradation of methylene blue. J. Mol. Catal. A Chem. 2013, 376, 71–77. [CrossRef] Zhang, H.; Tan, K.; Zheng, H.; Gu, Y.; Zhang, W.F. Preparation, characterization and photocatalytic activity of TiO2 codoped with yttrium and nitrogen. Mater. Chem. Phys. 2011, 125, 156–160. [CrossRef] Birks, L.S.; Friedman, H. Particle Size Determination from X-Ray Line Broadening. J. Appl. Phys. 1946, 17, 687–692. [CrossRef] Shi, J.; Chen, J.; Feng, Z.; Chen, T.; Lian, Y.; Wang, X.; Li, C. Photoluminescence characteristics of TiO2 and their relationship to the photoassisted reaction of water/methanol mixture. J. Phys. Chem. C 2007, 111, 693–699. [CrossRef] Hughes, A.E.; Sexton, B.A. XPS study of an intergranular phase in yttria-zirconia. J. Mater. Sci. 1989, 24, 1057–1061. [CrossRef] Choudhury, B.; Borah, B.; Choudhury, A. Ce–N codoping effect on thestructural and optical properties of TiO2 nanoparticles. Mater. Sci. Eng. B 2013, 178, 239–247. [CrossRef] Zhu, K.; Zhang, M.; Chen, Q.; Yin, Z. Size and phonon-confinement effects on low-frequency Raman mode of anatase TiO2 nanocrystal. Phys. Lett. A 2005, 340, 220–227. [CrossRef] Zhao, B.; Wang, J.; Li, H.; Wang, H.; Jia, X.; Su, P. The influence of yttrium dopant on the properties of anatase nanoparticles and the performance of dye-sensitized solar cells. Phys. Chem. Chem. Phys. 2015, 17, 14836–14842. [CrossRef] [PubMed] Mercado, C.; Seeley, Z.; Bandyopadhyay, A.; Bose, S.; McHale, J. Photoluminescence of dense nanocrystalline titanium dioxide thin films: Effect of doping and thickness and relation to gas sensing. ACS Appl. Mater. Interfaces 2011, 3, 2281–2288. [CrossRef] [PubMed] Liu, G.; Wang, X.; Wang, L.; Chen, Z.; Li, F.; Lu, G.; Cheng, H.M. Drastically enhanced photocatalytic activity in nitrogen doped mesoporous TiO2 with abundant surface states. J. Colloid Interface. Sci. 2009, 334, 171–175. [CrossRef] [PubMed] Li, D.; Ohashi, N.; Hishita, S.; Kolodiazhnyi, T.; Haneda, H. Origin of visible-light-driven photocatalysis: A comparative study on N/F-doped and N–F-codoped TiO2 powders by means of experimental characterizations and theoretical calculations. J. Solid State Chem. 2005, 178, 3293–3302. [CrossRef]
Materials 2017, 10, 600
27. 28.
29. 30.
13 of 13
Agrios, A.G.; Gray, K.A.; Weitz, E. Narrow-band irradiation of a homologous series of chlorophenols on TiO2 : Charge-transfer complex formation and reactivity. Langmuir 2004, 20, 5911–5918. [CrossRef] [PubMed] Wang, N.; Zhu, L.; Huang, Y.; She, Y.; Yu, Y.; Tang, H. Drastically enhanced visible-light photocatalytic degradation of colorless aromatic pollutants over TiO2 via a charge-transfer-complex path: A correlation between chemical structure and degradation rate of the pollutants. J. Catal. 2009, 266, 199–206. [CrossRef] Rego, A.M.B.; Ferreira, L.F.V. Photonic and electronic spectroscopies for the characterization of organic surfaces and organic molecules adsorbed on surfaces. Exp. Methods Phys. Sci. 2001, 38, 269–354. Ferreira, L.F.V.; Machado, I.L.F. Surface Photochemistry: Organic Molecules within Nanocavities of Calixarenes. Curr. Drug Discov. Technol. 2007, 4, 229–245. [CrossRef] © 2017 by the authors. Licensee MDPI, Basel, Switzerland. This article is an open access article distributed under the terms and conditions of the Creative Commons Attribution (CC BY) license (http://creativecommons.org/licenses/by/4.0/).