Journal of Ovonic Research
Vol. 12, No. 4, July - August 2016, p. 185 - 191
STRUCTURAL, OPTICAL AND FERROELECTRIC PROPERTIES OF BaTiO3 CERAMICS V. N. REDDY*, K. C. BABU NAIDU, T. SUBBARAO Materials Research Lab, Dept. of Physics, S. K. University, Anantapur – 515 003, A. P, India
This investigation mainly deals with the structural, optical and ferroelectric properties of barium titanate (BT) ceramics synthesized via conventional solid state reaction method.The phase purity is evaluated from diffraction studies. The morphology is analyzed by scanning electron microscope. The diffuse reflectance spectrum (DRS) attributes the direct and indirect optical band gap energiesof BT. In addition;IR spectrum confirms the presence of metal oxide (M-O) bonds such as Ti-O and Ba-O. The ferroelectric behavior (P-E loop) of BT as a function of temperature is also studied. (Received May 10, 2016; Accepted July 5, 2016) Keywords:Structure; Scanning Electron Microscopy;Optical Properties; Ferroelectric Properties
1. Introduction Ceramic materials have potential applicationsdue to theirelectrical properties [1]. In particular, the ceramic materials with ferroelectric properties have been developed and utilized for a variety of applications such as; non volatile memories, medical ultrasound imaging and actuators, and data storage devices [2]. The biggest applications of ferroelectric ceramics have been in the areas of dielectric ceramics for capacitor applications, especially ferroelectric thin film technology [3].The perovskite family shows a structure of the type ABO3 [4]. Many ferroelectric materials such as; barium titanate (BaTiO3), lead titanate (PbTiO3), lead zirconate titanate (PZT), lead lanthanum zirconate titanate (PLZT), have this perovskite type structure. Usually, ferroelectric behavior is investigated with the help ofP-E loop tracer. To the best of author’s knowledge in the literaturesurvey,there is no detailed report on polarization (P) versus electric filed (E)variations as a function of temperature.Hence, an attempt has been made to elucidate the temperature dependence of ferroelectric properties such as saturated polarization (Ps), remanance polarization (Pr) and coercive field (Ec). In addition, the structural, morphological and optical properties are carried out. 2. Experimental Procedure In this study the precursorsarechosen as Ba(NO3)2(99.6% purity, Sigma Aldrich), TiO2 (99.4% purity, Sigma Aldrich) to prepare the ferroelectric barium tinate ceramics.Initially, the raw materials areweighed and mixed uniformly according to their stoichiometric ratio. The mixed powder is ball milled for approximately 12 husing ball miller (Retsch PM200. Furthermore, the uniformly grounded powder ispresintered at 10000C for 12 hr. The presintered powder is again ground for nearly 2 hr.The pellets of radius 0.59 cm and thickness 0.288 cm areprepared after applying 5 ton pressure using hydraulic press. The pellets are sintered at 1100oC for 2 hr in conventional furnaces. Further, the pelletsare characterized using XRD at room temperature *
Corresponding author:
[email protected]
186
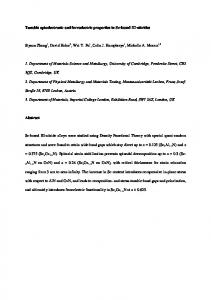
(Bruker X-Ray Powder Diffract Meter, CuKα = 0.15418 nm), SEM (Hitachi: S-4700), EDAX (AMETEK system),JASCO UV-Visible spectrophotometer (V-670 PC), FT-IR spectrophotometer (IR affinity-1, Shimadzu)and P-E loop measurement (Marine India)for structural, surface morphological, elemental analysis, optical and ferroelectric properties respectively. 3. Results and Discussions 3.1 Structural Analysis The diffraction pattern of BaTiO3 ceramic powder is shown in Fig.1. It can be understood from figure that the formedsinglecrystalline phases that belong tocubic perovskite structure of pure barium titanate. These phases are in consistent with standard JCPDS file No: 89-2475. These phases are indexed with miller indices (hkl) and compared with standard JCPDS data as depicted in Fig.1. The maximum intensity of 1466is recorded for (110) plane at a two-theta angle of 31.787o.This peak attributes lattice parameter (a) of 3.972 A0for the present material which is almost in close agreement with JCPDS: 89-2475. Furthermore, the average crystalline size (D)is calculatedas 27.3 nm using the Scherer formula [5].Also, the elastic strain (𝛆~ 0.0028)is evaluated from a standard relation mentioned reference [6]. The X-ray density (dx) of ~ 5.4268 g/cm3 is obtained using a formula: ZM/Na3, where‘Z’ is the no. of molecules per unit cell (Z = 1), ‘M’ is the molecular weight of the composition, ‘N’ is Avogadro’s number (6.023 x 10²³) and ‘a’ is the lattice parameter. Further, the bulk density (db) is evaluated with the help of Archimedes principle [7].The pore fraction of (P) is found to be ~ 0.121 by an equation: P~ 1-(db/dx) [4].The smallest value of pore fraction establishes a fact that the present material may be of good dense.
Fig.1 The diffraction pattern of BaTiO3
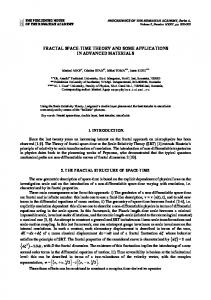
Williamson-Hall (W-H) plot is shown in Fig.2. It is drawn for βcosθ against 4sinθ forcalculating micro-strain (ε') and crystallite size (D) from the equation: [8]. β Cosθ =
0.9λ 𝐷
+ 4ε' Sinθ (1)
where slope of straight line provides micro-strain while crystallite size is related to intercept part. This gives a relationship between ‘ε'’ and ‘D’ values.The strain found from W-H plot is almost consistent with elastic strain (𝛆). In addition, the crystallite size ~ 32.4 nm(from W- H plot) is comparable to Scherer size.
187
Fig.2 The W-H plot of BaTiO3
3.2 SEM and EDS The Scanning Electron Microscope (SEM) provides the surface morphology of powder specimen.It is seen from Fig. 3 that all the grains are of almost spherical in shape. The average grain size (Ga) is found to be 894 nmusing linear intercept method [4]. Ga = 1.5L/MN (2) where L is the test line length, N is the number of intersecting grains and M is the magnification. EDS is generally used for finding the abundances of specific elements present in a material.EDS image (Fig.3)is shown along with the SEM image. It contains atomic and weight percentages of elements of Ba, Ti and O. This reveals the absence of impurities in the compound.
Element
Weight%
Atomic%
OK
26.50
68.46
Ti K
15.76
13.60
Ba L
57.74
17.94
Totals
100.00
Fig.3 The SEM and EDS images of BaTiO3
3.3 Optical Properties 3.3.1 UV-Visible Spectrum The diffuse reflectance spectrum (DRS) is recorded in the range of 200-800 nm (Fig.4 (a)) for finding optical band gap energy of powder samples. Kubelka- Munk function of reflectance F(r) is used to determine band gap [9]. (1−𝑟)2 (3) 2𝑟
F(r) =
188
a
b
Fig.4 (a) The absorption spectrum and (b) (αhν)2 versus photon energy hν (eV) plot of BaTiO3
The maximum absorption wavelength is recorded to be 300 nm. The absorption coefficient (α) is directly proportional to F(r) and hence an equation to find band gap can be written as follows. (αhν)n = m (hν- Eg) (4) Where m= Energy- independent constant that depends on transition probability, Eg= optical band gap energy, n= the kind of transition i.e. n = 2 for direct transition, 2/3 for direct forbidden transition, ½ for indirect transition, 1/3 for indirect forbidden transition and hν = photon energy [10]. In this study direct and indirect transitions are considered. Eop value is evaluatedfrom the linear portion that is extrapolated towards X-axis for (αhν)2 versus photon energy hν (eV) plot as α tends to zero (Fig.4 (b)). The optical band gap energiesfor direct and indirecttransitions are calculated as 3.68 eV and 2.82 eV respectively. FTIR Analysis
Fig.5FTIR spectrum of BaTiO3
Fourier Transform Infrared Spectroscopy (FTIR) spectrumis generally used for the determination of metal oxide bonds of ceramics. The FTIR spectrum of barium titanate ceramics sintered at 1100OCis recorded in the range of 400-4000 cm-1 (Fig. 5) and showed metal oxide (BaO &Ti-O) absorption bands at 489.9 cm-1and 2337.5 cm-1 [11]. 3.4 Ferroelectric (P-E loop) Properties The ferroelectric behavior of BT is investigatedwith the help ofP-E loop tracer. While doing measurement the pellet is connected parallel to 4µF capacitor for compensation. Fig. 6depicts the ferroelectric hysteresis loops of BT under an applied frequency of 600 Hz at an operating voltage of 600 V. It is understood from Fig.6 thatthe sample shows a well-behaved hysteresis loop distorted into ‘banana’ shape performed at distinct temperatures such as 303K,
189
323K, 373K, 423K & 473K. This causes current leakage due to oxygen vacancies on the surface of the grains, instead of polarization.The response of dipolesper unit field is in general regarded as polarization.It is an observed fact that the saturation polarization (Ps) and remanance polarization (Pr) of BT at all temperatures is found to be constant value of ≈ 0.005μC/cm2. It is observed that with increase oftemperature the applied field required for saturation is slowly decreasing.
Fig.6Temperature dependence of P-E loopbehavior of BaTiO3
The coercive electric field (Ec) as a function of temperature is shown in Fig. 7. Initially, Ecis noticed to be increasing temperature up to 373K and further it starts decreasing. It can be attributed to the Curie transition temperature that is normally occurs at 393K.
190
Fig.7 Temperature dependence of coercive field (Ec) of BaTiO3
4. Conclusions The barium titanate ceramic material is synthesized via conventional solid state reaction method. The cubic structure is confirmed form diffraction study. A high optical band gap of 3.68 eVis attributed to BT when a direct transition is considered.The ferroelectric nature of BT provides a constant saturated polarization of 0.005 μC/cm2.Inaddition, the coercive filed is increased from 1.50-1.55kV/cm. Further, it is decreased to 0.37 kV/cm.
Acknowledgements I acknowledge to Dept. of Physics, S.K.University, Anantapur for providing various facilities for sample preparation. Also thankful to Prof.S.Kalainathan, Vellore Institute of Technology (VIT), Tamilnadu for providing P-E loop facility. References [1]K. Chandra Babu Naidu, T. Sofi Sarmash, M. Maddaiah, P. Sreenivasula Reddy, D. Jhansi Rani and T. Subbarao, Journal of The Australian Ceramic Society 52(1), 95 (2016) [2] F. Jona, G. Shirane, Ferroelectric crystals, Dover Publications, INC., New York, 1993 [3]K. C. Babu Naidu, T.Sofi Sarmash, M. Maddaiah, A. Gurusampath Kumar, D.Jhansi Rani, V.Sharon Samyuktha, L. Obulapathi, T.Subbarao, Journal of Ovonic Research 11(2), 79 (2015) [4]K. Chandra Babu Naidu, T. Sofi Sarmash, V. Narasimha Reddy, M. Maddaiah, P. Sreenivasula Reddy, T. Subbarao, Journal of The Australian Ceramic Society 51(1), 94 (2015). [5] K. Chandra Babu Naidu, T. Sofi Sarmash, M.Maddaiah, V.Narasimha Reddy and T.Subbarao, AIP Conference Proceedings 1665, 040001 (2015); doi: 10.1063/1.4917614 [6]M.Maddaiah, K.Chandra Babu Naidu*, D.Jhansi Rani, T. Subbarao, Journal of Ovonic Research 11(3), 99 (2015) [7] S. Prathap, K. Chandra Babu Naidu, and W. Madhuri, Ferroelectric behaviour of microwave sintered iron deficient PbFe12O19-δ, AIP Conference Proceedings 1731, 030019 (2016); doi: 10.1063/1.4947624 [8] H. Moradmard, S. F. Shayeshtech, P. Tohidi, Z. Abbas, M. Khalegi, Journal of Alloys and Compounds 650,116 (2015). [9] Roberto Koferstein, Till Walther, Dietrich Hesse, Stefan G Ebbinghaus, Journal of Material Science 48, 6509(2013) [10] Wen Fan Chen, Hsin Chen, PramodKoshy, and Charles ChristopherSorrell,Journal of The
191
Australian Ceramic Society 51, 1 (2015). [11]M.A.F.de Souza, R.A.Candeia, A.C.Chaves, S.J.G.Lima, E.Longo, L.E.B.Soledade, I.M.G.Santos, A.G. Souza, Materials Letters 59, 549 (2005)