Dec 9, 2016 - p ¼. 4pNe2 εâm*. (22) c is the velocity of light in vacuum. References .... [20] E.L. Papadopoulou, M. Varda, K. Kouroupis-Agalou, Undoped and Al-doped. ZnO films ... etry, John Wiley & Sons Inc., New York (, 1999. [37] S.H. ...
Journal of Alloys and Compounds 696 (2017) 1244e1254
Contents lists available at ScienceDirect
Journal of Alloys and Compounds journal homepage: http://www.elsevier.com/locate/jalcom
Structural, optical properties and characterization of (C2H5NH3)2CdCl4, (C2H5NH3)2CuCl4 and (C2H5NH3)2Cd0.5Cu0.5Cl4 compounds Ramzi Lefi*, Ferid Ben Naser, Hajer Guermazi Unit� e de recherche: Physique des Mat� eriaux Isolants et Semi Isolants, Faculty of Sciences of Sfax, University of Sfax, Tunisia
a r t i c l e i n f o
a b s t r a c t
Article history: Received 18 April 2016 Received in revised form 24 November 2016 Accepted 6 December 2016 Available online 9 December 2016
In this work, we are interested in the synthesis of hybrid perovskite crystals (C2H5NH3)2CdCl4, (C2H5NH3)2CuCl4 and (C2H5NH3)2Cd0.5Cu0.5Cl4, by the conventional method. X-ray diffraction indicates that these compounds crystallize at room temperature in the orthorhombic system. The values of lattice parameters and volume were determined. The values of the average crystallite size and the strain were calculated and compared by two models: Scherrer and Williamson-Hall. We note that the (C2H5NH3)2CdCl4 compound has the best crystal quality. Infrared spectroscopy (FTIR) analysis and UV evisible spectrophotometer were used. FTIR technique confirms the presence of the organic chain of the perovskite compounds. On the other hand, UVevisible absorption measurements show that the optical absorbance is higher in the visible-NIR domain for these compounds. The optical band gap (Eg) is deduced to be 3.11; 2.4 and 3.04 eV for (C2H5NH3)2CdCl4, (C2H5NH3)2CuCl4 and (C2H5NH3)2Cd0.5Cu0.5Cl4 respectively. The dispersion parameters (E0 and Ed) of these compounds were estimated using the WempleeDiDomenico model. The different optical parameters such as refractive index, dielectric permittivity and conductivity were also determined. It is noted that the conductivity increases with the introduction of copper in (C2H5NH3)2CdCl4 compound. © 2016 Elsevier B.V. All rights reserved.
Keywords: Perovskites Strain Average crystallite size FTIR Gap energy
1. Introduction Recently, hybrid compounds have been under extensive investigations for the past two decades due to their interesting structure, optical and electric properties [1e4]. The crystalline structure of compounds with the type [(CnH2nþ1)NH3]2MX4, where n ¼ 2,3…, M represents divalent metals (M: Cu, Cd, …) and X halogens (X: Cl and I, …), may be described as sequences of alternating organic-inorganic layers [5]. For these hybrid materials, the ammonium ion of the organic group forms hydrogen bonds with the halide ion of the inorganic layer, which makes these organicinorganic compounds good candidates for proton conduction with high potential for technological applications [6,7]. The electronic structure of [(CnH2nþ1)NH3]2MX4 is regarded as a selforganized multiple-quantum-well structure consisting of inorganic wells and organic barriers. For compounds with short chain length n � 4 and M ¼ Mn2þ, Fe2þ, Cu2þ, Cd2þ or Pb2þ, the metal ion extends in layers of associated [MX6] octahedra [8e11] and for
M ¼ Co2þ and Zn2þ unassociated tetrahedra [MCl4] arrangement is observed [12,13]. For these hybrid compounds, the physical properties depend on the characteristics of the organic cation and the inorganic anion, which allows the properties of the material to be tailored [14,15]. Organiceinorganic hybrid materials have recently drawn massive attention because of their photovoltaic applications and excellent performances as light absorbers and carrier transporters [16,17]. In this work, we seek to improve the performances of these materials by preparation of a new perovskite compounds based on cadmium and copper. We aim to study the effect of the introduction of copper on structural, optical and electrical properties of (C2H5NH3)2CdCl4 compound. The results of the hybrid (C2H5NH3)2CuyCd1�yCl4 compounds (y ¼ 0; 0.5 and 1) were reported and discussed. 2. Experimental 2.1. Synthesis of material
* Corresponding author. E-mail address: ramzilefi@gmail.com (R. Lefi). http://dx.doi.org/10.1016/j.jallcom.2016.12.078 0925-8388/© 2016 Elsevier B.V. All rights reserved.
The crystals of (C2H5NH3)2CuyCd1�yCl4 compound were synthesized starting from C2H5NH3Cl, CuCl2 and CdCl2 precursors of
R. Lefi et al. / Journal of Alloys and Compounds 696 (2017) 1244e1254
1245
Table 1 Lattice parameters and volume of A2CdCl4, A2CuCl4 and A2Cd0.5Cu0.5Cl4 compounds.
A2Cd Cl4 A2CuCl4 A2Cu0.5Cd0.5Cl4
a (Å)
b (Å)
c (Å)
b(� )
V (Å3)
7.352 7.375 7.35
7.503 7.480 7.47
19.05 21.254 21.18
90 90 90
1076.56 1172.47 1162.48
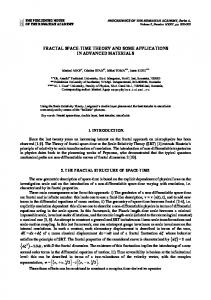
Fig. 1. (a), (b) and (c): X-ray diffractogram of the compounds A2CdCl4, A2CuCl4 and A2Cd0.5Cu0.5Cl4, respectively.
Fig. 2. (a), (b) and (c): variation of cos bhkl vs 4sinq of the compounds A2CdCl4, A2CuCl4 and A2Cd0.5Cu0.5Cl4, respectively.
high purity, which were weighed in the stoichiometric proportion conforming to the equation:
2C2H5NH3Cl þ y CuCl2 þ (1�y) CdCl2þH2O / (C2H5NH3)2CuyCd1�y Cl4 (y ¼ 0; 0.5 and 1) The mixture was slowly evaporated at room temperature. After
1246
R. Lefi et al. / Journal of Alloys and Compounds 696 (2017) 1244e1254
Table 2 Parameters of the crystallite size and the dislocation density estimated from Scherrer's and W-H. Compounds
Sherrer's
A2CdCl4 A2CuCl4 A2Cu0.5Cd0.5Cl4
Table 3 Different peaks attribution by FTIR of the three samples A2CdCl4, A2CuCl4 and A2Cu0.5Cd0.5Cl4. Wavenumber (cm�1)
Williamson-Hall
Attribution
D (nm)
4 (nm�2)
D (nm)
4 (nm�2)
A2CdCl4
A2CuCl4
A2Cu0.5Cd0.5
113.9 99.61 70.81
7.7 10�5 1.007 10�4 1.99 10�4
87.8 83.33 65.67
1.3 10�4 1.44 10�4 2.31 10�4
405 794 873 970 1045 1191 1340 1405 1492 1587 1631 1920 2956 3122 3197 3409
414.6 794.5 e 972 1051 1197 1336 1406 1498 e 1637 1968 e e 3183 3415
524 792 869 968 1045 1190 1339 1403 1488 1583 e 2065 2950 e e 3415
bold : This material has the best structural and optical properties
a few days, the product compound was obtained. The prepared samples are (C2H5NH3)2CdCl4 (y ¼ 0), (C2H5NH3)2Cd0,5Cu0,5Cl4 (y ¼ 0.5) and (C2H5NH3)2CdCl4 (y ¼ 1) which are named in the following sections as A2CdCl4, A2Cu0.5Cd0.5Cl4 and A2CuCl4 respectively, where (A ¼ C2H5NH3). For the optical measurements we used pellets of about 1.2 mm of thickness. 2.2. Characterization techniques The structural results were investigated at room temperature by X-ray diffraction using a «Bruker D8» apparatus having CuKa (l¼ 1.5418 Å) radiation. The lattice parameters and the peak indexation of the synthesized compounds have been determined by X Pert PROMPD software. The infra-red spectra were recorded in the 4004000 cm�1 range using a Bruker spectrometer reference Vertex 80v. Finally, the optical measurements, in the UVevisible range were carried out using a spectrophotometer, JENWAY 6400, within a (320e1000 nm) wavelength range. A2CdCl4
d(CeCeN) r(CH2) ʋ(CeC)
r(NH3)
ʋ(CeN)
r(CH3) g(CH2) ds(CH3) ds(NH3) das(NH3) d(NeH) das(NH3) ʋas(CH3) ʋs(NH3) ʋas(NH3) ʋas(NH3)
ʋ: stretching; d: bending or in-plane deformation; r: Rocking; s: symmetric; as: asymmetric; g: out-plane deformation.
3. Results and discussion 3.1. Structural study 3.1.1. X-ray diffraction The room temperature powder X-ray diffractogram of the 110
(a)
(b)
A2CuCl4
100
100
Transmittance (%)
80
60
80 70 60 50 40
40
30 4000
3500
3000
2500
2000
-1
1500
1000
500
0
4000
3500
Wavelength(cm )
105
3000
2500
2000
1500 -1
Wavelength (cm )
A2Cd0.5Cu0.5Cl4
(c)
98
Transmittance (%)
Transmittance (%)
90
91
4000
3000
2000
1000
0
-1
Wavelength (cm ) Fig. 3. (a), (b) and (c): FTIR spectras of the different samples A2CdCl4, A2CuCl4 and A2Cd0.5Cu0.5Cl4, respectively.
1000
500
0
R. Lefi et al. / Journal of Alloys and Compounds 696 (2017) 1244e1254
Fig. 4. Variation of absorption coefficient of the samples as a function of wavelength.
A2CdCl4, A2CuCl4 and A2Cd0.5Cu0.5Cl4 compounds are shown in Fig. 1(a)e(c), respectively. The reflection peaks of the X-ray profile were indexed. These compounds were found to have orthorhombic structure at room temperature with a space group Pnma for A2CdCl4 and Pbca for A2CuCl4 and A2Cd0.5Cu0.5Cl4. The lattice parameters a, b and c, and volumes are given in Table 1. The obtained results are in good agreement with literature [18,19]. The diffraction peak broadening evidences grain refinement
1247
along with the large strain associated with the crystal imperfections. The instrumental broadening (bhkl) was corrected, corresponding to every different peak of the material using Eq. (1). The average crystallite size was calculated using Scherrer's formula Eq. (2) [20]. The strain induced in powders due to crystal imperfection and distortion can be calculated using Eq. (3) [21]. From equations (2) and (3), it is confirmed that the XRD peak broadening from crystallite size varies as cos1 q, and from strain varies as tan1 q. Assuming that the particle size and strain contributions to line broadening are independent to each other and both have a Cauchylike profile, the observed line breadth is simply the sum of equations (2) and (3), this leads to Eq. (4). By rearranging Eq. (4) of Williamson-Hall (W-H) model [21], we get Eq. (5). W-H plots for the prepared nanocrystals are show in Fig. 2(a)e(c). From the linear fit to the data, the crystallite size D was estimated from the y-intercept, and the strain ε , from the slope of the fit. The strain values estimated from the fit are about (�3.5 � 10�4), 1.34 � 10�3 and (�4.36 � 10�4) for the A2CdCl4, A2CuCl4 and A2Cu0.5Cd0.5Cl4, respectively. The negative sign of ε for the A2CdCl4 and A2Cu0.5Cd0.5Cl4 shows that these compounds undergo a compressive strain. The values of the crystallite size and the dislocation density estimated from the two models Scherrer's and W-H are presented in Table 2. Where the dislocation density is calculated using Eq. (6) [22]. It is noted that the hybrid A2CdCl4 compound has the largest crystallite size and the lowest value of the dislocation density
Fig. 5. (a), (b) and (c): plots (ahn)2 versus hn of A2CdCl4 and A2CuCl4 and A2Cd0.5Cu0.5Cl4, respectively.
1248
R. Lefi et al. / Journal of Alloys and Compounds 696 (2017) 1244e1254
Table 4 Values of gap-energy, refractive index and Urbach energy for different compounds.
A2CdCl4 A2Cd0.5Cu0.5Cl4 A2CuCl4
Eg (eV)
n
EU (eV)
3.11 3.04 2.4
2.37 2.38 2.58
0.89 1.05 0.97
bold : This material has the best structural and optical properties
Fig. 6. Variation of gap-energy versus refractive index.
(Table 2). This explains that this material has the best crystal quality. We noted that the substitution of cadmium by copper in the A2CdCl4 compound reduces the size of crystallites D. This can be related to the difference in the ionic radius (r2þ Cd ¼ 155pm and r2þ Cu ¼ 135pm). It has been reported by B. Amaya Moral et al. [23], that the M-Cl bond length is different for M ¼ Cd and M ¼ Cu. They reported that the equatorial and axial M-Cl distances are Req ¼ 2.67 and Rax ¼ 2.52 for A2CdCl4 while for A2CuCl4 are Req ¼ 2.28 and Rax ¼ 2.98 [23]. The value of crystallite size D determined by WilliamsoneHall method is lower than that obtained by Scherrer's one. This difference is attributed to the strain value. Thus, using the Scherrer's method without considering the strain may yield to inaccurate results.
3.1.2. FTIR analysis At room temperature, Fig. 3(a)e(c) show infrared (IR) spectra of the studied compounds A2CdCl4, A2CuCl4 and A2Cu0.5Cd0.5Cl4, respectively. The infrared spectra are recorded for the wavenumber region between 4000 and 400 cm�1. A detailed assignment of all bands is difficult, but we can attribute some of them by comparison with similar compounds [24e26]. The assignments are listed in Table 3. The bands observed at about 970, 1492, 1587, 3193 cm�1 in IR spectra, for the three samples A2Cd Cl4, A2CuCl4 and A2Cu0.5Cd0.5Cl4, are attributed to rocking, symmetric and asymmetric deformation, and stretching of NH3, respectively. The band observed at about 405 and 1045 cm�1, for these
Fig. 7. (a), (b) and (c): (Ln a(hn)) versus energy hn plots of the compounds A2CdCl4, A2CuCl4 and A2Cd0.5Cu0.5Cl4, respectively.
R. Lefi et al. / Journal of Alloys and Compounds 696 (2017) 1244e1254
1249
Fig. 8. (a), (b) and (c): Plots of the refractive index versus wavelength of the compounds A2CdCl4, A2CuCl4 and A2Cd0.5Cu0.5Cl4, respectively.
Table 5 Cauchy's parameters of the A2CdCl4, A2Cd0.5Cu0.5Cl4 and A2CuCl4 compounds.
A2CdCl4 A2Cd0.5Cu0.5Cl4 A2CuCl4
A
B(mm)�2
C (mm)�4
D (mm)�6
E(mm)�8
1.42 1.1 0.92
�0.242 �0.166 �0.160
0.747 0.219 0.308
�0.428 �0.358 �0.337
0.067 0.023 0.031
samples, are attributed to the deformation and stretching vibrations of (CeN), respectively. The bands observed at about 1191, 1405 and 2956 cm�1 are attributed to rocking, symmetric deformation and asymmetric stretching of CH3, respectively. The bands observed at about 970 and 1336 cm�1, for different samples, are attributed to rocking and deformation out of plan of CH2, respectively. The peaks appear at about 873 cm�1 are attributed to the stretching of (CeC) for A2CdCl4 and A2Cu0.5Cd0.5Cl4. Finally, we note that these results confirm the presence of the organic chains of hybrid compounds A2Cd Cl4, A2CuCl4 and A2Cu0.5Cd0.5Cl4. 3.2. Optical properties 3.2.1. The absorption coefficient The absorption coefficient a was calculated using Eq. (7) [27,28]. The variation of absorption coefficient a of our samples as a function of wavelength is shown in Fig. 4. It is clearly seen from the
figure that the absorption coefficient tends to decrease as the wavelength increases particularly for A2CuCl4 and A2Cd0.5Cu0.5Cl4. This behavior was observed for many semiconductors and can occur for many reasons, such as internal electric fields within the crystal, deformation of lattice due to strain caused by imperfection and inelastic scattering of charge carriers by phonons [29]. The absorption coefficient a of the sample A2Cd0.5Cu0.5Cl4 decreases faster than that of A2CdCl4 and A2CuCl4, this indicates a high dislocation density. This behavior of the absorbance coefficient is in agreement with the analysis of the dislocation density using the WeH and Scherrer models. 3.2.2. Optical band gap In the case of a direct transition, the optical band gap energy is given by the Tauc's relation Eq. (8) [30]. Fig. 5(a)e(c) show the plot of ½a$ðhnÞ�2 versus the photon energy hn which leads to the Eg value by a linear fit. The calculated value of optical band gap energy Eg of A2CdCl4, A2CuCl4 and A2Cd0.5Cu0.5Cl4 are given in Table 4. These values are comparable to that found in the literature [31]. The substitution of cadmium by copper modifies interatomic distances in the crystal lattice. This creates a change in the positions of the valence band and the conduction band, hence the change in the gap energy from 3.11 to 3.04 eV. We noted that the introduction of copper in A2CdCl4 compound actually decreased the values of gapenergies. This can be due to the creation of impurities such Cu interstitial or Cd vacancies. This leads to creation of defect levels in the band-gap of the material. The values of the gap energy show
1250
R. Lefi et al. / Journal of Alloys and Compounds 696 (2017) 1244e1254
Fig. 9. (a), (b) and (c): Plots of (n2�1)�1 versus (hy)2 of the A2CdCl4, A2CuCl4 and A2Cd0.5Cu0.5Cl4 hybrid compounds, respectively.
Table 6 Calculated values of dispersion parameters of different compounds.
A2CdCl4 A2Cd0.5Cu0.5Cl4 A2CuCl4
S0(mm)�2
l0 (mm)
E0(eV)
Ed (eV)
2.52 1.586 0.267
0.375 0.432 0.533
2.52 1.586 2.19
0.19 0.74 1.28
that our materials can be classified as semiconductor. The refractive index n of the samples is calculated from the gap energy by using the following equation Eq. (9) [32]. The values of the refractive index n are also presented in Table 4. Fig. 6 shows the variation of gap-energy versus refractive index in all compounds. We can clearly note that the increase of copper content leads to an increase in refractive index and significant decrease of the gap energy. 3.2.3. Urbach energies The incorporation of impurity into the semiconductor often reveals the formation of band tailing in the band gap due to the interaction of phonons. The presence of tail absorption profile follows the Urbach law Eq. (10) [33,34]. The width of the located states (band tail energy or Urbach energy EU) was estimated from the slopes of Ln aðhyÞ versus energy plots (Fig. 7(a)e(c)). The estimated values are presented in Table 4. The values prove the presence of disorder in these hybrid compounds. In fact, the Urbach energy is associated with the microstructural lattice disorder. It can be originated from the existence of defects and impurities in both organic and inorganic phases. It is noted that the hybrid A2CdCl4 compound has the small value of EU. This result explains that this material has the best crystal quality. This confirms the results found by XRD.
Fig. 10. Extinction coefficient (k) as a function of wavelength.
3.2.4. Refractive index and coefficient extinction The dispersive behavior of refractive index n(l) was deduced from optical experimental measurements using the following equation Eq. (12) [35]:
R. Lefi et al. / Journal of Alloys and Compounds 696 (2017) 1244e1254
1251
Fig. 11. (a), (b) and (c): Plots of ε1 versus l2 of the A2CdCl4, A2CuCl4 and A2Cd0.5Cu0.5Cl4 hybrid compounds, respectively.
The variations of refractive index n of these compounds with the wavelength are shown in Fig. 8(a)e(c). The refractive index of the sample decreases with increasing the wavelength. The experimental data were fitted in the range (500e1000) using Cauchy formula Eq. (13) [36]. The best fit of experimental data was added in Fig. 8. It demonstrates that these samples have a normal dispersion for the entire wavelength range. Values of Cauchy's parameters are gathered in Table 5. In addition to the Cauchy extrapolation described above, which was done to provide reasonable values for refractive index in the spectral range of low absorption, we have also carried out some other optical constants based on WempleeDiDomenico, single oscillator model using Eq. (14) [37,38]. The WempleeDiDomenico model is used to fit the experimental data of Fig. 9(a)e(c). E0 and Ed can be determined from the intercept, (EE0d ) and the slope (-E01Ed ). Their values are listed in Table 6. The usual situation in insulators and semiconductors is to find an inverse correlation between the refractive index and the characteristic interband energy E0. In semiconductors, this correlation works very well, and even extends to an analogous correlation with the band gap energy [39]. Under the same model, the refractive index can also be analyzed to determine the average oscillator wavelength l0 and oscillator length strength S0 of the studied samples. These values can be obtained by using the following relations Eq. (15) [40,41]: From Fig. 9, we obtain S0 and l0 values from the linear fit of ðn2 ðlÞ � 1Þ�1 versus l�2 . The obtained values are given in Table 6.
Fig. 10 shows the variation of extinction coefficient k of different compounds as function of wavelength. This latter shows similar dependence on wavelength to the refractive index. 3.2.5. Optical dielectric constants The complex dielectric constant (ε(u) ¼ ε1(u) � iε2(u)) characterizes the optical properties of the solid material. The real and imaginary parts of the dielectric constant for these hybrid compounds are also determined by the following relations Eq. (16), Eq. (17) and Eq. (18) [42]: For these samples, in infrared domain, it is found that ε1 is a linear function of the square of the wavelength (Fig. 11). While ε2 is 3 linear with l (Fig. 12). These results can be used to determine the optical constants: ε∞ , up and which are the dielectric constant at high frequencies, the plasma pulse and relaxation time, respectively. We can also calculate the values of the conductivity given by Eq. (19) [43]. c is the velocity of light in vacuum. The calculated values of these constants are given in Table 7. It is noted that the copper introduction in the perovskite structure improves the conduction properties and increases the free carrier concentration-to-effective mass ratio N/m*. 4. Conclusion In this work, we have studied the structure and optical properties of A2CdCl4, A2CuCl4 and A2Cd0.5Cu0.5Cl4 perovskites, prepared by the conventional method: evaporation at room condition. The
1252
R. Lefi et al. / Journal of Alloys and Compounds 696 (2017) 1244e1254
Fig. 12. (a), (b) and (c): Plots of ε2 versus l3 of the A2CdCl4, A2CuCl4 and A2Cd0.5Cu0.5Cl4 hybrid compounds, respectively.
Table 7 Calculated values of ε∞ , up and other constants.
A2CdCl4 A2Cd0.5Cu0.5Cl4 A2CuCl4
ε∞
up(1014 rad s�1)
(10�13s)
N/m*(1046 g�1cm�3)
(S.cm�1)
2.33 1.12 1.18
6.07 13.1 9.73
1.53 0.52 1.21
2.36 5.31 3.45
924.36 956.11 1013.6
atomic arrangement of these hybrid compounds can be described by the alternation of organic-inorganic layers. Moreover, the material cohesion of these compounds are assured by hydrogen bonds (NeHeCl) established between anions and cations. These hybrid compounds A2CdCl4, A2CuCl4 and A2Cd0.5Cu0.5Cl4 are crystallized in the orthorhombic system with Pnma, Pcab and Pbca space group, respectively. XRD analysis indicates that the sample A2CdCl4 has a high crystallite size and a low strain. This result explains that this material has the best crystal quality. FTIR technique confirms the presence of the organic chain of different hybrid compounds A2CdCl4, A2CuCl4 and A2Cd0.5Cu0.5Cl4. The optical band gap and Urbach energies of these samples were estimated from theoretical fits. The A2CdCl4 compound has a low value of Urbach energy; this confirms that this sample has the best crystal quality. The dispersion of these hybrid compounds were studied using the WempleeDiDomenico method. The oscillator energy E0 and the dispersion energy Ed were deduced. Moreover, the real and imaginary parts of dielectric permittivity as well as the optical parameters of different compounds A2CdCl4, A2CuCl4 and A2Cd0.5Cu0.5Cl4 were determined. It is noted that the synthesized
(C2H5NH3)2CuyCd1�yCl4 compounds (y ¼ 0; 0.5 and 1) have strong absorption in visible and near infrared regions, and the substitution of copper actually improve the conductivity of the obtained material. These properties make these compounds good candidate to photovoltaic applications.
Acknowledgments The financial support of the Ministry of high education and scientific research of Tunisia is acknowledged.
Appendix
bhkl ¼
h�
b2hkl
� Measured
� � 2 � bhkl
i1 2
Instrumental
(1)
R. Lefi et al. / Journal of Alloys and Compounds 696 (2017) 1244e1254
D¼
kl bhkl cosq
(2)
Where D is the crystallite size, bhkl is the full width at half maximum of the diffraction peak, q the Bragg's angle, l is the wavelength of Cuka radiation and k is the shape factor ¼ 0.9.
ε¼
bhkl
bhkl ¼
kl þ 4εtanq Dcosq
bhkl cosq ¼ 4¼
(3)
4tanq
kl þ 4εsinq D
(5)
(6)
D2
(8)
Where A is a constant, hn is the photon energy and Eg is the optical band gap energy.
3 n2 ¼ qffiffiffiffiffi � 2
(9)
Eg 20
Ln aðhnÞ ¼ Lnða0 Þ þ
hn � Eg EU
(10)
where a0 is a constant and EU is the Urbach energy determined through the following equations Eq. (11):
� � d½LnðaÞ� dðhnÞ
ð1 þ RÞ þ n¼ ð1 � RÞ
(11)
"�
ð1 þ RÞ ð1 � RÞ
�2
�
2
� 1þk
#1 � 2
(12)
Where R is the reflectance (R(%) ¼ 100-A(%)-T(%)) and k is the extinction coefficient given by the following equation:
al
4p
2
l
þ
ε1 ðlÞ ¼ nðlÞ2 � kðlÞ2
(17)
ε2 ðlÞ ¼ 2nðlÞkðlÞ
(18)
Ne2 t m*
(19)
Where e is the electron charge and N/m* is the free carriers' concentration-to-effective mass ratio, which can be calculated from the following equations [43]:
ε∞ u2p 4p2 c2
l2
(20)
(7)
ðahn Þ2 ¼ Aðhn � EgÞ
B
(16)
ε1 zε∞ �
Where d is the thickness of sample and T is the transmittance.
n¼Aþ
(15)
εðlÞ ¼ ½ðnÞ � ik�2 ¼ ε1 ðlÞ � iε2 ðlÞ
sdc ¼
1 100 a ¼ ln d Tð%Þ
k¼
S0 l20 � �2 � 1 � ll0
(4)
1
EU ¼
n2 ðlÞ ¼ 1 þ �
1253
C 4
l
þ
D 6
l
þ
E
l8
(13)
Where A, B, C, D and E are the Cauchy's parameters and l is the wavelength.
E E n2 ðlÞ ¼ 1 þ h 0 d i E20 � E2
(14)
Where E ¼ hy is the incident photon energy, E0 is the energy of the effective dispersion oscillator, which is expected to correspond to the photon-energy position of the ultraviolet band gravity center. Ed is the dispersion energy.
ε2 ¼ 2nkz
u2p ¼
ε∞ u2p
l3
8p3 c3 t
4pNe2 ε∞ m*
(21)
(22)
c is the velocity of light in vacuum. References [1] M.F. Mostafa, A. Hassen, Crystal structure and electric properties of the organiceinorganic hybrid: [(CH2)6(NH3)2]ZnCl4, J. Phase Trans. 80 (2006) 302e311. [2] B. Kulicka, R. Jakubas, Z. Ciunik, Structure, phase transitions and molecular dynamics in 4-methylpyridinium tetrachloroantimonate(III), [4-CH3C5H4NH] [SbCl4], J. Phys. Chem. Sol. 65 (2004) 871e879. [3] D. Ionescu, B. Ciobanu, I. Radinschi, Crystal structure and electric properties of the organiceinorganic hybrid: [(CH2)6(NH3)2]ZnCl4, J. Optoelectron. Adv. Mater. 9 (2007) 2608e2614. [4] S. Zhang, G. Lanty, Synthesis and optical properties of novel organiceinorganic hybrid nanolayer structure semiconductors, J. Acta Mat. 57 (2009) 3301e3309. �tude raman du [5] A. Ben Salah, A. Daoud, J.W. Bats, H. Fuess, Structure et e � (C3H7NH3)2HgCl4, J. Solid State Chem. 65 (1986) 151e155. compose [6] D. Ionescu, B. Ciobanu, I. Radinschi, Crystal structure and electric properties of the organiceinorganic hybrid: [(CH2)6(NH3)2]ZnCl4, J. Optoelectron. Adv. Mater. 9 (2007) 2608e2614. [7] M.F. Mostafa, A. Hassen, Phase transition and electric properties of long chain Cd(II) layered perovskites, J. Phase Trans. 79 (2006) 305e321. [8] D. Billing, A. Lemmerer, Synthesis, characterization and phase transitions in the inorganic-organic layered perovskite-type hybrids (CnH2nþ1NH3)2PbI4 n ¼ 4, 5, 6, J. Acta Crystallogr. B 63 (2007) 735e747. [9] T. Maris, G. Bravic, N.B. Chanh, J.M. Leger, “Structures and thermal behavior in the series of two-dimensional molecular composites NH3(CH2)4NH3 MCl4 related to the nature of the metal M. Part 1: crystal structures and phase transitions in the case M ¼ Cu and Pd, J. Phys. Chem. Sol. 57 (1996) 1963e1975. [10] C. Courseille, N. Chanh, Th Maris, Crystal structure and phase transition in the perovskite-type layer molecular composite NH3(CH2)4NH3PbCl4, J. Phys. Stat. Sol. 143a (1994) 203e214. [11] M. Khechoubi, A. Bendani, N. Chanh, C. Courseille, R. Duplessix, M. Couzi, Thermal conformational changes in a bidimensional molecular composite material: a thermodynamic and crystallographic study of NH3(CH2)4NH3CdCl4, J. Phys. Chem. Sol. 55 (1993) 1277e1288. [12] G. Ning, L. Yong-Hua, Z. Guang-Fu, S. Shi-Quan, Structure of 1,3-Propanediammonium tetrachlorocobaltate (II), J. Acta Crystallogr. C 48 (1992) 542e543. [13] J.J. Criado, A. Jimenez-Sanchez, F.H. Cano, R. Saez-Puche, E. Rodrguez- Fernandez, Preparation and characterization of tetrachlorocobaltates(II) of alpha,omega-alkylenediammonium. Magnetic and thermal properties, J. Acta Crystallogr. B 55 (1999) 947e952. [14] D. Mitzi, Templating and structural engineering in organiceinorganic perovskites, J. Chem. Soc. Dalton Trans. (2001) 1e12.
1254
R. Lefi et al. / Journal of Alloys and Compounds 696 (2017) 1244e1254
[15] D. Mitzi, in: K. Karlin (Ed.), Progress in Inorganic Chemistry, Publishing, vol. 48, John Wiley, New York, 1999. [16] A. Kojima, K. Teshima, Y. Shirai, T. Miyasaka, Organometal halide perovskites as visible-light sensitizers for photovoltaic cells, J. Am. Chem. Soc. 131 (2009) 6050e6051. [17] H.-S. Kim, C.-R. Lee, J.-H. Im, K.-B. Lee, T. Moehl, A. Marchioro, S.-J. Moon, €tzel, N.-G. Park, Lead iodide R. Humphry-Baker, J.-H. Yum, J.E. Moser, M. Gra perovskite sensitized all-solid-state submicron thin film mesoscopic solar cell with efficiency exceeding 9%, J. Sci. Rep. 2 (2012) 591. [18] C. Ben Mohamed, K. Karoui, S. Saidi, K. Guidara, A. BenRhaiem, Electrical properties, phase transitions and conduction mechanisms of the [(C2H5) NH3]2CdCl4 compound, J. Phys. B 451 (2014) 8795. [19] C. Ben Mohamed, K. Karoui, Electrical properties and conduction mechanism of [C2H5NH3]2CuCl4 compound, J. Mol. Struct. 1082 (2015) 38e48. [20] E.L. Papadopoulou, M. Varda, K. Kouroupis-Agalou, Undoped and Al-doped ZnO films with tuned properties grown by pulsed laser deposition, J. Thin Solid Films 516 (2008) 8141e8145. [21] L. Motevalizadeh, Z. Heidary, M. Ebrahimizadeh Abrishami, Facile templatefree hydrothermal synthesis and microstrain measurement of ZnO nanorods, Bull. J. Mater. Sci. 37 (2014) 397e405. [22] M. Ali Yıldırım, Aytunç Ates, Influence of films thickness and structure on the photoresponse of ZnO films, J. Opt. Commun. 283 (2010) 1370e1377. [23] B. Amaya Moral, Fernando Rodriguez, Technical note dependence of the charge transfer spectra of (C2H5NH3)2CdCl4: Cu2þ with hydrostatic pressure: structural charges around Cu2þ, J. Phys. Chem. Solids 58 (1997) 1487e1490. [24] R. Yadav, D. Swain, P. Kundu, H.S. Nair, C. Narayana, S. Elizabeth, Dielectric and Raman investigations of structural phase transitions in (C2H5NH3)2CdCl4, J. Phys. Chem. Chem. Phys. 17 (2015) 12207e12214. [25] C.N.R. Rao, Somnath Ganguly, H. Ramachandra Swamy, Infrared studies of the phase transitions of alkylammonium halides, RNH3X, and Bis-(alkylammonium) tetrahalogenome tallates(II), (RNH3MX4, (R ¼ Alkyl, M ¼ Metal, X ¼ Cl or Br), J. Chem. Soc. 77 (1981) 1825e1836. [26] M. Hamdi, A. Oueslati, I. Chaabane, F. Hlel, Characterization and electrical properties of [C6H9N2]2CuCl4 Compound, J. Condens. Matter Phys. (2012) 1e8. [27] A. Goswami, Thin Film Fundamentals, New Age international Pvt. Ltd., 1996, p. 442.
[28] S.R. Jadhav, U.P. Khairnar, Study of optical properties of co-evaporated PbSe thin films, Arch. Appl. Sci. Res. 4 (2012) 169e177. [29] A. Sawaby, M.S. Selim, S.Y. Marzouk, M.A. Mostafa, A. Hosny, Structure, optical and electrochromic properties of NiO thin films, J. Phys. B 405 (2010) 3412e3420. [30] G. Nixon Samuel Vijayakumar, M. Rathnakumari, P. Sureshkumar, Synthesis, dielectric, AC conductivity and non-linear optical studies of electrospun copper oxide nanofibers, Arch. Appl. Sci. Res. 3 (2011) 514e525. [31] A. Jellibi, I. Chaabane, K. Guidara, Spectroscopic ellipsometry and UVevis studies at room temperature of the novel organiceinorganic hybrid of salt Bis (4 acetylanilinium) tetrachlorocadmiate, J. Phys. E 79 (2016) 167e172. [32] N. Ekem, S. Korkmaz, S. Pat, M.Z. Balbag, E.N. Cetin, M. Ozmumca, Some physical properties of ZnO thin films prepared by RF sputtering technique international, J. hydrogen energy 34 (2009) 5218e5222. [33] F. Urbach, J. Phys. Rev. 92 (1953) 1324. [34] B. Abay, S.H. Güder, H. Efeoglu, K.Y. Yogurtçu, Turk. J. Phys. 25 (2001) 543e549. [35] G. Nixon Samuel Vijayakumar, M. Rathnakumari, P. Sureshkumar, Synthesis, dielectric, AC conductivity and non-linear optical studies of electrospun copper oxide nanofibers, Arch. Appl. Sci. Res. 3 (2011) 514e525. [36] H.G. Tompkins, W.A. Mc Gahan, Spectroscopic Ellipsometry and Reflectometry, John Wiley & Sons Inc., New York (, 1999. [37] S.H. Wemple, M. DiDomenico, Theory the elasto-optic effect in nonmetallic crystals, Phys. Rev. B 1 (1970) 193e202. [38] M. DiDomenico Jr., S.H. Wemple, Oxygen-octahedra ferroelectics. I. Theory of electro-optical and nonlinear optical effects, J. Appl. Phys. 40 (1969) 720e734. [39] A. Mhamdi, Study of nickel doping effects on structural, electrical and optical properties of sprayed ZnO semiconductor layers, J. Alloys Compd. 582 (2014) 810e822. [40] A.K. Wolaton, T.S. Moss, Proc. R. Soc. A 81 (1963) 5091. [41] P.A. Lee, G. Said, R. Davis, T.H. Lim, On the optical properties of some layer compounds, J. Phys. Chem. Solids 30 (1969) 2719e2729. [42] M.A. Omar, Elementary Solid State Physics, Addison-Wesley Publishing Company, New York, 1993. [43] M.S. Dresselhaus, Solid state physics part II, Opt. Prop. Solids 6 (2001) 732.