IEEE TRANSACTIONS ON NUCLEAR SCIENCE, VOL. 58, NO. 5, OCTOBER 2011
2341
Study of Different Cool Down Schemes During the Crystal Growth of Detector Grade CdZnTe Santosh K. Swain, Kelly A. Jones, Amlan Datta, and Kelvin G. Lynn
Abstract— crystals were grown using a modified vertical Bridgman growth technique to produce radiation detector grade material. Motivated by the importance of the retrograde solubility problem in II-VI compound semiconductors, particularly CZT, different cool down techniques were used to observe the effects on the secondary phase (SP) size, distribution, density and resulting detector properties. Presented are four of the cool down schemes performed and the results in terms of the secondary phases and charge transport characteristics of the grown crystals. The cooling of the grown ingot to ambient temperatures was done over various lengths of time. The differences between the cool down methods are in the rates of cooling through the retrograde solubility phase. Apart from these cool downs, quenching studies were also performed on some crystal growths giving unique results in terms of the secondary phase distribution and characteristics as radiation detectors.
to achieve inclusion free CdZnTe ingots. Some of them were grown close to stoichiometry with Cd overpressure [6]. In our attempts to achieve close to stoichiometry material, we have added extra cadmium to the charge and manipulated the rates of cooling. Another well known method to eliminate secondary phases is post growth thermal treatment. However, post growth annealing of large volume material requires long times for successful results. Our research was implementation of thermomigration of tellurium precipitates in the presence of a temperature gradient [7], [8] while the ingot was still in the furnace. This is a significant change from the conventional approach of post growth annealing.
Index Terms—CdZnTe detectors, secondary phases, stoichiometry, thermomigration.
All the growths were performed in the modified vertical Bridgman set up. 6N5 grade CdTe+ZnTe, or sometimes CdTe+Zn+Te, purchased from 5 N Plus Inc. was used as the charge material. The presynthesized CdTe, which is tellurium rich by 2500 ppm was used. The exact stoichiometry of the CdTe was not known. The ampoules used for these growths were GE 224 quartz ampoules with a conical tip and 65 mm in diameter. Charge materials, a suitable amount of indium dopant and various codopants [9], were loaded into the ampoule in a clean room. A lid was placed on top of the charge material to partially suppress cadmium evaporation from the ingot during growth. The ampoule was then evacuated and simultaneously baked to remove residual gasses. After a proper vacuum was reached, the ampoule is backfilled with mainly a noble gas and then sealed. The open volume left inside the ampoule was typically 200 . The sealed ampoule was then loaded into the furnace and growth was performed with appropriate growth rate.
I. INTRODUCTION
C
ZT is considered the most promising semiconductor material for the detection of x-rays and -rays at room temperature [1], [2]. Its high resistivity, excellent charge transport properties makes it a suitable candidate for spectrometric applications. However, there have been issues of secondary phase formation in the form of tellurium inclusions which originate as a result of instability at the growth interface and precipitates which form due to the retrograde solid solubility during cool down because of the phase diagram [3]. It has been proven that these secondary phases (SP) adversely affect the detector response by acting as extended defects which can trap or scatter charge carriers and degrade the energy resolution [4], [5]. Small sized inclusions were thought to be unimportant for thinner detectors. However with increased detector thickness, the drift distance of the charge cloud increases and also the number of trapping centers encountered increases, contributing to increased trapping probability. Thus, it is critical to eliminate even small sized inclusions in order to understand better applicability of large volume CZT detectors for homeland security applications. Several attempts have been made
Manuscript received January 05, 2011; revised March 31, 2011 and June 02, 2011; accepted July 03, 2011. Date of publication August 18, 2011; date of current version October 12, 2011. This work was supported by the U.S. Department of Energy, and NA-22 Contracts DE-FG52-06/27497/A000 and DE-FG52-08NA28769. The authors are with the Center for Materials Research, Washington State University, Pullman, WA 99163 USA (e-mail:
[email protected];
[email protected]). Digital Object Identifier 10.1109/TNS.2011.2162077
II. EXPERIMENTS AND RESULTS: GROWTH DETAILS
A. Slow Cooling With Excess Cadmium Two growths, CG92 and CG93(CG No. stands for Crystal Growth, followed by the growth number), were performed with the same growth rate and with the same amount of excess cadmium in the starting charge. The meaning of adding excess cadmium was owing to the fact that the starting CdTe was tellurium rich. Labeling of the ingots is shown in Fig. 1. Four quadrants of the cylindrical ingot are labeled as A, B, C, D. A vertical slice from a specific growth is labeled as CG No.AC1 if the slice is cut along the AC direction with the number after AC denoting the slice number from the ingot periphery. Similarly radial slices are labeled as CG No.R where R1, R2 etc are the slice numbers from near the tip of the ingot. This labeling convention will be maintained through out the article. All the data presented in this article are from measurements on single crystal regions of the ingot. The
U.S. Government work not protected by U.S. copyright.
2342
IEEE TRANSACTIONS ON NUCLEAR SCIENCE, VOL. 58, NO. 5, OCTOBER 2011
Fig. 1. Labeling of vertical and radial slices of an ingot.
TABLE I SECONDARY PHASES AND PROPERTIES OF SAMPLES FROM THE GROWTHS WITH EXCESS CADMIUM AND SLOW COOLING Fig. 2. Representative CG93 respectively.
the average is taken over 7 samples
growths CG92 and CG93 were performed with cool down rates of 14 and 7 , respectively. The temperature at the start of cooling of the grown ingot to room temperature was . While cooling the ingot, the entire ingot was at the same temperature at any point of time. A comparison of the two ingots is summarized in Table I below. From Table I, it can be seen that the cool down with a faster rate helps in reducing the volume % of SP by 5 times. It is believed that the SP that we see are mostly tellurium inclusions, precipitates and voids. IR microscopy can not distinguish between inclusions and voids. Other techniques such as TEM could possibly distinguish them. Only those measuring were considered for our study. Depth of field (DOF) method was used to take the image of each SP. In DOF method, a microscope’s focal plane is moved through the depth of the crystal. DOF applies an automated scheme to capture a picture in Z-direction from the first plane and then move into the crystal to capture the next picture in the second plane. After the microscope’s focus has moved the entire depth of the crystal, it compiles all “in focus” planes into a single picture. Next, the position of the camera shifts to a new xy coordinate and the process
plots for samples from ingots (a) CG92 and (b)
is repeated until the entire CZT piece has been examined. Then the DOF images of entire crystal are tiled together comprise a complete view of all SP in the crystal. Image Pro software was used to count the dark SP in the tiled image and it reports selected parameters such as mean diameter, area, roundness and aspect ratio of the SP. In the analysis, objects are removed which are not SP by the software. These objects can be dark objects such as surface defects or a scratch-like artifact. Data are exported to Origin software and the vol. % and density of the SP can be calculated (estimated) based on mean spherical SP diameter. The mean diameters are calculated by approximating the inclusions to spherical shapes and then taking the statistical mean over the range of the distribution of diameters. In Fig. 2, we show a comparison of the plots for two samples CG92.BC.CD2.B3 and CG93.AB.BC2.B3 from the slowly cooled ingots [Table I]. The values were obtained by determining the bias dependence of the 32 KeV photo peak of source at 1.5 shaping time and fitting the experimental data to single carrier Hecht relation. The samples were 2 mm in thickness. The low value of the applied electric field was chosen to reduce leakage current and to avoid sample break down. B. Faster Cooling In these growths, cooling down the ingot was performed at the rate of 20 C/hr. The cooling rate was different from the quenching in that the cooling was done at a faster and controlled rate unlike quenching where the cooling was controlled by the
SWAIN et al.: STUDY OF DIFFERENT COOL DOWN SCHEMES DURING THE CRYSTAL GROWTH OF DETECTOR GRADE CdZnTe
Fig. 3. plot and the secondary phase distribution of (a) CG59.BD1.C2 (b) CG65.BC1.C4.
thermal conductivity and the heat capacity during the length of quenching. For these growths, we have had consistency in the secondary phase results as well as the performance of the detectors. In Fig. 3, we show the SP distribution and product of
2343
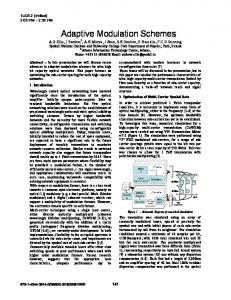
Fig. 4. IR micrograph and secondary phase distribution of CG80: (a) hot side and (b) cold side.
two of the representative samples from the growths done under similar conditions of growth with fast cooling. The volume % of secondary phases were consistently found to be around 0.005 and the values ranging from
2344
IEEE TRANSACTIONS ON NUCLEAR SCIENCE, VOL. 58, NO. 5, OCTOBER 2011
TABLE II TEMPERATURE STEPS DURING GRADIENT COOLING
TABLE III COMPARISON OF RESULTS OF SECONDARY PHASES AND MU-TAU BETWEEN THE HOT AND COLD SIDES OF THE INGOT COOLED DOWN WITH A RADIAL GRADIENT AFTER GROWTH
the average is taken over 4 samples.
Fig. 5. Showing quenching step on the phase diagram of CZT with 10% Zn [10].
. The bulk resistivities of all the samples were . C. Cool Down With Radial Gradient Cool down was performed with a gradient in these growths. After growth was completed, a radial gradient of was maintained in two steps across the diameter of the ingot and was held for about 400 hrs in each step before reduced to room temperature. Table II illustrates the details of the temperature steps. The colder side of the ingot was at a temperature higher than the melting point of tellurium in each of the two steps. This was done with the intention of realizing thermomigration of tellurium in the presence of a radial temperature gradient. The results of the experiment are summarized in Table III. From the above data, it is clear there is an appreciable difference in the volume % and density of SP between the hot and cold sides. In Fig. 4, we have shown the IR micrograph and the distribution of SP on the hot and cold sides. There is not a significant difference in the mean diameter and values on both
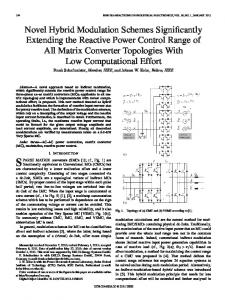
Fig. 6. Secondary phase distribution and sample in the bulk.
plots of (a) edge sample (b)
sides. It can be seen that the values reported for this cooling method are relatively lower than the values from other cooling techniques. However, it should be noted that, this could be the property of the specific crystal.
SWAIN et al.: STUDY OF DIFFERENT COOL DOWN SCHEMES DURING THE CRYSTAL GROWTH OF DETECTOR GRADE CdZnTe
We see a bimodal distribution in the volume % of secondary phases in this case. The mean diameter value reported here was calculated as an arithmetic mean over the full range of SP diameters. D. Cool Down With Quenching The ingots were cooled after growth suddenly to a temperature below the retrograde part of the phase diagram. The idea was to quench through the retrograde solubility part (Fig. 5). In Fig. 4, our quenching step is shown on the T-X projection of the phase diagram for . Strictly speaking, the furnace was supplied with no power from the initial and final temperature of quenching until it reached the final quenching temperature set point unaided, which takes 2 hrs. After the final quenching temperature was reached, the ingot was uniformly cooled down to room temperature at 25 . The results of IR analysis showed a significant difference in the volume % of secondary phases between the edge and the center of the ingot. In Fig. 6, we show the secondary phase distribution and the representative plots for samples from the edge and the center of the ingot. The above results indicated quenching the ingot after growth were successful in reducing the secondary phases near the edge of the ingot by an order of magnitude and also reducing the sizes of the inclusions near the edge relative to the bulk of the ingot. Other samples in the similar region exhibited similar distribution. Different regions of the ingot had single maxima distributions with varying mean diameters. This can be explained by the fact that the effect of quenching was maximum near the edge. The secondary phases correlate with the product of the samples. The bulk resistivity values of the samples from the ingot were . Furthermore the quenched ingots didn’t show any cracks and were stable with time. III. SUMMARY AND CONCLUSION From the above results, it is clear that cool down time has an appreciable effect on the secondary phases and in turn on the detector properties. Growths with excess cadmium and different cool down rates indicated it was possible to achieve near stoichiometric growth with an optimal choice of cool down rate. However, truly excess cadmium growths would typically make the samples go lower in resistivity. Hence, it is a challenge to grow stoichiometric CZT without affecting the compensation properties. It is worth mentioning that there was a certain degree
2345
of inaccuracy in the stoichiometry of the starting CdTe charge. Cool down with a radial gradient in order to realize thermomigration of tellurium over a large dimension of the samples has proven to be time consuming and post processing may not be a cost effective idea particularly when high yield is concerned. Quenching the ingot after growth is seen to provide promising results; however, the largest effect was limited to the edge of the ingot where it was detached from the crucible. Currently, we are experimenting on other novel cool down programs combining our understanding from each of the above cool down techniques. ACKNOWLEDGMENT The authors would like to thank Sachin Bhaladhare and Raji Soundararajan of WSU for helping in the measurements on the sample. REFERENCES [1] C. Szeles, “CdZnTe and CdTe materials for X-ray and gamma ray radiation detector applications,” Phys. Stat. Sol. (b), vol. 241, no. 3, pp. 783–790, 2004. [2] T. Takahasi and S. Wantabe, “Recent progress in CdTe and CdZnTe detectors,” IEEE Trans. Nucl. Sci., vol. 48, no. 4, pp. 950–959, Aug. 2000. [3] P. Rudolph, “Non-stoichiometry related defects at the melt growth of semiconductor compound crystals-a review,” Cryst. Res. Technol., vol. 38, no. 7–8, pp. 542–554, 2003. [4] G. A. Carini, A. E. Bolotnikov, G. S. Camarda, G. W. Wright, R. B. James, and L. Li, “Effect of Te precipitates on the performance of CdZnTe detectors,” Appl. Phys. Lett., vol. 88, no. 14, p. 143515, 2006. [5] A. E. Bolotnikov, G. S. Camrda, G. A. Carini, Y. Cui, K. T. Kohman, L. Li, M. B. Salomon, and R. B. James, “Performance-limiting defects in CdZnTe detectors,” IEEE Trans. Nucl. Sci., vol. 54, no. 4, pp. 821–827, Aug. 2007. [6] J. Franc, P. Moravec, P. Hlidek, E. Belas, P. Hoschl, R. Grill, and Z. Sourek, “Development of inclusion-free CdZnTe substrates from crystals grown by the vertical-gradient freeze method,” J. Electron. Mater., vol. 32, no. 7, pp. 761–765, 2003. [7] H. R. Vydyanath, J. A. Ellsworth, J. J. Kennedy, B. Dean, C. J. Johnson, G. T. Neugebauer, J. Sepich, and P.-K. Liao, “Recipe to minimize Te precipitation in CdTe and (Cd, Zn)Te crystals,” J. Vac. Sci. Technol. B, vol. 10, no. 4, pp. 1476–1484, 1992. [8] H. R. Vydyanath, J. A. Ellsworth, J. J. Kennedy, B. Dean, C. J. Johnson, G. T. Neugebauer, J. Sepich, and P.-K. Liao, “Thermomigration of Te precipitates and improvement of (Cd, Zn)Te substrate characteristics for the fabrication of LWIR (Hg, Cd)Te photodiodes,” J. Electron. Mater., vol. 22, no. 8, pp. 1073–1080, 1993. [9] K. Lynn, K. Jones, and G. Ciampi, “Compositions of doped, co-doped, and tri-doped semiconductor materials,” U.S. Patent Application Serial No. 11/910,504, filed 10/2/2007. [10] V. N. Guskov, J. H. Greenberg, M. Fiederle, and K. W. Benz, “Vapour pressure investigation of CdZnTe,” J. Alloys Compounds, vol. 371, pp. 118–121, 2004.