SILVA FENNICA
Silva Fennica 44(4) research articles www.metla.fi/silvafennica · ISSN 0037-5330 The Finnish Society of Forest Science · The Finnish Forest Research Institute
Sub-Montane Norway Spruce As Alternative Seed Source for a Changing Climate? A Genetic and Growth Analysis at the Fringe of Its Natural Range in Austria Eduard Schiessl, Michael Grabner, Gerald Golesch, Thomas Geburek and Silvio Schueler
Schiessl, E., Grabner, M., Golesch, G., Geburek, T. & Schueler, S. 2010. Sub-montane Norway spruce as alternative seed source for a changing climate? A genetic and growth analysis at the fringe of its natural range in Austria. Silva Fennica 44(4): 615–627. Insights into the intraspecific variation in climate response of forest trees and the utilization of suitable seed sources are required to maintain forest ecoystems under expected climate change. Individuals of Norway spruce with an anomalous spherical-shaped crown were characterized by genetic (using a mtDNA marker) and dendroclimatic analysis. Such trees occur frequently at the fringe of the spruce distribution in east/south-east Austria. We employed pair-wise comparisons between trees with spherical and “regular” conical crowns on 47 sites. No evidence was found for a different phylogeographic history of spherical and conical spruces, but the high allelic diversity at the nad1 locus highlighted the importance of east/south-east Austria as refugium and migration corridor for Norway spruce. Analysis of mean annual increment revealed a larger amount of earlywood within the sapwood area and fewer negative pointer years for spherical spruces than for conical ones, pointing at a higher vitality and smaller interactions between climate and growth for spherical spruces. Although the results cannot explain the anomalous crown form, they suggest spherical trees to have a higher ability to cope the warm and dry climate of the region than “regular” conical spruces. We discuss the origin of spherical crowns in terms of population history and phenotypic plasticity and speculate on possible effects of crown architecture on canopy-atmosphere exchange. Keywords climate-growth response, crown type, rear edge, mitochondrial DNA, Picea abies Addresses Schiessl, Golesch, Geburek and Schueler, Department of Genetics, Research and Training Centre for Forests, Natural Hazards and Landscape, Hauptstraße 7, A-1140 Vienna, Austria; Grabner, Department of Material Sciences and Process Engineering, Institute of Wood Science and Technology, University of Natural Resources and Applied Life Sciences, Peter-Jordan-Straße 82, A-1190 Vienna, Austria E-mail
[email protected] Received 10 November 2009 Revised 7 June 2010 Accepted 8 October 2010 Available at http://www.metla.fi/silvafennica/full/sf44/sf444615.pdf
615
Silva Fennica 44(4), 2010
1 Introduction The consequences of climate change to forest ecosystems and the mitigation of negative effects to ecosystem functions including wood production are major challenges of current forest science and management (Prentice et al. 1993, Lindner 1999, Maracchi et al. 2005). Among different silvicultural measures, planting of alternative tree species or different provenances better adapted or having a higher potential for adaptation to expected climate conditions has been discussed (species: e.g. Berry et al. 2002, Hamann and Wang 2006; provenances: e.g. Matyas 1996, Rehfeldt et al. 1999, Bradley St. Clair and Howe 2007). To identify those provenances, long-term common garden experiments in strongly differing climates are required (e.g. Rehfeldt et al. 2001). However, such trials are not available for most tree species. Alternatively, appropriate provenances might be found at fringe of the species’ natural range. Populations growing in these areas are typically exposed to more extreme environmental conditions than those in the centre of the distribution. With respect to the phylogeographic distribution of a species and its postglacial migration
a)
research articles
routes, Hampe and Petit (2005) differentiate between populations at the northern-oriented leading edge (colonization front), and the rear edge, which is the eroding range margin at its southerly distribution limit. For future climate scenarios, mainly populations from the rear edge are considered as important. They are typically small, restricted to particular habitat patches, and expected to be more selected to local adaptation than for generalism, because of their long-term persistence to suboptimal growing conditions (Dynesius and Jansson 2000, Hampe and Petit 2005). These characteristics fit well to existing populations of Norway spruce (Picea abies [L.] Karst.) in the hilly countryside of east and south-east Austria (Fig. 1). The forest growth and provenance regions located here (Kilian et al. 1994) are characterised by low precipitation and long-standing drought periods (e.g. Auer et al. 2005, Efthymiadis et al. 2006, Nobilis and Godina 2006) affecting growth and survival of Norway spruce and limit its natural distribution. Recent paleobotanical studies of pollen and macrofossils demonstrate the existence of refugial populations of Norway spruce in the region of the East and South-east Alpine Foreland as well as in
b)
16E
47N
Fig. 1. Location of the study region in Austria (a) and position of the sample sites (b). The natural distribution of Norway spruce in Austria is indicated by the grey shading in b).
616
Schiessl et al.
Sub-Montane Norway Spruce As Alternative Seed Source for a Changing Climate? …
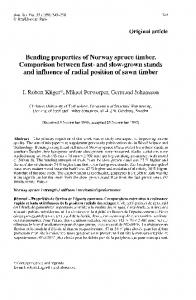
Fig. 2. Typical spherical (left) and conical (right) spruce trees for comparison.
the adjacent Hungarian/Danubian bassin (Ravazzi 2001, Terhürne-Berson 2005). Extensive field observations on Norway spruce in east/southeast Austria also revealed a high diversity of tree morphotypes (Fig. 2). In particular, the frequent occurrence of crowns with a distinctive spherical shape, contrary to the typical conical shape, has attracted interest, because such trees seemed to be more vital during drought events than conical ones (Pollinger personal comm.). However, whether this crown diversity is due to genetically determined provenance or progeny variation or to phenotypic plasticity is unknown. In general, spruce species exhibits a high plasticity in many characters, e.g. branching pattern (e.g. Sylvén 1909, Gruber 1988, Geburek et al. 2008), growth rhythm and frost hardiness (e.g. Johnsen 1989, Skroppa 1994), or needle morphology and photosynthesis (e.g. Ishii et al. 2007 in Picea jezoensis). On the other hand, provenance and progeny specific crown types were also observed (e.g. Holst and Teich 1969, Colin et al. 1993 in Picea glauca). The aim of the present study is to test whether spruces with spherical crowns are individuals of
‘rear edge’ populations and really better adapted to the unfavourable conditions at low elevations. Our first hypothesis is that spherical trees are descendants of the former refugia while conical trees occurring in the same region are presumably allochthonous. This will be tested by comparing the descendance of spherical trees to conical trees by means of a maternally inherited mitochondrial marker. Secondly, we hypothesise that spherical trees are better adapted to the unfavourable mild climatic condition of the region than conical trees. Therefore, we study growth behaviour and the interaction between tree vigour and climate of both crown types.
2 Materials and Methods 2.1 Sites and Tree Samples During regular visits of forest seed production stands in east and south-east Austria a number of spherical spruces as single trees or groups has been identified visually (see Fig. 2 for typical pictures of spherical and conical trees). In order to 617
Silva Fennica 44(4), 2010
confirm the spherical crown character, a variety of crown parameters have been measured and compared with “regular” conical trees growing on the same site, under the same silvicultural management and the same stand density. Throughout the study, these tree pairs were used for morphological, genetic, and dendroclimatic analysis. For the present study, 47 sites with 58 spherical trees were selected. The sites are located from 15.2–16.3°E and from 46.7–47.6°N (Fig. 1). All sites are located within a rural landscape consisting of cultivated fields and forests. Forests are managed extensively by small-scale farmers, mainly for the production of fire wood. All sites are mixed stands of coniferous and broadleaved trees (Fagus sylvatica, Quercus robus, Fraxinus excelsior). For none of the stands a continous forest management plan exists. The predominant silvicultural system is selective logging of single trees. Soils are cambisols with a clayic and siltic character and an estimated pH-value between 6 and 7. The elevation of the sites varied between 300 and 650 m above sea level. To each single or group of spherical spruces one conical spruce from the same location was used for comparison (in total, 47 conical spruces). Criteria for the selection of tree pairs were: i) height (± 20% difference), ii) diameter at breast height (d.b.h. ± 30% difference), iii) geographical distance (max. 100 m), and iv) both trees should belong to the same dominance class. Since the sampling focused on spherical trees in few cases we could not find a comparable conical tree in close proximity to the chosen spherical spruce. In such cases, smaller and very likely younger trees were chosen for comparison. Trees affected by biotic harming exciters (e.g. Sirococcus conigenius [DC.], Pucciniastrum epilobii [Pers.], Pristiphora abietina [Christ]) were excluded. Overall, the selection of tree pairs aimed at finding comparable trees for which the soil and site characteristics and the forest management was the same. 2.2 Tree and Crown Morphology For each tree (spherical and conical spruces), a range of parameters has been determined: diameter at breast height (dbh – measured in a height of 130 cm), height (ht – measured with a Fores618
research articles
tor Vertex, Haglöf Sweden), the height of start of crown (hc – measured with a with a Forestor Vertex at the lowest green branches), crown length (cl = ht – hc), crown width (cw – measured as a projection of the maximum width), and the canopy dominance class according to Kraft (1884). These measures were used to calculate several indicators of tree crown structure: first, the crown ratio cr = cl / ht, second, the height to diameter at breast height ratio hdr = 100 * ht / dbh, third, the crown thickness index cti = cw / cl, and fourth, the crown spread index csi = cw / ht. T-tests were used to test for differences between spherical and conical trees. 2.3 Genetic Analysis To infer the ancestral history of spherical spruces, variation in the fragment length of the mitochondrial gene locus nad1 (Sperisen et al. 2001) was analysed. Due to the maternal inheritance (Grivet et al. 1999) and the low sequence evolution of the mitochondrial genome (Palmer 1992) this locus is known to provide information on postglacial migration of Norway spruce (see also Gugerli et al. 2001, Tollefsrud et al. 2008). The genomic DNA was extracted from needle tissue using DNeasy plant minikit (QUIAGEN). PCR and enzyme restriction was done according to Sperisen et al. (2001). Fragments were analysed using the capillary electrophoresis system CEQ 8000 - Genetic Analyzing System (BeckmannCoulter). 2.4 Dendrochronological Analysis The analysis of dendrochronological and dendroclimatic parameters unfolds a subset of 30 pairs of trees, where forest owners agreed on the drilling of the stem. From each tree, two cores were taken at right angle to each other in a height of 130 cm.
2.4.1 Radial Growth and Sapwood Area The sapwood area was determined on basis of differences in translucence immediately after getting
Sub-Montane Norway Spruce As Alternative Seed Source for a Changing Climate? …
2.4.2 Climate Response and Pointer Year Analysis Climate response of both crown types was analysed by response and correlation functions considering monthly precipitation and mean temperature data for August of the preceding year to September of the current year as independent climate variables.
20
125
Prec. Bernstein Temp. Sopron
16
100
12
75
8
50
4
25
0
0 J
-4
Precipitation (mm)
the core (Münster-Swendsen 1987). Early- and latewood, as separated according to qualitative aspects by one single person, was measured microscopically with the measurement device Lintab (Rinntech). Data were processed with the software TSAP (Rinn 1996). Absolute dating was synchronised by software Cofecha (Holmes 1994). In addition to the annual ring width, as indicator of tree vigour we calculated the total area of the earlywood within the sapwood area (hereafter referred to as early sapwood) by summing up the earlywood area of each tree ring within the sapwood region (Waring et al. 1980, Eckmüller and Sterba 2000). According to Eckmüller and Sterba (2000), early sapwood is strongly correlated to needle biomass and foliage and can therefore be used as good indicator for tree vigour and vitality. For each crown type, arithmetic means of annual increment and the early sapwood were calculated. Since tree pairs from a single location could show age differences (see above), we compared the mean ring width according to the cambial age of the trees. The analysis of radial growth within a defined age class, i.e. according to the cambial tree age, has the advantage that the age trend towards declining radial growth is eliminated and trees or groups of trees with different real ages can be compared (Barnett and Jeronimidis 2003, Grabner 2005). If the defined cambial age period is large enough (> 10 years) also the effect of different weather conditions during the various growth period can be neglected. We defined three different cambial age classes: 1) the entire growing period available for each sample, 2) the cambial age period of 20 to 35 years representing the growth at the pole wood stage, and 3) the age period of 60 to 75 years representing adult growth.
Temperature (°C)
Schiessl et al.
F
M
A
M
J
J
A
S
O
N
D -25
Fig. 3. Climate diagram of the closest meteorological stations where homogenized data of temperature (Sopron: 16.6°E, 47.68°N) and precipitation (Bernstein: 16.26°E, 47.35°N) were available (Auer et al. 2005).
Response functions are a multiple regression technique were the principal components (PC) of the monthly climate data are being used to estimate indexed values of ring width (Fritts 1976, Fritts and Wu 1976). The obtained regression coefficients are multiplied with the PC of climate to obtain an improved set of regression coefficients in relation to the original climate. Correlation functions are the temporal sequence of univariate correlation coefficients using Pearson’s correlation between the monthly climate data and the tree ring chronologies (Biondi 1997). To derive response and correlation functions, the long-term growth trend of the tree ring data was eliminated with a spline-function of 30 years base length in the software Arstan (Cook 1985). Response and correlation functions were exclusively calculated for the Northern sub-sample (located from 15.8– 16.3°E and from 47.1–47.6°N), because here climate strongly limits the spruce distribution. This sub-sample contained 30 spherical and 20 conical spruces. Using the variability between individual trees, the significance of the response and correlation functions (95% confidence limits based on a 1000 bootstraps) were calculated with DendroClim2002 (Biondi and Waikul 2004). Meteorological stations chosen due to their geographic proximity and availability of homogenized data (ZAMG: Auer et al. 2005) provided the precipitation and temperature data (Fig. 3). Temperature data were taken from the station Sopron (Location 16.6°E, 47.68°N), where the mean annual 619
Silva Fennica 44(4), 2010
3 Results
0.5
a)
Frequency
0.4 0.3 0.2 0.1 0.0
= 30
30-45
45-60
60-75
75-90
> 90
32-36
>36
100-120
>120
dbh classes [cm]
0.5
b) Frequency
0.4 0.3 0.2 0.1 0.0
= 20
20-24
24-28
28-32
Height classes [m]
0.5
c)
0.4 Frequency
temperature is 9.7 °C and the mean temperature in the vegetation period (May–August) 17.8 °C. The meteorological station Bernstein (Location 16.26°E, 47.35°N) provided precipitation data with average precipitation of 817 mm per annum and 502 mm in the vegetation period. Another method to investigate intraspecific differences in annual growth reactions is pointer year analysis. Pointer years are defined as years, where rapid changes in environmental conditions cause remarkable annual growth reactions (Neuwirth et al. 2004, Schweingruber et al. 1990). Therefore, for each individual tree ring widths were transformed into z-values using the equation: RWz = (RWt – RWn) / SDn (Cropper 1979). Here, RWz is the z-value of the year t, RWt represents the total ring width of the year t, RWn is the mean ring width averaged for a window of 5 years and SDn stands for the standard deviation of the same 5 years. This transformation deleted the age trend and harmonized means and standard deviations. Due to the distribution of tree pairs over a wider region instead of single stands, positive pointer years were defined for z-values > 0.75 and negative pointers for z-values 0.75, respectively