(440 MHz) with a resolution of 3 m in range and 6 m in az- imuth [38]. .... regions (including subsurface scattering caused by buried pa- leosoils) should appear ...
IEEE TRANSACTIONS ON GEOSCIENCE AND REMOTE SENSING, VOL. 39, NO. 6, JUNE 2001
1245
Subsurface Structures Detection by Combining L-Band Polarimetric SAR and GPR Data: Example of the Pyla Dune (France) Gilles Grandjean, Philippe Paillou, Member, IEEE, Pascale Dubois-Fernandez, Thomas August-Bernex, Nicolas N. Baghdadi, and José Achache
Abstract—In this paper, we investigate the penetration capabilities of microwaves, particularly at L-band, for the mapping of subsurface heterogeneities such as lithology variations, moisture or sedimentary structures. The experiment site, the Pyla Dune, is a bare sandy area allowing high signal penetration and presenting large subsurface structures (paleosoils) at varying depths. Several radar data sets over this area are available. A polarimetric analysis of airborne synthetic aperture radar (SAR) data as well as the ground penetrating radar (GPR) sounding experiment show that subsurface scattering occurs at several places. The SAR penetration depth is estimated by inverting a scattering model for which the subsurface structure geometric and dielectric properties are determined by the GPR data analysis. These results suggest that airborne radar systems in a lower frequency range (P-band) should be able to detect subsurface moisture down to several meters, leading to innovative Earth observation systems for hydrogeology in arid regions. Index Terms—Airborne SAR, ground-penetrating radar (GPR), low-frequency radar, penetration in soils, polarimetry.
I. INTRODUCTION
I
N THE last ten years, microwave remote sensing techniques have provided unexpected insights into the Earth’s surface structure and processes, and triggered the development of entirely new research fields in geodynamics. For instance, spaceborne synthetic aperture radar (SAR) has provided measurements of ground geometry and surface displacement with unprecedented accuracy. The characterization of surface parameters using polarimetry is another demonstrative example. Using spaceborne SAR (e.g., SIR-C/X-SAR, JERS-1, ERS-1/2, RADARSAT), three characteristics of the Earth’s surface can, in principle, be observed: 1) the slope, i.e., the topography; 2) the surface roughness determined by vegetation cover or geology and erosion processes in arid areas; and 3) the dielectric properties mainly related to soil moisture [36]. Over arid areas, low-frequency electromagnetic waves can penetrate down to several meters, allowing probing of the subsurface [16]. So far, this technique has drawn little interest in the radar remote sensing community, but could be useful for accurate mapping Manuscript received May 29, 2000; revised December 13, 2000. G. Grandjean and N. N. Baghdadi are with BRGM, 45060 Orléans, France. P. Paillou and T. August-Bernex are with the Observatoire de Bordeaux, 33270 Floirac, France. P. Dubois-Fernandez is with Délégation Générale pour 1’Armement (DGA), 94114 Arcueil Cedex, France. J. Achache is with CNES, 75036 Paris Cedex 01, France. Publisher Item Identifier S 0196-2892(01)04844-6.
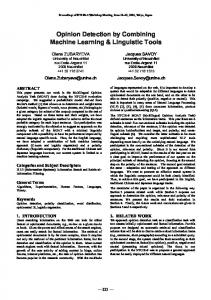
and characterization of subsurface structures, e.g., the detection of subsurface moisture. SAR penetration effects were previously observed from SIR-A data by Schaber et al. [31] in the southern part of Egypt. In this study, depths of penetration down to 1.5 m were estimated, in good agreement with attenuations deduced from dielectric measurements. In the same way, Berlin et al. [5] found that radar wave penetration was larger than 1 m by comparing SIR-B data to field observations in Saudi Arabia. Farr et al. [18] also estimated skin depths between 0.5 and 1.7 m by studying L-band backscattering of buried receivers in the Nevada desert. Later, Abdelsalam et al. [1] and Dabbagh et al. [11] used SIR-C/X-SAR data in, respectively, NE Sudan and Arabia and showed that depth of penetration was of the order of several meters. Finally, combining X-, C-, and L-bands, Schaber et al. [32] clearly showed the power of multifrequency polarimetric data analysis, particularly with the cross-polarized HV component in low-frequency range, for geologic mapping below sandy materials. Each of these experiments demonstrated the capability of microwaves to detect subsurface geologic features like relic fluvial channels buried under a few meters of sand. These observations were supported either by field excavations or by laboratory permittivity measurements of soil samples, leading to calculations of radar waves attenuation. Field measurements were collected at a limited number of points through a destructive approach (i.e., excavation) of the overlying [18], [31]. To avoid such drawbacks, an alternative method based on ground penetrating radar (GPR) was developed. This geophysical sounding technique is used here to detect soil dielectric discontinuities, features potentially causing subsurface scattering on SAR images. A more quantitative approach is also developed to estimate dielectric parameter distributions as a function of depth by matching observed GPR profiles to simulated ones, the resulting dielectric model being used as an input in SAR scattering models. The results presented here concern the Pyla dune near Bordeaux in France (Fig. 1). This area was the test site for the sounding radar of the Mars 96 Mission [4]. It covers an area km, reaches 100 m height, and is mainly of about composed of sand. This material comes from the erosion of the Pyrénées and the Massif Central via the Aquitanian coastal rivers. The geometry of the dune has evolved in time according the meteorological effects, especially the wind, so that the dune system has built from the sea to the land through long cycles. During the quiet periods, vegetation grew on the dune surface and fixed the sand. Then, during the more active periods, the
0196–2892/01$10.00 © 2001 IEEE
1246
IEEE TRANSACTIONS ON GEOSCIENCE AND REMOTE SENSING, VOL. 39, NO. 6, JUNE 2001
II. SAR POLARIMETRIC STUDY Two airborne L-band SARs were considered: the US AIRSAR system developed by NASA/JPL, and the French RAMSES system developed by ONERA and DGA. Both provide polarimetric data (HH, HV/VH, and VV polarizations) with high spatial resolution. AIRSAR resolution (about 6 m) is not fine enough to clearly identify paleosoils under the sand. With a higher spatial resolution (0.8 m), RAMSES data provides evidence associating subsurface scattering areas to paleosoil structures. (a)
A. AIRSAR
(b) Fig. 1. (a) View of the Pyla dune and (b) the location map of the studied area comprised inside the white bounding box. The GPR profile (black line) and the CMP measurement (black circle) are indicated.
sand covered the vegetation layer, producing paleosoils. The resulting dune system causes important damages as it progressively migrates over the forest and buildings located downwind. This area is particularly suitable to radar sounding experiments, as it is mainly composed of a low loss sandy material, allowing high signal penetration. This site has been imaged by two airborne SARs: 1) the French RAMSES system and 2) the US AIRSAR one, which both provided calibrated polarimetric data. In this paper, we first present the polarimetric analysis of AIRSAR and RAMSES data, followed by a description of the field campaign carried out in order to measure surface roughness profiles and record GPR sections. The subsurface structures detected by GPR are then shown to be in agreement with the subsurface scattering component observed through the polarimetric data analysis and a description of the technique used to characterize the geometric and dielectric properties of the subsurface structures from GPR data is given. Based on the comparison between the RAMSES co-polarized radar return and the result of a two-layer scattering model, an estimation of L-band radar performance to penetrate sandy soils is proposed and discussed.
AIRSAR operates C-(5 GHz), L-(1.25 GHz), and P-bands (440 MHz) with a resolution of 3 m in range and 6 m in azimuth [38]. The P-band data could not be analyzed because of strong signal interference probably caused by a near-by surveillance radar, but a polarimetric analysis of C and L-band data was performed. Data were acquired during June 1991, with an incidence angle with respect to the local vertical ranging from 30 (near range) to 53 (far range), a track angle (flight heading) of 132 N, and are calibrated. Fig. 2 presents HH and HV polarization image for C- and L-bands. The Landes forest is bright (top of the images), the ocean surface appears dark (lower part of the image), and the Pyla dune presents a low backscattered signal because of its smooth surface. Co-polarized signal contains both surface and nonsurface scattering components, whereas the nonsurface scattering component, i.e., subsurface and volume scattering components, is the main contributor of the cross-polarized signal. Structures in the sandy area appear slightly in the L-band HV image [Fig. 2(d)] and are thought to be mainly related to paleosoils which present a strong permittivity contrast with the sand, because they behave like moisture tanks (cf. permittivity measurements presented hereafter). These structures produce a strong depolarization of the incident wave, leading to a significant HV or VH return, as can be seen in RAMSES high-resolution images [cf. Fig. 4(c)]. Pure volume scattering occurring in the upper sand layer appears to be weak since the material is homogeneous and has a low permittivity. The C-band HV image of the sand dune in Fig. 2(b) corresponds to an homogeneous area with very low backscattered power, while the L-band HV image shows weak linear structures parallel to the coastline [see the right part of the dune in Fig. 2(d)]. These structures are interpreted to be the paleosoils seen under the superficial sand layer, indicating a deeper penetration at L-band than at C-band. A polarimetric analysis of C- and L-band data was performed to detect regions where pure surface scattering is not the main contributor to the signal (i.e., where volume and subsurface scattering occurs). Such areas should appear in both HH and HV images, since HH contains both surface and nonsurface components and HV mainly shows volume and subsurface scattering. It should be noticed that pure volume scattering presents a HV/HH ratio of around 1:3 and correspond to a low HH-VV correlation [30]. Fig. 3 shows the HV/HH ratio image and the HH-VV correlation image for both C- and L-bands. The C-band HV/HH ratio in Fig. 3(a) looks evenly distributed with low values, indicating
GRANDJEAN et al.: SUBSURFACE STRUCTURES DETECTION
1247
Fig. 2. AIRSAR image of the Pyla dune: (a) C-HH, (b) C-HV, (c) L-HH, and (d) L-HV. Image orientation is 132 N and image width is 3700 m.
Fig. 3. HV/HH ratio for (a) C-band and (b) L-band, and HH-VV correlation for (c) C-band and (d) L-band. Image orientation is 132 N and image width is 3700 m.
that surface scattering occurs for all area types (forest, sand, water). Fig. 3(b) shows a higher L-band HV/HH ratio for the forest (mean value of 0.31), a lower value for the water surface, and one can observe some weak structures in the sand dune. In the same way, Fig. 3(c) shows a rather uniform high correlation between HH and VV channels, indicating that mostly surface scattering occurs at C-band. However, one can observe a brighter region corresponding to the ocean and a darker region corresponding to the sand dune in Fig. 3(c). The L-band correlation image in Fig. 3(d) presents a strong contrast between the forest at the top (mainly volume scattering, mean value of 0.36) and the ocean at the bottom (pure surface scattering, mean value
of 0.82). The sand dune shows a mixture between high and low HH-VV correlation, indicating that nonsurface scattering occurs at some places. The resolution of AIRSAR is not fine enough to clearly identify subsurface scattering occurrences and relate them to paleosoils, but the polarimetric analysis shows that nonsurface scattering occurs over the sand dune for L-band data. B. RAMSES The RAMSES L-band (1.6 GHz) image of the Pyla dune is shown in Fig. 4 [7]. It was acquired in June 1998 with an incidence angle with respect to the local vertical ranging from 52
1248
IEEE TRANSACTIONS ON GEOSCIENCE AND REMOTE SENSING, VOL. 39, NO. 6, JUNE 2001
Fig. 4. Aerial photography of (a) the Pyla dune (source IGN), and RAMSES L-band image of the dune for (b) HH polarization and (c) HV polarization. Image orientation is 20 N and image width is 800 m.
(near range) to 59 (far range) and a heading of 20 N, and is calibrated. The resolution is 0.7 m in range and 0.9 m in azimuth. The finer resolution here allows clear observation of some subsurface structures in the dune [cf. Fig. 4(c), the vertical bright line in the middle of the dune is an artifact due to some frequency interference]. As for AIRSAR data, a polarimetric analysis was performed to characterize the electromagnetic interaction and to detect regions where subsurface scattering occurs. Results are presented in Table I. Forest zones present large depolarization ratios (HV/HH and VH/VV) around 0.5 and a flat phase difference distribution; this is coherent with random volume scattering. The ocean presents a typical surface scattering behavior, i.e., no phase difference between HH and VV, and a stronger VV return which produces a lower VH/VV polarization ratio. The dune area presents a nonuniform behavior and representative test zones were selected: “Dune” for the very weak backscatter areas (smooth and thick sand layers); “Alios” for the bright line running parallel to the coast line (it is the first stratum under the dune, which is made of very wet iron-rich vegetation fragments); and “Paleosoil” for the linear structures corresponding to paleosoil outcrops. “Dune” zones correspond to the sum of a weak surface scattering and a weak volume scattering process in the upper sand layer with a depolarization ratio around 1:3. for smooth and The phase difference distribution sandy areas is Gaussian, and is consistent with previous experimental studies [37]. Depolarization ratio VH/VV for paleosoil corresponds to intermediate values between surface and volume scattering, indicating that non pure surface scattering occurs here. These areas correspond in fact to subsurface scattering zones, as confirmed by GPR measurements presented hereafter. The alios soil, corresponding to the bright vertical line on the
left in Fig. 4(c), gives poor depolarization ratios and a rather low phase difference. A systematic analysis was done to draw a map of nonsurface scattering regions. Fig. 5 presents results for the southern part of the Pyla dune (North is to the top). HH image in Fig. 5(a) presents both surface and nonsurface scattering components, whereas HV image in Fig. 5(b) mainly shows volume and subsurface scattering (one can check that the forest presents a strong HV return, and paleosoils covered by sand are visible in the lower part of the dune). Fig. 5(c) and (d) show the HV/HH depolarization ratio image and the HH-VV correlation image, respectively. One can observe some linear structures only due to surface scattering [dark lines in Fig. 5(c) and corresponding bright lines in Fig. 5(d)]. Considering that nonsurface scattering regions (including subsurface scattering caused by buried paleosoils) should appear in both HH and HV images, that they should have a higher HV/HH ratio and correspond to a lower HH-VV correlation, we combined these conditions to hold the “nonsurface scattering map” presented in Fig. 5(e). The NE-oriented bright line at the bottom of the dune in Fig. 5(e) corresponds to a buried paleosoil that was selected for the GPR fieldwork. The paleosoil width appears to be much larger in HV radar image [Fig. 4(c)] than in the aerial photography [Fig. 4(a)]: it means that we are able to see a subsurface structure under the sand using the L-band SAR. Another interesting phenomena is shown in Fig. 5(f): the nonsurface scattering regions in the Pyla dune correspond to particular values for the phase difference between HH and VV signals. We focused on the NE-oriented structure in the southern part of the dune, where sand covers a paleosoil [cf Fig. 5(b) and (e)]. We studied the phase difference between HH and VV signals for this area and results are presented in Fig. 6. The phase difference, equal to zero for the ocean, presents a strong increase for the first ten meters after the point where paleosoil outcrops. The location of the outcrop corresponds to a peak in the HH is about 25 and and HV images. The maximum for is related to a buried layer located down to 6 m under the dune surface. The correlation between HH and VV signals remains traces high (close to 0.7). It should be noticed that the subsurface paleosoil far after the HH amplitude signal has disappeared, allowing thus to see deeper under the sand layer. The reason for the phase difference observed in Fig. 6 could be an anisotropic medium. Actually, the sand covering the paleosoils is stratified and presents also various structures due to water run-off (Fig. 7). The resulting oxidation layers and sand stratums can both cause an anisotropy of the permittivity distribution in the first sand layer, thus leading to different behavior for HH and VV polarizations. This effect can only be observed for the wave backscattered by the buried paleosoil, which travels through an anisotropic sand layer. A reflection on a permittivity gradient might also explain the observed phase difference. According to the WBK model [17], a single reflection on a permittivity gradient changes the phase of the incident wave. This model considers a complex value for the reflection coefficient: the phase difference between HH and VV signals could then be due to the fact that the reflection coefficient is different for H and V polarizations. The paleosoils can be seen as large wet stratums, alimented with water coming
GRANDJEAN et al.: SUBSURFACE STRUCTURES DETECTION
1249
TABLE I MEASUREMENTS OF LINEAR POLARIZATION RATIOS HV/HH AND VH/VV, HH/VV RATIO, AND HH-VV PHASE DIFFERENCE � ( STANDARD DEVIATION) WERE REPEATED FOR SEVERAL SUBAREAS IN THE SOUTHERN (S), CENTRAL, (C) AND NORTHERN (N) PARTS OF THE DUNE
6
from the upper and lower sand. As the sand-paleosoil interface is not sharply defined, one should observe a moisture gradient and then a high permittivity gradient at this interface. However, the WBK approximation applies when the properties of the medium are slowly varying on a scale comparable to the wavelength, which is not the case here. These results show that subsurface imaging of moisture is efficient with L-band sensors if high resolution is combined to polarimetry, and if calibrated data are available. III. FIELD EXPERIMENT The studied site is located in the south-western part of the Pyla dune, where sedimentary structures become more superficial, and where the polarimetric analysis indicates a strong depolarized signal, due to penetration effects [Fig. 5(b)]. The field experiments consisted in surface roughness measurements and in subsurface structures imaging with GPR. This information is needed to determine the contribution of both surface and subsurface scattering. Samples of sand, paleosoils and alios were also collected for laboratory permittivity measurements. A. Roughness Measurements
Fig. 5. Southern part of the Pyla dune: (a) HH polarization, (b) HV polarization, (c) HV/HH ratio, (d) HH-VV correlation, (e) nonsurface scattering map, and (f) phase difference between HH and VV signals. Images cover a 1200 1500 m area.
2
Surface roughness measurements were conducted using a laser profiler developed by ESA [12]. Two 20-m long roughness profiles were collected, parallel and perpendicular to the coast line direction. A profile is a juxtaposition of several 5-m long profiles, with a spatial resolution of 5 mm. Once a 5-m long profile is acquired, the laser profiler is moved exactly by 5 m and realigned using a theodolite. The two roughness parameters, standard deviation of surface height ( ) and correlation length ( ), were computed for profile sections of length 1, 2, 4, 5, 6, 10, and 20 m. We found that is of the order of 5.5 mm in
1250
Fig. 6.
IEEE TRANSACTIONS ON GEOSCIENCE AND REMOTE SENSING, VOL. 39, NO. 6, JUNE 2001
�
profile across the buried paleosoil. Fig. 9. View of the southern part of the Pyla dune (paleosoil #4 outcrop corresponds to the dark curved line).
suggests that the dune’s surface can be considered as smooth for the SAR (cf. Fig. 9). B. GPR Campaign
Fig. 7.
Sand stratifications and oxidation layers above the alios.
Fig. 8.
Relationship between the correlation length and the profile length.
both the perpendicular and parallel directions. Fig. 8 illustrates the exponential dependency of the correlation length with respect to the profile length. As already observed in [3], the correlation length increases as a function of the profile length, with a higher rate between 1 m and 10 m. Nevertheless, the low values obtained for compared to the L-band wavelength
GPR was initially designed to quickly image ground structures and to detect subsurface objects for geological, geotechnical, or hydrogeological applications [28]. For that reason, it is widely used in monostatic mode, i.e., the transmitter and the receiver antennas located at the same place. The basic principle of the acquisition scheme can be summarized as follows: a radar impulsion is emitted by the transmitter, which determines the central frequency and the bandwidth of the signal. The wave propagates into the ground and is recorded at the receiver, after it has been reflected and diffracted by the soil dielectric contrasts. In order to study heterogeneous medium with GPR, we need to analyze both coherent and incoherent signals. Depending on their size, respectively, larger or smaller than the incident signal wavelength, these heterogeneities can be considered as reflectors or scatterers. Therefore, for a given bandwidth, the medium can be modeled 1) by large structures detected by lower frequencies and producing reflectors on radargrams, and 2) by local variations of dielectric parameters affecting higher frequencies so that wave amplitude and phase diffusion is observed [39]. Classical GPR acquisition and processing techniques can be used to estimate large-scale propagation parameters (velocity and attenuation ) which are themselves related to the dielectric ones (dielectric permittivity , electric conductivity , and magnetic permeability ). At first approximation, the site can be modeled by horizontal layers, and therefore velocity changes with depth can be approximated from normal move out (NMO) analysis applied on common mid points (CMPs) records [34]. Classical monostatic profiles can also be recorded to localize high impedance structures appearing as reflectors or diffractors on GPR sections. We carried out a geophysical campaign where different monostatic profiles and CMP records were acquired at several frequencies. CMP records were spread according to the North–South direction, so that the topography and paleosoil layers can be considered as horizontal structures. Fig. 10 shows
GRANDJEAN et al.: SUBSURFACE STRUCTURES DETECTION
Fig. 10. (a) Common mid points and (b) corresponding semblance diagram. Velocity increases from 0.08 m/ns at the top to a maximum of 0.15 m/ns.
1251
horizontal high-reflective layers. Between them, sedimentary patterns related to the dune dynamic displacement are visible. They were probably generated by the combination of wind and erosion processes. The signal penetration is estimated to 30 m after time axis has been converted to depth using the NMO velocities. This limit corresponds to the alios soil, which acts as a strong reflective layer because its moisture content. For that reason, whatever the frequency, the signal is stopped at this level and the penetration dependence on frequency cannot be observed. These data also show an increasing resolution with frequency since internal structural patterns of the dune are much more detailed for high-frequency profiles than for low-frequency ones. So far, GPR techniques reveal subsurface structures and allow radar wave velocity estimation, but are not adapted for studying attenuation effects. Attenuation processes, which are much more difficult to characterize, can have two origins: the first one is related to dielectric relaxation and conductive losses, and the second one is due to wave diffusion on local dielectric variations as discussed before. To study these processes, numerical simulations can be performed, until a good match between the observed and the calculated attenuation curves is achieved. Such simulations are interesting to translate ) into dielectric ones ( ). propagation parameters ( The approach is presented in the next section. C. Permittivity Measurements
Fig. 11. GPR image of the Pyla dune at (a) 100 MHz, (b) 300 MHz, and (c) 500 MHz. NMO velocities were used for the time to depth conversion. P indicates main reflectors (paleosoils); S indicates sedimentary patterns inside the upper sand layer that could correspond to an interface between dry and wet sand.
CMP measurements with the corresponding semblance diagrams resulting from NMO analysis. The velocities calculated from the semblance vary from 0.08 to 0.15 m/ns. Highest values are in good agreement with those obtained for high silicated dry materials, for which values of dielectric permittivity around 6 were observed [27]. Low values could correspond to the water saturated superficial layer. Monostatic radar profiles were realized along a line of about 150 m long, running West–East from the beach to the top of the dune. Different antennas of 100, 300, and 500 MHz were selected to test the frequency effects on the backscattered signal [Fig. 11(a)–(c)]. Data were processed with the Radar Unix Code [23], using standard algorithms such as amplitude recovering, frequency filtering, and topographic corrections. All profiles indicate a very good penetration of the signal, defined as the maximum depth where signal is stronger than noise. Paleosoils appear clearly as
Permittivity measurements were performed for various soil samples of the Pyla dune using HP4192A and HP 8510 analyzers. Results presented in Table II were obtained for dry samples in the 0.2–4 GHz frequency range. It appears that permittivity values remain constant over the considered frequency range and that all considered materials have a very low loss tangent. It has to be noticed that the measured permittivities are somewhat lower than classical values found in [27]. This can be explained by the fact that we used a system characterizing natural samples (i.e., we do not compact samples) which keep their original porosity and contain voids. The dielectric contrast between sand, paleosoil, and alios is small and cannot explain the high reflectivity observed for alios and paleosoils in both SAR and GPR data. It means that the dielectric contrast between the dune sand and the buried structures is mainly due to a difference in water content: the alios and paleosoils act as water tanks retaining the streaming water. IV. GPR AND SAR SIMULATIONS A. Ground Penetrating Radar In order to understand microwave interactions observed for GPR data, radar wave propagation in complex geological structures was simulated. In the last few years, several physical models based on ray tracing [29], [8], finite differences [26], or pseudo-spectral methods [9], have been developed to solve this problem. The modeling method used here was conceived to simulate GPR experiments in three-dimensional (3-D) heterogeneous and dispersive media, without increasing significantly computation times. Because the GPR is running in monostatic mode, the algorithm uses the exploding reflector principle [10],
1252
IEEE TRANSACTIONS ON GEOSCIENCE AND REMOTE SENSING, VOL. 39, NO. 6, JUNE 2001
TABLE II PERMITTIVITY MEASUREMENTS OF DRY SOIL SAMPLES
TABLE III DESCRIPTION OF MODELS USED TO CALCULATE ATTENUATION CURVES OF FIG. 12. MODEL 2 IS THE REFERENCE. MODELS 1, 2, 3 AND 4, 5 REFER, RESPECTIVELY, TO Q AND � VARIATION EFFECTS
where the upgoing field diffracted from the local sources and recorded to the receiver is only considered, providing that velocities are divided by two. The calculated GPR signal derives from the convolution of the propagated electric field by the dielectric contrast distribution of the , leading to ground amplitude averaged on the puted with [22]
traces of the profile, are com-
(1) (4) and are the wavenumbers in the , , and where direction, and is the angular frequency. Antenna radiation patterns of the transmitter and receiver are implemented using the analytical solution from [2]. The implementation of this model was performed by using a phase shift domain [6] which provides low technique [21], [33], in the computation times without neglecting main physical processes of radar waves propagation [25]. In this algorithm, the medium can be parameterized according to a 3-D grid, so that both large dielectric structures—such as geological layers—or local heterogeneities—such as local variations of dielectric parameters—can be introduced. Frequency, bandwidth, polarization mode of the signal, and antenna diagram patterns can also be stipulated. To focus our attention on the origins of the attenuation processes, we first simulate a series of synthetic data for the different cases presented in Table III. The basic model is composed of two horizontal layers, in which either the factor or the local variations of dielectric parameters can vary. These local variations are introduced according to a uniform probability density function controlled by the deviation so that
(2) is the random function varying between 1 and where correspond to dielectric parameters in the homo1, and geneous and in the perturbed case, respectively. The interface roughness can also be introduced in the same way by stipulating the deviation to be applied at the -coordinate of each point defining the interface (3) Following that scheme, synthetic GPR data are calculated and the corresponding attenuation curve, taken as the instantaneous
Fig. 12 shows the synthetic GPR section calculated for the three arbitrary dielectric models described in Table III. The attenuation curves of the backscattered power calculated for each model are shown; Model 2 being taken as reference. The contribution of increasing dielectric losses is illustrated by Curves 1 to 3 where is set to 10, 25, and 200 in the first layer. It is clear that the backscattered power available at a specific time is lower when the factor is low, i.e., the loss tangent is high. The contribution of wave diffusion losses is illustrated by Curves 4 and 5, where the reflected power returned from the interface between Layers 1 and 2—at time 100 ns—is decreasing when the deviation is increasing in Layer 1. As it is demonstrated within this example, dielectric losses and wave diffusion can both be involved in attenuation processes. This was integrated in the GPR modeling of the Pyla dune. The model of the dune takes into account the topography, the paleosoils and the dielectric features of each layer in term of dielectric constant, magnetic permeability, interface roughness, and the statistical variations of these parameters. Some a priori data were used to build the first model to be tested: the velocity gradient with respect to depth resulting from the NMO analysis, and the electrical resistivity , estimated around 2000 m from electrical measurements of sand. Both of these indications constraint the global permittivity and factor if it is assumed in first approximation that [14] and thus
(5)
being the radar wave velocity in void. The source signal was set to 500 MHz with a bandwidth of 500 MHz to compare the simulations with the observed 500 MHz GPR profile, but also to be within the range of SAR P- and L-bands. Since the real part of the permittivity values was deduced from CMP measurements, the attenuation model was estimated by trial and error according to the phenomenon described above and shown in Fig. 12. This
GRANDJEAN et al.: SUBSURFACE STRUCTURES DETECTION
1253
Fig. 12. (a) Synthetic GPR section calculated with Model 2 parameters of Table III. (b) Attenuation curves of synthetic data calculated with Model 1, 2, 3 parameters showing the effect of dielectric losses on the backscattered power. (c) Attenuation curves of synthetic data calculated with Model 2, 4, 5 parameters showing the effect of ground heterogeneity on attenuation. TABLE IV DESCRIPTION OF THE 500-MHz GPR MODEL
was performed so that the synthetic data could match the observed ones. Table IV summarizes the end values of the different parameters (mean dielectric constant values obtained from GPR simulation differ from values presented in Table II, since the in-situ materials are not dry). Fig. 13 shows their spatial distribution and the corresponding synthetic image after the topography has been taken into account. Observed and calculated GPR profiles [Figs. 11(c) and 13(d)] as well as their related attenuation curves [Fig. 14(a) and (b)] show that the model can explain both the reflective structures of the Pyla dune and the backscattered power. The dune can be described as a multi-layered medium ) are inwhere metric layers of paleosoils ( ). A subsurface serted in a dry sand material ( ) is introduced to explain layer of wet sand ( both the high reflective part of the signal and the low wave velocity observed in the NMO analysis of the first 50 nanoseconds. Considering these results describing more than 40 m of the Pyla dune’s subsurface, we can consider that some of the backscattered patterns observed in SAR images certainly result from ground structures located in the first few meters. This is confirmed by the model presented in the next section.Section IV-B B. SAR In this section, we describe the simulation of the RAMSES backscattered co-polarized signal using a two-layer surface and volume scattering model. The subsurface structure geometry and its dielectric parameters were derived from GPR data (see
=
Fig. 13. (a) " , (b) Q spatial distribution in the (x; y 0; z ) plane corresponding to the model parameters of Table IV, and (c) 500-MHz synthetic GPR image of the Pyla dune. NMO velocities were used for the time-to-depth conversion.
Section IV-A), and the surface roughness information was measured using the laser profiler. 1) Single Layer Scattering Model As smooth to medium rough surfaces are considered here, the integral equation model (IEM) proposed in [19] can be used. The single layer scattering model considers a single homogeneous layer characterized by its dielectric constant ( ), albedo ( ), optical depth ( ), and surface roughness (cf. Fig. 15). The surface autocorrelation function (a Gaussian function is assumed here), height standard deviation
1254
IEEE TRANSACTIONS ON GEOSCIENCE AND REMOTE SENSING, VOL. 39, NO. 6, JUNE 2001
Fig. 15. (a)
Geometry of the single layer scattering problem.
(b)
Fig. 14. Mean attenuation curves calculated from (a) the observed 500-MHz profile and (b) the synthetic 500-MHz profile.
, and correlation length , describe the surface roughness. The parameter depends on the profile length considered and was shown to be very critical for the IEM model [3], [13], [15]. The IEM model validity range is expressed by the following conditions: and
(6)
where is the wave number of the incident plane wave ( ). Only the single scattering term will be considered here, which is a valid approximation when dealing with HH and VV polarizations. We shall also use the Fresnel transmission coefficients since we have small values for the dielectric constant (GPR meafor surements of permittivity profiles show that dry sand and paleosoils). is the sum of a surface The total backscattered power and a volume scattering term scattering term [20] (7) where
HH or VV, and
(8)
(9) with
Fig. 16. Geometry of the two-layers scattering problem.
which is the Fourier transform of the th power of the Gaussian surface correlation function. For single scattering, the cross-polarized returns, i.e., HV and VH, are zero, which is not the case for the subsurface structures of the Pyla dune [e.g., Fig. 5(b)]. However, the intensity of the backscattered cross-polarized signal is weak ( 28 dB) compared to the co-polarized signal ( 15 dB), and we can consider at the first order that most of the backscattered energy is present in HH and VV polarizations. 2) Two-Layers Scattering Model We consider now a smooth layer of dielectric constant and thickness covering a rougher layer of dielectric [16] as represented in Fig. 16. constant Considering the first order radiative transfer solution, the total can be written as [20] backscattered power (10) is the surface scattering term from the top layer where is the volume scattering term in the first given by (8), represents the noncoherent scatlayer given by (9), tering from the bottom layer attenuated by the first layer. It can be approximated by (11)
and
is the surface scattering term for the lower layer where evaluated using (8) and parameters of the layer medium. Fiis the interaction term between volume inhonally,
GRANDJEAN et al.: SUBSURFACE STRUCTURES DETECTION
Fig. 17.
1255
Sketch of the geometry of paleosoil #4 buried in the Pyla dune.
mogeneities and the lower layer, which is neglected here (the upper sand layer is considered homogeneous). As previously shown, we consider here only the single scattering term for each layer, that is the cross-polarized returns are zero. 3) Model Parameters GPR experiments showed that paleosoils are mainly horizontal (Fig. 11). We considered the paleosoil #4 in the southern part of the Pyla dune, which is almost entirely covered by a sand layer whose thickness varies linearly from zero to several tens of meters [NE-oriented structure in the southern part of the dune in Fig. 5(b)]. The site geometry allows derivation of the first sand layer thickness in a very simple way as represented in Fig. 17: the sand layer thickness at a distance from the paleosoil outcrop , where is the dune slope ( 15 ). is The two-layer model parameters are estimated as follows. The permittivity of the first layer (dry sand) and of the second layer (paleosoil) are obtained from analysis of GPR profiles (cf. and . The Table IV), that is first layer albedo is set to 0.01, since it is composed of homogeneous sand with a high extinction coefficient and a low scattering coefficient. RAMSES L-band SAR operates at a frecm, and quency of 1.6 GHz that is a wavelength the incidence angle is 55 , that is a local incidence angle 40 . For surface roughness parameters, we consider a Gaussian autocorrelation function for both layers since they are smooth cm and surfaces. For the first sand layer, we take cm. These values were derived from laser profiler meacm surements. For the second paleosoil layer, we take cm. These values were estimated from hand-dug and pits that show the sand-paleosoil interface. 4) Comparison Between Model and Experimental Data Fig. 18 presents a close view of paleosoil #4 in the RAMSES HH scene, showing the strong radar return at the outcrop, which then gently decreases when the thickness of the covering sand layer increases. from the two-layers zone can be The backscattered power expressed after (10): (12) from the single layer zone while the backscattered power (it can be seen as a two-layer zone with a first layer thickness ) can be expressed after (7) (13)
Fig. 18. RAMSES HH close view of paleosoil #4 and interpretation. � : two-layers zone (subsurface effects); � : single layer zone (thick sand layer).
Let us consider the quantity
defined as (after [16]) (14)
We can express as a function of the upper sand layer thickness , with when , all other parameters being set as previously described. Fig. 19 shows variation of as a function of the top layer thickness for both HH and VV polarizations. The solid line corresponds to the theoretical value computed using (14) for the chosen model parameters. The dash lines correspond to experimental data derived from two RAMSES image profiles crossing the paleosoil #4 location. We can see a good agreement between theory and experimental data. The RAMSES L-band SAR can detect subsurface structures covered by sand to a depth of several meters, up to 4 m according to solid lines in Fig. 19. This penetration depth is coherent with results of previous studies performed in Egypt using SIR-C L-band data [31], [32], but we present here a more quantitative approach. Further theoretical developments are needed to take into account the cross-polarized return and explain the phase difference between HH and VV channels observed in Fig. 6. One should notice again that this phase differallows to detect the palesoil #4 signature down ence to a larger depth than when only considering HH or HV return: we estimated a penetration depth of 6.5 m from Fig. 6. V. CONCLUSION The objective of this work was to evaluate the capabilities of L-band radar systems to penetrate soils in order to obtain information about subsurface structures (moisture) and related dielectric parameters. The Pyla dune was explored as a first test site to develop our methodology. Evidence of subsurface scattering was derived from polarimetric analysis of AIRSAR and RAMSES L-band data. The high resolution of RAMSES images allowed recognition of subsurface structures in the cross-polarized signal, related to buried
1256
Fig. 19. Variation of parameter R (bottom) VV polarizations.
IEEE TRANSACTIONS ON GEOSCIENCE AND REMOTE SENSING, VOL. 39, NO. 6, JUNE 2001
=�
=� with respect to the upper layer thickness d (model in solid line, experimental data in dash lines) for (top) HH and
paleosoils. GPR was successfully used to validate the presence of subsurface structures. Physical models for GPR wave propagation in heterogeneous dispersive medium was developed to estimate the Pyla dune dielectric parameter distributions. Both large-scale structures and local variations of dielectric parameters are considered to respectively model the wave reflection and diffraction. Dielectric losses and wave diffusion are taken into account in attenuation processes. Several metric horizontal layers of paleosoils located inside a sandy material compose
the Pyla dune. The dielectric permittivity varies from 5 for dry sand to 24 for wet paleosoils, with a value around 17 in the wet superficial sand layer. factor is around 100 in the dry sand, but drops to 10 in paleosoils. These results were combined to surface roughness measurements to constrain a two-layer IEM model. We show that pure volume scattering in the upper sand layer is weak, the main backscattered signal being produced by a subsurface scattering process on the buried paleosoils. This process generates a phase difference between HH and VV chan-
GRANDJEAN et al.: SUBSURFACE STRUCTURES DETECTION
nels, which could be due to a permittivity anisotropy in the covering sand layer. L-band SAR simulation shows that a penetration of 4 m is needed to explain some of the bright patterns observed in SAR images. This penetration depth corresponds to twenty times the SAR wavelength. This result confirms that an airborne SAR in the P-band frequency range (around 400 MHz) could detect buried structures or moisture down to 10 m in arid regions. While the penetration depth is here much smaller than GPR, such a system could nevertheless investigate large areas with a relatively high efficiency. Our first results open the way to new applications of radars for Earth observation, in particular for mapping the surface and subsurface soil characteristics, such as water content, geological layers, buried objects and heterogeneities. A new airborne sensor, named SETHI P-band, which combines nadir looking, side looking and polarimetric capabilities, is currently under development at ONERA as an offspring of the RAMSES system [24]. It will offer a new facility to the remote sensing community to evaluate the high potentials of the P-band for various applications: subsurface imaging, water detection, biomass evaluation, ice sounding, ocean study, and archeology in arid regions. ACKNOWLEDGMENT The authors would like to acknowledge DGA and ONERA for allowing the use of RAMSES data, NASA/JPL for providing AIRSAR data, and ESA for lending the laser profiler. They also thank the PIOM laboratory for permittivity measurements. This work has the BRGM contribution number 40. REFERENCES [1] M. G. Abdelsalam and R. J. Stern, “Mapping precambrian structures in the Sahara Desert with SIR-C/X-SAR radar: The neoproterozoic keraf suture, NE Sudan,” J. Geophys. Res., vol. 101, no. E10, pp. 23 063–23 076, 1996. [2] S. A. Arcone, “Numerical studies of the radiation patterns of resistively loaded dipoles,” Appl. Geophys., vol. 33, no. 1–3, pp. 39–52, 1995. [3] N. Baghdadi, P. Paillou, G. Grandjean, P. Dubois, and M. Davidson, “Relationship between profile length and roughness parameters for natural surfaces,” Int. J. Remote Sensing, to be published. [4] Y. Barbin, F. Nicollin, W. Kofman, V. Zolotarev, and V. Glotov, “Mars 96 GPR program,” Appl. Geophys., vol. 33, no. 1–3, pp. 27–38, 1995. [5] G. L. Berlin, M. A. Tarabzouni, A. H. Al-Nazer, K. M. Sheikho, and R. W. Larson, “SIR-B subsurface imaging of a sand-buried landscape: Al Labbah Plateau, Saudi Arabia,” IEEE Trans. Geosci. Remote Sensing, vol. GE-24, pp. 595–602, July 1986. [6] A. Bitri and G. Grandjean, “Frequency-wavenumber modeling and migration of 2D GPR data in moderately heterogeneous dispersive media,” Geophys. Prospect., vol. 46, pp. 287–301, 1998. [7] J.-M. Boutry, “ONERA Airborne SAR Facilities,” in Proc. 2nd Int. Airborne Remote Sensing Conf., San Francisco, CA, June 24–27, 1996. [8] J. Cai and C. A. McMechan, “Ray-based synthesis of bistatic groundpenetrating radar profiles,” Geophysics, vol. 60, pp. 87–96, 1995. [9] J. M. Carcione, “Ground-penetrating radar numerical modeling applied to engineering problems,” Eur. J. Environ. Eng. Geophys., vol. 1, pp. 65–82, 1996. [10] J. F. Claerbout, Imaging the Earth’s Interior. Oxford, U.K.: Blackwell Scientific, 1985, p. 398. [11] A. E. Dabbagh, G. A. Khattab, and M. A. Khan, “Detection of sandcovered geologic features in the Arabian Peninsula using SIR-C/X-SAR data,” Remote Sens. Environ., no. 59, pp. 375–382, 1997. [12] M. Davidson, T. Le Toan, M. Borgeaud, and T. Manninen, “Measuring the roughness characteristics of natural surfaces at pixels scales,” in Proc. Int. Geoscience and Remote Sensing Symp., Seattle, WA, 1998, pp. 1200–1202.
1257
[13] M. Davidson, T. Le Toan, F. Mattia, T. Manninen, P. Borderies, I. Chenerie, and M. Borgeaud, “A validation of multi-scale surfaces roughness description for the modeling of radar backscattering from bare soil surfaces,” in Proc. 2nd Int. Workshop Retrieval of Bio- & Geo-Physical Parameters from SAR Data for Land Applications. Noordwijk, The Netherlands, 1998, pp. 395–400. [14] J. L. Davis and P. A. Annan, “Ground-penetrating radar for high-resolution mapping of soil and rock stratigraphy,” Geophys. Prospect., vol. 37, pp. 531–551, 1989. [15] W. Dierking, “Quantitative roughness characterization of geological surfaces and implications for radar signature analysis,” IEEE Trans. Geosci. Remote Sensing, vol. 37, pp. 2397–2412, Sept. 1999. [16] C. Elachi, L. E. Roth, and G. G. Schaber, “Spaceborne radar subsurface imaging in hyperarid regions,” IEEE Trans. Geosci. Remote Sensing, vol. GE-22, pp. 383–388, July 1984. [17] W. Elmore and M. Heald, Physics of Waves. New York: Dover, 1985. [18] T. G. Farr, C. Elachi, and P. Hartl, “Microwave penetration and attenuation in desert soil: A field experiment with the shuttle imaging radar,” IEEE Trans. Geosci. Remote Sensing, vol. GE-24, pp. 590–594, July 1986. [19] A. K. Fung, Z. Li, and K. S. Chen, “Backscattering from a randomly rough dielectric surface,” IEEE Trans. Geosci. Remote Sensing, vol. 30, pp. 356–369, Mar. 1992. [20] A. K. Fung, Microwave Scattering and Emission Models and their Applications. Norwood, MA: Artech House, 1994. [21] Z. Gazdag, “Wave equation migration with the phase-shift method,” Geophysics, vol. 43, pp. 1342–1351, 1978. [22] G. Grandjean and J. C. Gourry, “GPR data processing for 3D fracture mapping in a marble quarry (Thassos, Greece),” J. Appl. Geophys., vol. 36, pp. 19–30, 1996. [23] G. Grandjean and H. Durand, “Complete package for GPR data processing,” Comput. Geosci., vol. 25, pp. 141–149, 1999. [24] G. Grandjean, P. Paillou, P. Dreuillet, P. Dubois, J. C. Souyris, N. Baghdadi, and J. Achache, “Radar penetration in soils: Toward a new system for subsurface Earth observation,” in Proc. Working Group on Calibration and Validation SAR Workshop, CEOS, Toulouse, France, Oct. 26–29, 1999. [25] G. Grandjean, J. C. Gourry, and A. Bitri, “Evaluation of GPR techniques for civil-engineering applications: Study on a test site,” Appl. Geophys., to be published. [26] M. Moghaddams, E. J. Yannakakis, and W. C. Chew, “Modeling of the subsurface interface radar,” J. Electromagn. Waves Appl., vol. 5, pp. 17–39, 1991. [27] G. R. Olhoeft, “Electrical properties of rocks,” in Physical Properties of Rocks and Minerals, Y. S. Touloukian and C. Y. Ho, Eds. New York: McGraw-Hill, 1981, vol. II-2, pp. 257–329. , “Application of ground-penetrating radar,” in 6th Int. Conf. [28] Ground-Penetrating Radar, Sendai, Japan, 1996, pp. 1–4. [29] M. H. Powers, “Dispersive ground penetrating radar modeling in 2D,” Ph.D. dissertation, The Ohio State Univ., Columbus, 1995. [30] E. Rignot, “Backscatter model for the unusual radar properties of the Greenland ice sheet,” J. Geophys. Res., vol. 100-E5, pp. 9389–9400, 1995. [31] G. G. Schaber, J. F. McCauley, C. S. Breed, and G. R. Olhoeft, “Shuttle imaging radar: Physical controls on signal penetration and subsurface scattering in the Eastern Sahara,” IEEE Trans. Geosci. Remote Sensing, vol. GE-24, pp. 603–623, July 1986. [32] G. G. Schaber, J. F. McCauley, and C. S. Breed, “The use of multifrequency and polarimetric SIR-C/X-SAR data in geologic studies of Bir Safsaf, Egypt,” Remote Sens. Environ., vol. 59, pp. 337–363, 1997. [33] P. Stoffa, J. Fokkema, R. De Luna Freire, and W. Kessinger, “Split-step Fourier migration,” Geophysics, vol. 55, pp. 410–421, 1990. [34] S. Tillard and J. C. Dubois, “Analysis of GPR data: Wave propagation velocity determination,” Geophys. Prospect., vol. 33, no. 1–3, pp. 77–92, 1995. [35] G. Turner and A. F. Siggins, “Constant Q attenuation of subsurface radar pulses,” Geophysics, vol. 59, pp. 215–223, 1994. [36] F. T. Ulaby, R. K. Moor, and A.K. Fung, Microwave Remote Sensing: Active and Passive. Norwood, MA: Artech House, 1981, 1982, 1986, vol. 1-2-3. [37] F. T. Ulaby and M. C. Dobson, Handbook of Radar Scattering Statistics for Terrain. Norwood, MA: Artech House, 1989. [38] F. T. Ulaby and C. Elachi, Radar Polarimetry for Geoscience Applications. Norwood, MA: Artech House, 1990. [39] D. G. Ushakov and M. G. Ushakov, “Experimental study of dilatation wave scattering at the rough interface,” Russian J. Geol. Geophys., vol. 34, no. 2, pp. 98–106, 1993.
1258
IEEE TRANSACTIONS ON GEOSCIENCE AND REMOTE SENSING, VOL. 39, NO. 6, JUNE 2001
Gilles Grandjean received the Ph.D. degree in geophysics from the University of Montpellier, France, in 1992. After a one-year postdoctoral fellowship at the Polytechnic School of Montréal, QC, Canada, he joined the French geological survey, BRGM, where he has acted as a Project Leader in geophysics since 1995. His research activity is focused on wave propagation and reconstruction, especially for GPR and seismics. The related applications concern different applied fields such as cavities detection, fractures imaging, or water resource estimation. He was involved, as PI or collaborator, in several national projects related to GPR or radar remote sensing.
Philippe Paillou (S’90–M’95) received the Dipl.Eng. degree from the Ecole Nationale Supérieure de Physique de Strasbourg, France, in 1989, and the Ph.D. degree in image processing from the Université Louis Pasteur de Strasbourg, France, in 1992. Since September 1993, he has been Assistant Professor at the University of Bordeaux, France, and is a member of the Planetology Group at the Astronomical Observatory of Bordeaux. His research activities concern image processing applied to radar remote sensing: relief reconstruction (radarclimometry and radargrammetry), SAR image formation process modeling, and comparative planetology using SAR data.
Pascale Dubois-Fernandez received the Dipl.Eng. degree from the Ecole Nationale Supérieure d’Ingénieur en Construction Aéronautique, Toulouse, France, in 1983, and the M.S. and E.S. degrees from the California Institute of Technology, Pasadena, in 1984 and 1986, respectively. She joined the Jet Propulsion Laboratory (JPL) in the Radar Science Group. In 1994, she moved back to France where she is currently pursuing her career in remote sensing with ON-X consulting, as a Contractor for the Cartographic Department of the Délégation Générale pour 1’Armement) (DGA), Arcueil Cedex, France, where she studied DEM restitution and digital map updating from optic and radar data.
Thomas August-Bernex received the DEA degree in planetology from the University of Toulouse, France, in 1997, and is currently pursuing the Ph.D. degree in the Planetology Group at the Observatoire de Bordeaux, France. His research interests include modeling and analysis of subsurface.
Nicolas N. Baghdadi received the Ph.D. degree in remote sensing from the University of Toulon, France, in 1994. He completed a two-year postdoctorate scholar position at the National Institute of Scientific Research of Quebec, QC, Canada, in 1996, where his research interests were interpretation and modeling of the radar signature of snow and wetlands, SAR image processing and analysis. Since 1998, he has been in charge of the radar activities at BRGM, Orleans, France. His research interests include calibration, geocoding, interpretation of radar signal, land use mapping, retrieving physical parameters (i.e., soil surface roughness) for hydrology applications (excess runoff, flood), and subsurface radar signal processing.
José Achache received the Ph.D. degree in geophysics from University Paris VI, France, in 1979, and the d’Etat degree in 1984. He was a Postdoctoral Fellow at Stanford University, Stanford, CA, in 1980, and joined Institut de Physique du Globe de Paris in 1981. In 1989, he became Professor, Director of the Department of Space Studies, and Dean of Graduate Studies at Institut de Physique du Globe and University Paris VII. He joined BRGM, Orleans, France, in 1996 as Vice-President for Research and CNES in 1999. He conducted research in geomagnetism, paleomagnetism, and SAR interferometry applied to geological hazards. He was Principal Investigator on several earth and planetary observation programs of CNES, NASA, and ESA. Currently, he is Deputy Director General, Science at Centre National d’Etudes Spatiales (CNES), Paris Cedex 01, France. He has published approximately 60 scientific papers in international journals and a number of technical reports on space programs.