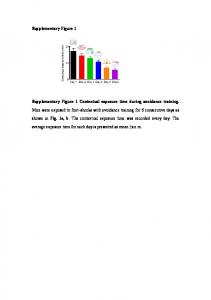
Pharmacology of TAK-875. a, Competitive radioligand binding for TAK-875. GPR40 membranes (prepared ..... the vdW radii of phenyl ring carbons. In the more ...
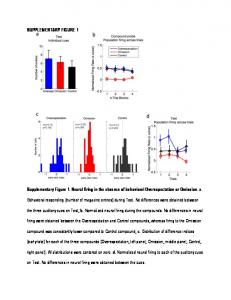
Supplementary Figure 1. Pharmacology of TAK-875. a, Competitive radioligand binding for TAK-875. GPR40 membranes (prepared from stably transfected cells) were incubated with either [ 3H]-TAK-875 (Δ) or [3H]-AM-1638 (○) in the presence of unlabeled TAK-875, as described in the Methods section. Percent specific binding (y-axis) was plotted against the log concentration of TAK-875 (x-axis) and fit with a 4 parameter nonlinear logistic curve function with variable slope (GraphPad Prism, v7.00). The K i for TAK-875 in [3H]-TAK-875 binding was 17 nM. An inhibition curve for [3H]-AM-1638 binding was not drawn since the addition of TAK-875 resulted in enhanced binding activity. Data points represent the mean of at least three independent experiments with error bars indicating s.e.m. The affinity modulation factor () was calculated using the allosteric modulator titration equation within GraphPad Prism. b, Ca2+ mobilization assay (FLIPR) using stably transfected cells. GPR40- Gαq signaling by TAK-875 (Δ). TAK-875 acts as a partial agonist relative to 500 µM of the natural ligand, linoleic acid. (n=4; EC 50 ~1.71μM; Top 81.67%; error bars represent s.e.m.) c, OGTT in wild type C57BL/6 mice. Decreases in glucose are seen after treatment with TAK-875 at 30 and 60 mg kg-1. d, Incretin assay in wild type C57BL/6 mice. Similar to vehicle, TAK-875 has no effect on plasma total GLP-1 post an oral treatment at 30 mg/kg. Oral treatment of Compound 1 at 10 mg/kg sustains an elevated level of plasma total GLP-1 in the 4-hour window.
1
Supplementary Figure 2. a, Crystal lattice of the GPR40-compound 1 structure. The GPR40 receptor is in cyan; T4L is in magenta; Compound 1 is in orange as sticks. The binding site for compound 1 is open to solvent and not affected by crystal packing contact. b, Superposition of 4PHU in the crystal packing interface of GPR40compound 1. GPR40 from 4PHU is in white; TAK-875 is in green; the GPR40-compound 1 structure is in cyan; compound 1 is removed for clarity. The superposition shows that the A1 site in the GPR40-compound 1 structure is perturbed by crystal packing contacts with a neighboring GPR40 molecule.
2
Supplementary Figure 3. Radioligand Binding for GPR40 Control and Mutant Constructs. Radioligand binding experiments were conducted as described in the Methods section. Total binding (solid bars) and nonspecific binding (open bars) for membranes prepared from cells transiently transfected with no GPR40 mutation (Control), four stabilizing mutations (L42A, F88A, G103A, Y202F), single point A2 site mutations (Y114F; S123A; Y44F) and single point ICL2 mutations involved in Gαs coupling (L112A; L112F). Data points represent the mean of two replicates from a single experiment with error bars indicating s.e.m. a, [3H]-TAK-875 binding (2.5 μg membrane for each) indicates that A1 site binding was preserved across the wild type and mutants, while b, [3H]-AM-1638 binding (2.5 μg membrane for each) demonstrates the significant loss of A2 site activity for the single point A2 site mutations and reduced relative binding for the construct with the four stabilizing mutations and L112 mutations. c, Saturation binding analysis for [3H]-TAK-875 and [3H]-AM-1638 using membranes from control and mutant GPR40 constructs; shown are results from a representative experiment.
3
Supplementary Figure 4. Sequence alignment of four classes of human lipid receptors: free fatty acid receptors (FFAR), sphingosine-1-phosphate receptors (S1PR), lysophosphatidic acid receptor (LPAR), prostaglandin E receptors (EPR). a, The A2 binding pocket. Receptor is colored in cyan, and compound 1 in orange. Ribbon represents the transmembrane helices. Y44 2.42, Y114 ICL2, S1234.42 are drawn as sticks. Focus of the alignment is colored in yellow. b, c, Alignment covers a part of H2, part of H3, the entire ICL2, and part of H4 as defined by the yellow area in (a).
4
Supplementary Figure 5. Binding interaction of cholesteryl hemisuccinate (CHS) in P2Y 1R. a. In silver mesh is an “interaction surface” of the region around the CHS molecule, which indicates that the ligand is within optimal van der Waals (vdW) contact distance when touching the surface. P2Y 1R is colored in green and CHS in yellow with oxygen atoms in red. Ribbon represents the transmembrane helices. b, A more detailed view of the binding site. Hydrogen bonds are represented as dotted lines. Distances shown are between oxygen and oxygen (nitrogen on the histidine). c, The Fo-Fc omit map of CHS was calculated in its absence and are shown as black mesh and contoured at 3.0 σ. Transmembrane helices H3, H4, H5 and ICL2 are labeled.
5
Supplementary Figure 6. Structural superposition of GPR40-compound 1 with GPR40-TAK-875 (PDB 4PHU). a-c, 4PHU is shown as GPR40 in white ribbon and TAK-875 in green stick. GPR40-compound 1 complex is shown in cyan ribbon with compound 1 removed for clarity. Transmembrane helices and intracellular loop 2 (ICL2) are labeled. a, T4L fusion was inserted between Helix 5 and 6 in the crystallization construct. b, viewed parallel to the membrane with (a) and (c) as opposing 90° vertical rotation from (b). Cα RMSD=1.05 Å. d, Site A1 in GPR40-TAK-875. e, Site A1 in GPR40-compound 1.
6
Supplementary Figure 7. Graph showing the B-factor vs. diffraction frame number as obtained from scaling the data, indicating negligible crystal decay during data collection.
7
Supplementary Figure 8. Stereo image of the GPR40-compound 1 complex shown as ribbon representation. Compound 1 is shown as stick in orange. The Fo-Fc omit map of compound 1 was calculated in its absence and is shown as black mesh and contoured at 3.0 σ. Figure was prepared using PyMOL (Schrödinger, New York).
8
Compound Concentration (nM)
10000
1000
100
10
1
0.03mpk 0.1mpk 0.3mpk
1mpk
3mpk
10mpk
Supplementary Figure 9. Drug exposure in plasma after oral dose of compound 1 in wild type C57BL/6 mice at various doses.
9
Supplementary Figure 10. a, Figure adapted from Hauge et al.1 showing their docked conformation of AM-1638 in site A1. b, A close-up view of the docked pose in (a), showing the highly strained conformation required for binding in site A1, with the carboxylic acid and cyclopropane on the same side of the phenyl ring. c, A preferred conformation of AM-1638, with the carboxylic acid and cyclopropane on opposing sides of the phenyl ring. d, Figure adapted from Hauge et al.1 Annotation emphasizes the possible structural determinant of site A1 binders and A2 binders. e, AM-1638 modeled in Site A2, superposed with the crystal structure of Compound 1 and f, illustrating that the aforementioned torsion is in a well-tolerated, low energy conformation.
10
Human GPR40 Binding to A1 Ki, nM Human GPR40 Binding to A2 Ki, nM Human GPR40 Calcium EC50, nM (Emax, %) Human GPR40 barrestin EC50, nM (Emax, %) Mouse GPR40 barrestin EC50, nM (Emax, %) Rat GPR40 b-arrestin EC50, nM (Emax, %) Human GPR40 IP1 EC50, nM (Emax, %) Human GPR120 Binding to Ki, nM Human GPR120 Calcium EC50, nM (Emax, %) Human GPR120 barrestin EC50, nM (Emax, %) Mouse GPR120 barrestin EC50, nM (Emax, %) human PPARalpha binding, nM human PPARdelta binding, nM human PPARgama binding, nM
TAK-875 (A1)
LY2881835 (A1)
AM1638 (A2)
Compound 1 (A2)
7.7
4.7
>6910
>5590
>7050
>3720
1.4
0.9
159 (67)
9.1 (62)
1.7 (98)
1.8 (110)
11.5 (119)
8.7 (137)
16 (153)
1.9 (172)
8.6 (117)
0.8 (133)
22.7 (112)
1.6 (146)
36
2.0 (124)
105 (113)
2.1 (163)
0.35 (145)
1.24 (162)
0.25 (197)
100000
>100000
ND
>100000
>50000
>50000
2870 (63)
>50000
>100000
>100000
ND
>100000
>50000
>50000
ND
>50000
>10000
>10000
3170
>10000
>10000
>10000
>10000
>10000
>10000
>10000
>10000
>10000
Supplementary Table 1. Representative GPR40 site A1 and A2 binders and their activities.
11
Compound 1 >10000 >10000 >10000 >10000 >20000 >13000 >20000 >11000 >100000 >50000 >100000 >10000 >10000 >80000 >30000 >20000 >20000
hPPARalpha binding Ki (nM) hPPARdelta binding Rel IC50 (nM) hPPARgamma binding Ki (nM) hRXRalpha binding Ki (nM) hRORalpha binding Ki (nM) hRORbeta binding Ki (nM) hRORgamma binding Ki (nM) hERalpha binding Ki (nM) hGPR120 beta-Arrestin Rel EC50 (nM) hGPR120 FLIPR Rel EC50 (nM) hGPR120 binding Ki (nM) hGLUCR binding Ki (nM) hM1 binding Rel IC50 (nM) hD1 cAMP Rel EC50 (nM) hNav1.7 binding Rel IC50 (nM) hCDK1 binding IC50 (nM) hCDK2 binding IC50 (uM)
Supplementary Table 2. Compound 1 selectivity panel.
12
Dog Hepatocyte
Human Hepatocyte
Mouse Hepatocyte
Rat Hepatocyte
Dog Hepatocyte
Human Hepatocyte
Mouse Hepatocyte
Rat Hepatocyte
Clearance ABT
Clearance ABT
Clearance ABT
Clearance ABT
Clearance no ABT
Clearance no ABT
Clearance no ABT
Clearance no ABT
Intrinsic
Intrinsic
Intrinsic
Intrinsic
Intrinsic
Intrinsic
Intrinsic
Intrinsic
Clearance %
Clearance %
Clearance %
Clearance
Clearance
%
Clearance % Recovery
Clearance
%
Clearance
% Recovery
% Recovery
(ul/min/milc Recovery (ul/min/m Recovery (ul/min/m Recovery (ul/min/m Recovery (ul/min/m
(ul/min/mil
(ul/min/mil Recovery (ul/min/mil
ells)
cells)
cells)
ilcells)
19.3
92.8