3. Key Laboratory of Molecular Biology for Infectious Diseases, Ministry of. Education, China ... 3-methyl-2-hydroxybutyric acid. -1.85E-06. -8.60E-06. -4.01E-06.
Supplementary Information for Serum Metabolomics to Identify the Liver Disease-Specific Biomarkers for the Progression of Hepatitis to Hepatocellular Carcinoma
Rong Gao,1 Jianhua Cheng,1 Chunlei Fan2, Xiaofeng Shi3, Yuan Cao4, Bo Sun,1 Huiguo Ding2, Chengjin Hu4, Fangting Dong,1 * Xianzhong Yan1*
1. National Center of Biomedical Analysis, Beijing 100850, China; 2. Department of Gastroenterology and Hepatology, Beijing You’an Hospital affiliated to Capital Medical University, Beijing 100069, China; 3. Key Laboratory of Molecular Biology for Infectious Diseases, Ministry of Education, China; Department of Infectious Diseases, the Second Affiliated Hospital of Chongqing Medical University, Chongqing 400010, China; 4. Department of Laboratory Medicine, the General Hospital of Jinan Military Command, Jinan 250031, Shandong, China.
Supplementary Table S1. The Pearson correlation coefficient of the randomly selected duplicate samples. Duplicate sample (DS)
Pearson Correlation Coefficient
Duplicate Sample (DS)
Pearson Correlation Coefficient
DS-1
0.998268058
DS-16
0.999686837
DS-2
0.999072175
DS-17
0.985738252
DS-3
0.999426573
DS-18
0.999634599
DS-4
0.999664146
DS-19
0.999440753
DS-5
0.999856752
DS-20
0.999939986
DS-6
0.999243799
DS-21
0.999047992
DS-7
0.999481800
DS-22
0.999790789
DS-8
0.999781987
DS-23
0.999958316
DS-9
0.998400789
DS-24
0.999389796
DS-10
0.997037309
DS-25
0.999946129
DS-11
0.999941303
DS-26
0.999935874
DS-12
0.999931416
DS-27
0.969182726
DS-13
0.999990246
DS-28
0.987997904
DS-14
0.999800965
DS-29
0.994257984
DS-15
0.999827710
DS-30
0.978366691
Supplementary Table S2. The stepwise discriminant functions variables and classification function coefficients of the four groups. Metabolites
C*(CON)
C*(HBV)
C*(LC)
C*(HCC)
Boric acid
-3.84E-06
8.52E-06
-3.35E-06
-3.84E-06
Trans-1,2-cyclopropanecarboxylate
2.60E-06
8.98E-05
4.95E-05
2.60E-06
Valine
3.11E-06
-6.35E-06
-8.24E-07
3.11E-06
Oxalic acid
7.16E-06
4.00E-05
1.11E-06
7.16E-06
Isoleucine
-5.80E-06
-2.43E-06
2.49E-06
-5.80E-06
3-methyl-2-hydroxybutyric acid
-1.85E-06
-8.60E-06
-4.01E-06
-1.85E-06
Ethanolamine
1.03E-04
-3.62E-04
3.49E-05
1.03E-04
Leucine
1.64E-05
-2.37E-05
1.48E-05
1.64E-05
Succinic acid
-5.03E-06
-1.32E-05
5.76E-07
-5.03E-06
Salicylaldehyde
7.74E-04
6.22E-03
1.09E-03
7.74E-04
4-Hydroxy-Proline
-1.93E-06
-4.27E-05
-4.32E-06
-1.93E-06
Threitol
3.52E-05
6.37E-05
3.21E-05
3.52E-05
Methionine
3.72E-06
-1.57E-05
-6.48E-06
3.72E-06
Glutamate
2.33E-06
1.46E-05
3.47E-06
2.33E-06
Threonic acid
-3.40E-06
-6.19E-06
-2.07E-07
-3.40E-06
Glutamate
5.71E-06
-6.16E-06
2.08E-07
5.71E-06
Dodecanoic acid
2.78E-05
-2.07E-04
-5.97E-05
2.78E-05
Asparagine
-1.17E-04
1.42E-04
1.44E-04
-1.17E-04
9H-purine
-1.65E-05
-2.40E-04
-2.88E-05
-1.65E-05
Citrulline
1.61E-04
1.31E-05
-1.99E-06
1.61E-04
Methionine sulfoxide
-2.03E-05
2.98E-04
5.30E-05
-2.03E-05
Fructose
-8.55E-06
-4.19E-05
-1.71E-05
-8.55E-06
Glucose
5.56E-06
-2.60E-05
-1.87E-05
5.56E-06
Altrose
-1.56E-05
7.33E-05
-2.17E-05
-1.56E-05
Arachidic acid
2.66E-04
-3.50E-04
4.04E-05
2.66E-04
Methyl -β-D-galactopyranoside
-1.59E-07
8.61E-07
3.19E-06
-1.59E-07
Palmitic acid
2.60E-08
1.02E-05
3.64E-06
2.60E-08
Noradrenaline
-7.71E-05
3.31E-04
-1.10E-04
-7.71E-05
Stearic acid
-1.05E-06
-9.35E-06
-1.04E-06
-1.05E-06
Sucrose
-2.70E-07
1.68E-05
-1.91E-06
-2.70E-07
Constant
-1.55E+03
-1.91E+03
-4.68E+02
-2.42E+02
Supplementary Table S3. The Bayes Classification Results of training and validation data sets. group Count
Training data set
%
Count
Validation data set
%
Predicted Group Membership
Total
NC
HBV
LC
HCC
NC HBV LC HCC NC HBV LC HCC
40 0 0 0 100.00 0.00 0.00 0.00
0 32 0 0 0.00 100.00 0.00 0.00
0 0 34 0 0.00 0.00 100.00 0.00
0 0 0 26 0.00 0.00 0.00 100.00
40 32 34 26 100.00 100.00 100.00 100.00
NC HBV LC HCC NC HBV LC HCC
21 1 0 0 100.00 5.88 0.00 0.00
0 16 0 0 0.00 94.12 0.00 0.00
0 0 18 3 0.00 0.00 100.00 23.08
0 0 0 10 0.00 0.00 0.00 76.92
21 17 18 13 100.00 100.00 100.00 100.00
Supplementary Table S4. Characteristics of the healthy controls and patients with chronic hepatic diseases and HCC Characteristics
NC (n=61)
HBV (n=49)
LC (n=52)
HCC (n=39)
40.0 ±9.8
43.9 ±9.5
48.2 ±10.0
54.7 ±8.8
(18~71)
(20~76)
(25~72)
(24~84)
69.2
84.3
78.5
86.2
51.85 ±70.2
211.8 ±387.3
233.9 ±430.3
(1.88~210.2)
(2.08~1189.3)
(1.86~1210)
Positive
Positive
Positive
Age (years) Male (%) AFP / (range),ng/ml HbsAg
Negative
NC: Healthy control; HBV: Hepatitis B virus; LC: Liver cirrhosis; HCC: Hepatocellular carcinoma; AFP: alpha fetal protein.
6e+007
5e+007
4e+007
3e+007
2e+007
1e+007
0 Time (s)
500 TIC Blank_4
1000 TIC NC-27_1
Blank
1500
NC
2000
TIC HBV-Liu Wei_1
HBV
2500
TIC LC-Ran She guang_1
LC
HCC
3000
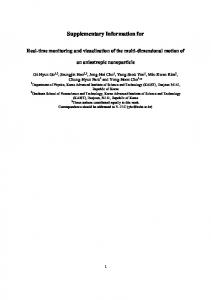
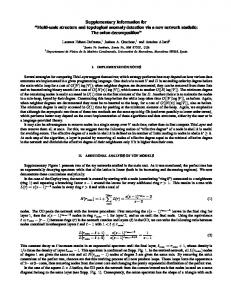
TIC HCC-Liu Qiang_1
Figure S1. Metabolic profilings of representative serum samples. The GC-TOFMS TIC chromatograms for blank (black line), health control (CN, green line), HBV (blue line), LC (purple line) and HCC (red line). X axis and Y axis represent the retention time (s) and relative peak intensity, respectively.
Figure S2. Heat map based on the Pearson distance measure and the Ward cluster algorithm, providing intuitive visualization of the metabolic remodeling in disease groups compared to the control group. Red color indicates a high level of metabolites and green color indicates a low level of metabolites, while black color means an equal level in groups.
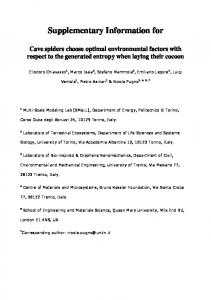
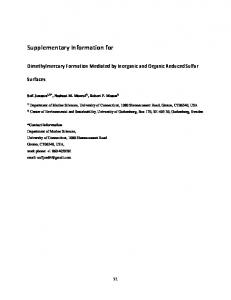
R2X(cum)=0.315, R2Y(cum)=0.966, Q2(cum)=0.925
A
to[1]
0.5
0.0
-0.5
-0.5
0.0
0.5
t[1] SIMCA-P+ 12 - 2014-11-23 05:24:12 (UTC+8)
R2X(cum)=0.601, R2Y(cum)=0.949, Q2(cum)=0.936
B
to[1]
1.0
0.0
-1.0
-1.5
-1.0
-0.5
0.0
0.5
1.0
1.5
t[1] SIMCA-P+ 12 - 2014-11-23 05:25:59 (UTC+8)
R2X(cum)=0.629, R2Y(cum)=0.972, Q2(cum)=0.943
C
to[1]
1.0
0.0
-1.0
-1.5
-1.0
-0.5
0.0
0.5
1.0
t[1] SIMCA-P+ 12 - 2014-11-23 05:28:07 (UTC+8)
Figure S3. OPLS-DA scores plots for serum samples of (A) patients with HBV ( ) and NC ( ), (B) patients with LC ( ) and NC ( ), and (C) patients with HCC ( ) and NC ( ).
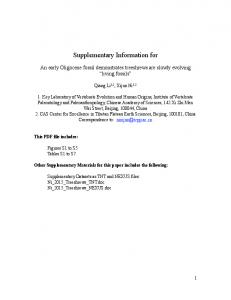
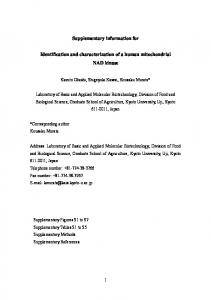
A
B
C
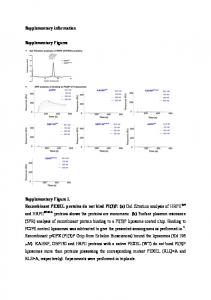
Figure S4. The top 30 ranked differential metabolites according to the mean decrease accuracy (MDA) and performance of Random Forest (RFs) models discriminating (A) HBV from NC, (B) LC from HBV and (C) HCC from LC based on training data set serum.
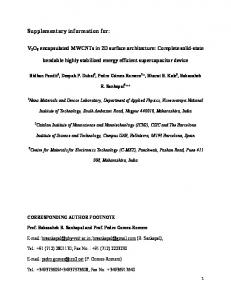
Figure S5. The discriminant function model based on Bayes' Rule by stepwise discriminant analysis.
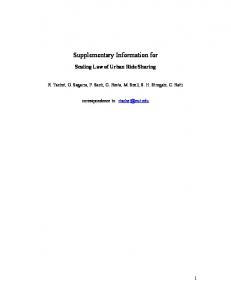
A
Figure S6. Metabolic network of the detected metabolites in this study. The normalized contents of each metabolite in NC (green bar chart), HBV (blue bar chart), LC (purple bar chart) and HCC (red bar chart) are shown under the chemical name.
B
Figure S7. The ratio of BCAA (leucine, isoleucine, and valine) to ArAA (tyrosine, phenylalanine and tryptophan), the ratio of FFA C16:1 to FFA C16:0 and FFA C18:1 to FFA C18:0.