[3] Kafsack BF, Rovira-Graells N, Clark TG, Bancells C, Crowley VM, Campino SG, Williams AE, Drought LG,. Kwiatkowski DP, Baker DA, Cortes A, Llinas M: A ...
Supplementary information
Global selection of Plasmodium falciparum virulence antigen expression by host antibodies
Abdirahman I. Abdi1, 2*, George M. Warimwe4’5, Michelle K. Muthui1, Cheryl A. Kivisi1, , Esther W. Kiragu1, Gregory W. Fegan1, 3 , Peter C. Bull*1, 3
Figure-S1: var expression quan.ty in severe, non-severe, and asymptoma.c infec.ons a)
f) p=3.4x10⁻⁸
0 -4
0 -4
p=4.3x10⁻⁹
0 -4
-4
8
p=1.0x10⁻⁸
4 0 -4
c)
0
p=0.1 log(dc8-4)
0
p=9.8x10⁻⁷
4 0 -4
-4
e)
0 -4
4 0 -4
p) p=7.1x10⁻⁸
Breadth
0 -4 Asy
NS
SM
p=1.2x10-09
4 0 Asy
NS
SM
p=3.3x10⁻¹²
8
4
0
-4
q) 8
4
8 log(pfsir2b)
4
p=3.1x10⁻¹⁰
8
o) p=1.9x10⁻⁹
8 log(dc8_av)
8
0
-4
j) p=7.5x10⁻¹⁰
4
n) 8
4
0.02
-4
i) 8
log(dc4)
0
log(Pfsir2a)
d)
log(gpA_av)
4
-4
-4
0
8 log(c2)
4
4
m) p=3.1x10⁻⁷
8 log(dc8-3)
log(dc13)
8
p=2.0x10⁻¹⁰
-4
h) p=7.3x10⁻⁹
0
log(b1)
4
4
l) 8
log(dc8-2)
log(gpA2)
4
g) 8
p=2.5x10⁻⁸
8 log(dc9)
4
b)
log(Ap2-g)
k) p=2.5x10⁻⁸
8 log(dc8-1)
log(gpA1)
8
4 0 -4 Asy
NS
SM
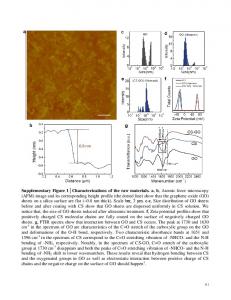
Figure-S1: var transcript quantity expressed by parasites from children with severe (SM), non-severe (NS) and asymptomatic (asy) infections. Shown on the y-axis is log transformed arbitrary transcript quantity obtained with the primers listed in Table S1. a-e represent transcript obtained with group A targeting primers where e is the median transcript quantity of group A var genes. g-j represent transcript obtained with dc8 targeting primers where J is the median transcript quantity obtained with the dc8 targeting primers. Included in the analysis is also expression of Pfsir2a(n) , Pfsir2b(o), and Pfap2-g(p). We have also shown the breadth of antibodies against IE surface antigens circulating during the time of infection(q). The red horizontal bar represent the median. p-value was calculated using Cuzick’s test for trend. All except dc4 showed significant trend.
Table-S1: The list of primers used in this study and their targets Primer name 1 2 3 4 5 6 7 8 9 10 11
dbla_not_var3 dbla2/a1.1/2/4/7 cidra1.4 cidra1.6 cidra1.1 dbla_cidra dblb12&dblb3&5 dblg4/6 dblz4 upsB1 upsC2
Name given
Reference
gpA1
1
Targets Majority of group A vars
gpA2
1
Mainly group A but also DC8
dc13
1
group A subset containing domain cassette 13
dc4
1
Group A containing cidra1.6
dc8-1
1
Group B subset containing domain cassette 8
dc8-2
1
Group B subset containing domain cassette 8
dc8-3
1
Group B subset containing domain cassette 8
dc8-4
1
Group B subset containing domain cassette 8
dc9
1
Group B subset containing domain cassette 9
b1
2
5’ sequence of majority of group B
c2
2
5’ sequence of majority of group C within coding region
12
PfAP2-g
Pfap2-g
3
13
Pfsir2a
Pfsir2a
This study
within coding region
Pfsir2b
This study
within coding region
Fwd:CCTTAACAGGGTCAGGTACA Rev:CCAAAAACCCCATATAGTTCCA 15
Pfsir2b Fwd:AGGGCCACTAGGTGAAGAAG Rev:GTTGATATGCCAGCACCTGA
16
Seryl-tRNA_synthatase
4
17
Fructose_biphosphase aldolase
4
“Primer name” is the name of the primer in the original study (see reference column), “Name given” is the name given to the primer in this study. Primer gpA2 targets group A var genes containing dbla1.1/2/4/7 but also can amplify the dbla2 of dc8.
Table-S2: The association between the breadth of host antibody during time of disease and var transcript quantity
Models
Variable
Group A
1 a, b, c, d, e
breadth-ab
-0.23(-0.30, -0.15) 3.42603e-09
2 a, b, c, d, e
VEH
3 a, b, c, d, e
DC8
DC9
Group B
Group C
-0.18(-0.26, -0.10) 0.00002
-0.11(-0.18, -.03) 0.005
-0.14(-0.19, -0.08) 1.19764e-06
-0.04(-0.10, 0.02) 0.2
0.63(0.35, 0.90) 0.00001
0.64(0.34, 0.93) 0.00004
0.87(0.61, 1.12) 1.59854e-10
0.52(0.33, 0.72) 3.72100e-07
0.31(0.09, 0.53) 0.006
breadth-ab
-0.21(-0.28, -0.14) 2.58643e-08
-0.16(-0.24, -0.08) 0.0001
-0.08(-0.15, -0.01) 0.028
-0.12(-0.17, -0.07) 4.9 e-06
-0.03(-0.09,0.02) 0.2
VEH
0.52(0.26, 0.78) 0.0001
0.56(0.27, 0.85) 0.0002
0.8(0.55,1.06) 2.4e-09
0.45(0.26,0.64) 5.16 e-06
0.29(0.07, 0.51) 0.009
The table shows the regression coefficient, 95%CI, and p values obtained from a set of regression analysis models predicting expression of either group A (models 1a, 2a, 3a), DC8 (models 1b, 2b, 3b), dc9 (models 1c, 2c, 3c), group B (b1) (models 1d, 2d, 3d) or group C (c2) (models 1e, 2e, 3e) var genes. Breadth of antibody recognition (models 1 a, b, c, d, e), var expression homogeneity (VEH)(models 2 a, b, c, d, e) or combination of the two variables were used as independent variables. Except for expression of group C (c2) var genes, the association of breadth of antibody (breadth-ab) with var gene expression is independent of VEH. In this regression analysis, breadth of antibody is not significantly associated with expression of group C (c2) var genes even when used as the sole explanatory variable. breadth-ab = the median of each child’s plasma reactivity against 8 heterologous parasites measured by flow cytometer. Group A= The median transcript quantity obtained with the primers gpA1, gpA2 & dc13 while DC8= the median transcript quantity obtained with the primers dc8-1, dc8-2, dc8-3, dc8-4, Table S1. N=215
Table-S3: The relationship between body temperatures, breadth of antibody and Pfsir2a expression Model
Pfsir2a
P value
Coeff(95%CI) 1
Temp (°C)
3.4(-1.72, 8.44)
0.193
2
breadth-ab
-0.10(-0.16, -0.04)
0.001
3
Temp (°C)
2.98(-1.89, 7.86)
0.2
breadth-ab
-0.10(-0.16, -0.04)
0.001
Shown is regression coefficient, 95%CI, and p value of three regression models predicting expression of pfsir2a using as explanatory variables; 1) admission body temperature (Temp) and 2) breadth of antibody against the surface of infected erythrocytes present at the time of disease). breadth-ab was log transformed before use in regression analysis. Only sample with available antibody and body temperature data were included in this analysis N=121.
Table-S4:Oblique Promax rotated factor loadings Variables factor1 factor2 uniqueness dc8-1 0.78 -0.06 0.41 dc8-2 0.79 -0.07 0.40 dc8-3 0.89 -0.10 0.26 dc8-4 0.68 -0.03 0.54 dc13 0.52 0.11 0.68 gpA1 0.77 0.19 0.29 gpA2 0.82 0.13 0.25 dc4 0.16 0.02 0.97 dc9 0.18 0.16 0.92 b1 -0.08 0.56 0.65 c2 0.12 0.49 0.71 Pfsir2a 0.21 0.75 0.31 Pfsir2b 0.13 0.67 0.48 Pfap2-g -0.15 0.79 0.41 Pfs16 -0.32 0.59 0.66 Eigenvalue 4.9 2.10 Proportion 65.84% 28.18%
The result of promax rotation of principal factor analysis is shown in the table. Significant Loadings (> 0.3 or 0.3 or 1. Loadings >0.3 or