Int. J. Mol. Sci. 2016, 17, 1628; doi:ijms17101628
S1 of S10
Supplementary Materials: New Potential Biomarker for Methasterone Misuse in Human Urine by Liquid Chromatography Quadrupole Time of Flight Mass Spectrometry Jianli Zhang, Jianghai Lu, Yun Wu, Xiaobing Wang, Youxuan Xu, Yinong Zhang and Yan Wang x10 6
- EIC(493.2807) Scan masterone-3.d Smooth
a
2.8 2.6 2.4 2.2 2 1.8 1.6 1.4 1.2 1 0.8 0.6 0.4 0.2 0 6
6.5
7
7.5
8 8.5 9 9.5 Counts vs. Acquisition Time (min)
10
10.5
11
x10 5 - EIC(493.2807) Scan masterone-3.d Smooth 1.4
b
1.3 1.2 1.1 1 0.9 0.8 0.7 0.6 0.5 0.4 0.3 0.2 0.1 0 13
13.2
13.4
13.6
13.8 14 14.2 14.4 14.6 Counts vs. Acquisition Time (min)
Figure S1. Cont.
14.8
15
15.2
Int. J. Mol. Sci. 2016, 17, 1628; doi:ijms17101628 x10 5
S2 of S10
-ESI Product Ion (9.183 min) Frag=130.0V
[email protected] (493.2807[z=1] -> **) masterone03-2.d
c 1.4
85.0299
1.3 1.2 1.1 1 0.9 0.8 0.7 113.0243
0.6 0.5
493.2806
0.4 0.3 0.2
301.2175 157.0141
0.1
359.2592
204.0857
431.2768
0 75
x10 3 9
100 125 150 175 200 225 250 275 300 325 350 375 400 425 450 475 500 525 550 Counts vs. Mass-to-Charge (m/z)
-ESI Product Ion (13.537 min) Frag=130.0V
[email protected] (493.2807[z=1] -> **) masterone03-2.d
d
75.0088
8 7 6
113.0240
5 4 493.2811
3 2 1
175.0239
240.6425
301.2174
375.2581
0 75 100 125 150 175 200 225 250 275 300 325 350 375 400 425 450 475 500 525 550 Counts vs. Mass-to-Charge (m/z)
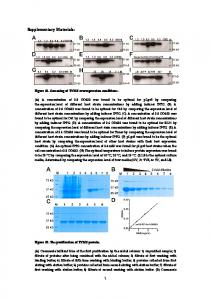
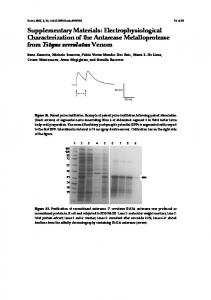
Figure S1. The EIC and product ion scan chromatograms of G1 (a,c) and G2 (b,d) in LC-QTOF-MS negative mode.
Int. J. Mol. Sci. 2016, 17, 1628; doi:ijms17101628
x10 6
S3 of S10
- EIC(495.2963) Scan masterone-3.d
a
1.1 1 0.9 0.8 0.7 0.6 0.5 0.4 0.3 0.2 0.1 0 7
7.5
8
8.5 9 9.5 Counts vs. Acquisition Time (min)
10
10.5
x10 4 -ESI Product Ion (9.400 min) Frag=130.0V
[email protected] (495.2963[z=1] -> **) masterone04-1.d 5.5 5
11
b
75.0092
4.5 4 3.5 3 495.2966
2.5 2
113.0243
1.5 1 0.5
175.0241
317.2488
435.2712
0 75 100 125 150 175 200 225 250 275 300 325 350 375 400 425 450 475 500 525 550 Counts vs. Mass-to-Charge (m/z)
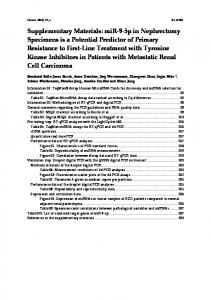
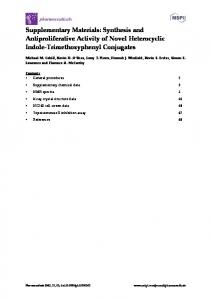
Figure S2. The EIC (a) and product ion scan chromatogram (b) of G3 (RT: 9.4 min) in LC-QTOF-MS negative mode.
Int. J. Mol. Sci. 2016, 17, 1628; doi:ijms17101628
S4 of S10
x10 5 - EIC(509.2756) Scan masterone-3.d Smooth 3.4
a
3.2 3 2.8 2.6 2.4 2.2 2 1.8 1.6 1.4 1.2 1 0.8 0.6 0.4 0.2 0 7.2
7.4
7.6
7.8
8 8.2 8.4 8.6 8.8 9 Counts vs. Acquisition Time (min)
9.2
9.4
9.6
9.8
x10 5 -ESI Scan (8.123 min) Frag=130.0V masterone-3.d 3.4
10
b
3.2 509.2769
3 2.8 2.6 2.4 2.2 2 1.8 1.6 1.4 1.2 1
510.2802
0.8 0.6
511.2869
0.4 0.2 0 506
507
508
509 510 511 512 Counts vs. Mass-to-Charge (m/z)
513
514
515
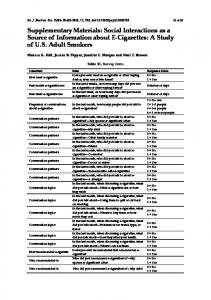
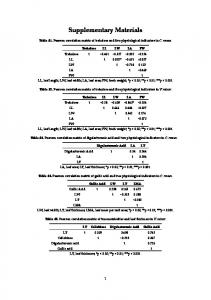
Figure S3. The EIC (a) and product ion scan chromatogram (b) of G4 in LC-QTOF-MS negative mode.
Int. J. Mol. Sci. 2016, 17, 1628; doi:ijms17101628
S5 of S10
x10 5 - EIC(511.2913) Scan masterone-4.d Smooth
a
1.4 1.3 1.2 1.1 1 0.9 0.8 0.7 0.6 0.5 0.4 0.3 0.2 0.1 0 2.6
x10 5
2.8
3
3.2
3.4
3.6
3.8 4 4.2 4.4 4.6 Counts vs. Acquisition Time (min)
4.8
5
5.2
5.4
5.6
-ESI Scan (3.878 min) Frag=130.0V masterone-4.d
5.8
b
1.6 1.5
511.2920
1.4 1.3 1.2 1.1 1 0.9 0.8 0.7 0.6 0.5 0.4 0.3
496.2105
0.2 0.1 0 480
485
490
495
500 505 510 515 520 525 Counts vs. Mass-to-Charge (m/z)
530
535
540
545
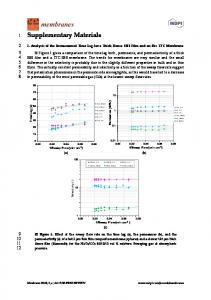
Figure S4. The EIC (a) and full scan chromatogram (b) of G5 in LC-QTOF-MS negative mode.
Int. J. Mol. Sci. 2016, 17, 1628; doi:ijms17101628
S6 of S10
x10 4 - EIC(525.2705) Scan masterone-3.d Smooth 3
a
2.8 2.6 2.4 2.2 2 1.8 1.6 1.4 1.2 1 0.8 0.6 0.4 0.2 0 2
2.5
3
3.5
4 4.5 5 5.5 Counts vs. Acquisition Time (min)
6
x10 3 -ESI Product Ion (4.082 min) Frag=130.0V
[email protected] (525.2705[z=1] -> **) masterone03-2.d 1.6 1.5
6.5
7
7.5
b
75.0093
1.4
112.0165
1.3 1.2 1.1 1 349.2395
0.9
525.2750
0.8 329.2126
0.7 0.6 0.5 149.0595
0.4 0.3
240.0869
299.3560
419.2547
0.2 0.1 0 60
80 100 120 140 160 180 200 220 240 260 280 300 320 340 360 380 400 420 440 460 480 500 520 540 560 Counts vs. Mass-to-Charge (m/z)
Figure S5. The EIC (a) and product ion chromatogram (b) of G6 in LC-QTOF-MS negative mode.
Int. J. Mol. Sci. 2016, 17, 1628; doi:ijms17101628
x10 4
S7 of S10
- EIC(527.2862) Scan masterone-3.d Smooth
a
2 1.8 1.6 1.4 1.2 1 0.8 0.6 0.4 0.2 0 1 x 10 3 1.6
1.5
2
2.5
3
3.5 4 4.5 5 5.5 Counts vs. Acquisition Time (min)
6
6.5
7
7.5
-ESI Produc t Ion (1.705 min) Frag=130.0V CID@ 30.0 (527.2862[z =1] -> **) mas terone03-2.d
b
1.5 75.0091 1.4 113.0238
1.3 1.2 1.1 1 0.9 0.8
351.2526
0.7
527.2859
0.6 0.5 0.4 181.0876
0.3
260.1658 376.2125
143.1047
0.2
311.1048
558.0314 474.9902
0.1 0 60
80 100 120 140 160 180 200 220 240 260 280 300 320 340 360 380 400 420 440 460 480 500 520 540 560 580 Counts v s . Mas s -to-Charge (m/z )
Figure S6. The EIC (a) and product ion chromatogram (b) of G7 in LC-QTOF-MS negative mode.
Int. J. Mol. Sci. 2016, 17, 1628; doi:ijms17101628 x10 5 1.8
S8 of S10
- EIC(415.2160) Scan masterone-4.d Smooth (2)
S1
1.7 1.6 1.5 1.4 1.3 1.2 1.1 1 0.9 0.8 0.7 0.6 0.5 0.4 0.3 0.2 0.1 0 2
2.5
3
3.5
4 4.5 5 5.5 6 Counts vs. Acquisition Time (min)
6.5
7
7.5
8
Figure S7. The EIC of S1 in LC-QTOF-MS negative mode. x10 5 - EIC(413.2003) Scan masterone-3.d Smooth 2.1 2 1.9 1.8 1.7 1.6 1.5 1.4 1.3 1.2 1.1 1 0.9 0.8 0.7 0.6 0.5 0.4 0.3 0.2 0.1 0 7.5
8
8.5
9
9.5 10 10.5 11 Counts vs. Acquisition Time (min)
Figure S8. Cont.
a
11.5
12
12.5
13
Int. J. Mol. Sci. 2016, 17, 1628; doi:ijms17101628 x10 4
S9 of S10
-ESI Product Ion (8.515 min) Frag=130.0V
[email protected] (413.2003[z=1] -> **) masterone04-2.d
2.8
b
96.9603
2.6 2.4 2.2 2 1.8 1.6 1.4 1.2 1 413.2006
0.8 0.6 79.9582
0.4 0.2
141.0913
229.1440
283.1727
327.2177
381.1713
0 60
80
100 120 140 160 180 200 220 240 260 280 300 320 340 360 380 400 420 440 Counts vs. Mass-to-Charge (m/z)
Figure S8. The EIC (a) and product ion chromatogram (b) of S2 in LC-QTOF-MS negative mode.
a
b
Figure S9. Cont.
Int. J. Mol. Sci. 2016, 17, 1628; doi:ijms17101628
S10 of S10
c
d
Figure S9. The Electron ionization mass spectra of TMS derivatives of M1(a), M2(b), M3(c), M5(d).