Support Vector Machines for Spatiotemporal Tornado Prediction INDRA ADRIANTO1, THEODORE B. TRAFALIS1, and VALLIAPPA LAKSHMANAN2 1
School of Industrial Engineering, University of Oklahoma, 202 West Boyd, Room 124, Norman, OK 73019, USA Phone: (405) 325-3721, Fax: (405) 325-7555 Emails:
[email protected];
[email protected]
2
Cooperative Institute of Mesoscale Meteorological Studies (CIMMS) University of Oklahoma & National Severe Storms Laboratory (NSSL) 120 David L. Boren Blvd, Norman, OK 73072-7327, USA Phone: (405) 325-6569 Email:
[email protected] The use of support vector machines for predicting the location and time of tornadoes is presented. In this paper, we extend the work by Lakshmanan et al. (2005a) to use a set of 33 storm days and introduce some variations that improve the results. The goal is to estimate the probability of a tornado event at a particular spatial location within a given time window. We utilize a least-squares methodology to estimate shear, quality control of radar reflectivity, morphological image processing to estimate gradients, fuzzy logic to generate compact measures of tornado possibility and support vector machine classification to generate the final spatiotemporal probability field. On the independent test set, this method achieves a Heidke’s Skill Score (HSS) of 0.60 and a Critical Success Index (CSI) of 0.45.
Keywords: Support vector machines; Tornado prediction; Fuzzy logic.
1
1. Introduction
In the literature, automated tornado detection or prediction algorithms such as, the Tornadovortex-signature Detection Algorithm (TDA) (Mitchell et al., 1998), Mesocyclone Detection Algorithm (MDA) (Stumpf et al., 1998), and MDA+NSE (near-storm environment) neural networks (Lakshmanan et al., 2005b), have been based on analyzing tornado “signatures” that appear in Doppler radar velocity data. However, none of those algorithms was sufficiently skillful. Lakshmanan et al. (2005a) formulated the tornado detection/prediction problem differently following a spatiotemporal approach. This new approach attempted to estimate the probability of a tornado event at a particular spatial location within a given time window. The time window was set to be 30 minutes. Based on a real-time test of algorithms and displays concepts of the Warning Decision Support System–Integrated Information (WDSS-II), Adrianto et al. (2005), noted that users of algorithm information prefer algorithms that show information in terms of spatial extent rather than numerical or categorical information. The reasons of this preference might be that a spatial grid provides a better measure of uncertainty and is more amenable to human interrogation and decision making (Lakshmanan et al., 2005a). Thus, users would probably prefer a tornado prediction algorithm that provides spatial grids of tornado likelihood to classify radar-observed circulations. The initial work by Lakshmanan et al.(2005a) used only three storm days to extract the spatiotemporal tornado prediction data set. In this paper, we continue the work to use 33 storm days to generate a new data set, introduce
2
some variations, and utilize support vector machines (SVMs) to generate the final spatiotemporal probability field. This approach is then implemented under the WDSS-II platform for displaying the results. The WDSS-II, a LINUX-based system developed by researchers at the University of Oklahoma, and the National Severe Storms Laboratory (NSSL), is composed of various machine-intelligent algorithms and visualization techniques for weather data analysis and severe weather warnings and forecasting (Hondl, 2002). The SVM algorithm was developed by Vapnik and has become a powerful method in machine learning, applicable to both classification and regression (Boser et al., 1992; Vapnik, 1998). Our motivation to use the SVM algorithm in our approach is that this algorithm has been used in real-world applications (Joachims, 1998; Burges, 1998; Brown et al., 2000) and is well known for its superior practical results. Application of SVMs in the field of tornado forecasting has been investigated by Trafalis et al. (2003, 2004, 2005) using the same data set used by Stumpf et al. (1998). Trafalis et al. (2003) compared SVMs with other classification methods like neural networks and radial basis function networks and showed that SVMs are more effective in mesocyclone/tornado classification. Trafalis et al. (2004; 2005) then suggested that Bayesian SVMs and Bayesian neural networks provide significantly higher skills compared to traditional neural networks. The paper is organized as follows. In Section 2 and 3, SVMs and skill scores for tornado prediction are explained. Section 4 presents the methodology for solving the spatiotemporal tornado prediction/detection problem. Section 5 shows experimental results. Finally, conclusions are drawn in section 6.
3
2. Support Vector Machines
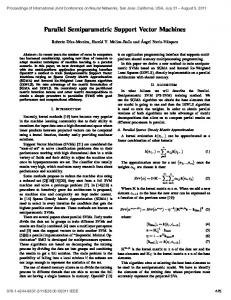
In the case of separating the set of training vectors into two classes, the SVM algorithm constructs a hyperplane that has maximum margin of separation (Figure 1). The SVM formulation (the primal problem) can be written as follows (Haykin, 1999): min φ ( w, ξ ) =
l 1 2 w + C (∑ ξi ) 2 i =1
subject to
(1)
y i ( w T xi + b ) ≥ 1 − ξ i
ξi ≥ 0 i = 1,..., l where w is the weight vector that is perpendicular to the separating hyperplane, b is the bias of the separating hyperplane, ξi is a slack variable, and C is a user-specified parameter which represents a trade off between misclassification and generalization. Using Lagrange multipliers αι, the dual formulation of the above problem becomes (Haykin 1999): l
max Q(α ) = ∑ α i − i =1
1 l l ∑∑ α iα j yi y j xi x j 2 i =1 j =i
subject to
(2)
l
∑αy i =1
i
i
=0
0≤α ≤C i = 1,..., l
4
l
Then the optimal solution of problem (1) is given by w = ∑ α i yi xi where α = (α1 ,..., α l ) i =1
is the optimal solution of problem (2). The decision function is defined as:
g (x ) = sign ( f ( x )) , where f (x ) = wT x + b
(3)
From the decision function above, we can see that SVMs produce a value that is not a probability. According to Platt (1999), we can map the SVM outputs into probabilities using a sigmoid function.
The posterior probability using a sigmoid function with
parameters A and B can be written as follows (Platt, 1999):
P( y = 1 f ) =
1 1 + exp( Af + B )
(4)
[Figure 1 places here]
For nonlinear problems, SVMs map the input vector x into a higher-dimensional feature space through some nonlinear mapping Φ (Fig. 2) and construct an optimal separating hyperplane (Vapnik, 1998). Suppose we map the vector x into a feature space vector (Φ1(x),…,Φn(x),…). An inner product in feature space has an equivalent representation defined through a kernel function K as K(x1, x2) = (Vapnik, 1998). Hence, we can introduce the inner-product kernel as K(xi,xj) = (Haykin, 1999) and substitute dot-product in the dual problem (2) with this kernel function. In this study, three kernel functions are used (Haykin, 1999): 1. linear: K(xi,xj) = xiT x j 2. polynomial: K(xi,xj) = ( xiT x j + 1) p , where p is the degree of polynomial
5
3. radial basis function (RBF): K(xi,xj) = exp⎛⎜ − γ xi − x j ⎝
2
⎞⎟ , where γ is the ⎠
parameter that controls the width of RBF.
[Figure 2 places here]
3. Skill Scores for Tornado Prediction
In order to measure the performance of a tornado prediction algorithm, it is necessary to compute scalar skill scores such as the Probability of Detection (POD), False Alarm Ratio (FAR), Bias, Critical Success Index (CSI), and Heidke’s Skill Score (HSS), based on a “confusion” matrix or contingency table (Table I). Those skill scores are defined as:
POD =
a a+c
(5)
FAR =
b a+b
(6)
Bias =
a+b a+c
(7)
CSI =
a a+b+c
(8)
HSS =
2(a ⋅ d − b ⋅ c) (a + c)(c + d ) + (a + b)(b + d )
(9)
[Table I places here]
6
The POD gives the fraction of observed events that are correctly forecast (Wilks, 1995). It has a perfect score of 1 and its range is 0 to 1. On the other hand, the FAR has a perfect score of 0 with its range of 0 to 1 and measures the ratio of forecast events that are observed to be non events (Wilks, 1995). The Bias calculates the ratio of “yes” forecasts to the “yes” observations and shows whether the forecast system is under forecast (Bias < 1) or over forecast (Bias > 1) events with a perfect score of 1 (Wilks, 1995). The CSI is a conservative estimate of skill since it does not consider the correct null events (Donaldson et al., 1975). The HSS (Heidke, 1926) is commonly used in the rare event forecasting since it considers all elements in the confusion matrix. It has a perfect score of 1 and its range is -1 to 1. Therefore, a classifier with the highest HSS is preferred in this paper.
4. Methodology
In this section, we describe our formulation for solving the spatiotemporal tornado prediction/detection problem. The main difference between the method by Lakshmanan et al. (2005a) with our approach in this paper is that they converted polar radar data onto equilatitude-longitude grids, whereas in our approach, we operated directly on the polar data. The polar data provides increased spatial resolution close to the radar. Interpolation to latitude-longitude grids causes substantial loss, especially in the shear fields (see Figure 3). The latitude-longitude information involves subsampling, so measures such as the shear tend to be inaccurate on those grids. Another significant difference is that we implemented
7
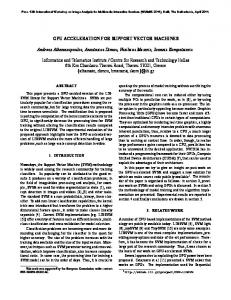
SVMs in this paper, whereas Lakshmanan et al. (2005a) used neural networks for the classification method. A schematic diagram for constructing the spatiotemporal tornado prediction with SVMs can be found in Figure 4.
[Figure 3 places here] [Figure 4 places here]
4.1. Radar Data
This spatiotemporal tornado prediction/detection used polar radar data from the National Climatic Data Center . We used 33 storm days consisting of 219 volume scans (subsampled to be 30 minutes apart) that include 20 tornadic and 13 nontornadic (null) storm days from 27 different WSR-88D (Weather Surveillance Radar 88 Doppler) radars. Fifteen storm days were chosen for the training/validation set and the rest of them were selected for the independent test set.
4.2. Creating the tornado truth field
The MDA ground truth database was used to create the tornado truth field where circulations seen on radar were associated to tornadoes observed on the ground within the next 20 minutes (Stumpf et al., 1998). In this paper, the method to form the truth field is
8
the same as the one used by Lakshmanan et al. (2005a) where the hand-truth circulations were used as a starting point and the radar circulation locations were mapped at every volume scan to the earth’s surface. The difference is that instead of using the Manhattan distance to represent the radius of influence of a ground truth observation, we used the Euclidean distance because it leads to accurate spatial distances (Figure 5). The Manhattan distance is not a distance in three-dimensional space. The increased efficiency of the Manhattan distance was not a concern in this work. In Figure 5, the movement of the tornadic circulation with time is shown where the longer paths indicate tornadic circulations currently strong on radar while the single circle corresponds to a tornadic circulation that will produce a tornado in 20 minutes. The F-scale intensity also is shown in Figure 5, but our target field is a spatial field that has only 1s for tornadic and -1s for non-tornadic regions. Since the observed data corresponds only with the current time, the data needs to be corrected in time and space using a linear forecast to indicate where the tornado is likely to happen within the next 30 minutes, based on current observations. Lakshmanan et al. (2003a) suggested that a linear forecast is quite skillful for intervals up to 30 minutes.
[Figure 5 places here]
4.3. Tornado Possibility Inputs
The tornado possibility inputs in our approach were derived from the Level II reflectivity and velocity data.
The reflectivity data were cleaned up using a neural network
9
(Lakshmanan et al., 2003b). The cleaned up reflectivity data were then used for the computation of reflectivity gradients (Figure 6). Tornadoes are more likely to occur in the areas of a storm that have tight gradients in reflectivity and are in the lagging region of any supercell structures (Lakshmanan et al., 2005a). For a storm moving north-east, the northsouth gradient direction (Figure 6) is more interesting, since tornadoes are more likely to occur in the south-west region of the storm.
[Figure 6 places here]
The local, linear least squares derivatives (LLSD) technique (Smith and Elmore, 2004) was implemented to estimate the azimuthal shear and radial divergence from velocity data. Decker (2004) found several rotation signatures in the azimuthal shear composites and discovered that tornadoes are more likely to occur in regions exhibiting high positive shear and high negative shear, and proximate to high reflectivity values. The proximity criteria of the azimuthal shear were defined by morphological dilation (Jain, 1989) of the positive and negative shear field separately at low and mid levels and searching for areas of overlap. The morphological dilation of reflectivity fields at low level and aloft was also applied in our approach. The morphologically dilated azimuthal shear fields at low level and the morphologically dilated reflectivity fields at low level and aloft are shown in Figures 7 and 8 respectively. [Figure 7 places here] [Figure 8 places here]
10
4.3. Fuzzy Logic Combination
The tornado possibility field was created by aggregating spatial fields of areas with tight gradients in the appropriate directions (Figure 6) and of areas proximate to high positive and negative shear (Figure 7), as well as, high reflectivity (Figure 8) values using a fuzzy logic weighted aggregate. The breakpoints for the aggregates were determined by manual comparison of the spatial fields to the ground truth spatial field, such that, a number of pixels in each tornado would achieve high fuzzy possibility values (Lakshmanan et al., 2005a). The fuzzy tornado possibility field is shown in Figure 9.
[Figure 9 places here]
4.5. Classification
In order to create tornado possibility regions, the tornado possibility field was clustered using region growing (Jain, 1989). Each tornado possibility region was compared to the tornado truth field. The region was classified as a tornadic region if a corresponding tornado was observed in the ground truth. For training a classifier, we generated the tabular data (data set) relating the attributes of each region to its tornadic (class 1) or non-tornadic (class -1) classification. The attributes were local statistics (average, maximum, minimum,
11
and weighted average) of various spatial/input fields in each region computed from the values at each pixel in the region of those input fields. The data set contained 2008 tornado possibility regions/data points and 53 attributes (Table II) extracted from 33 different storm days. This data set was then divided into a training/validation and independent test set in the ratio about 55:45. The training/validation set from 15 storm days (Table III) contained 1106 regions of which 123 (11%) were tornadic. The independent test set from 18 storm days (Table IV) contained 902 regions of which 55 (6%) were tornadic. Before training the SVM, the input features were normalized so that the inputs have means of zero and standard deviations of 1 over the entire data set.
[Table II places here] [Table III places here] [Table IV places here]
With the intention of finding the “best” support vector classifier that has the highest Heidke’s Skill Score, we trained the SVM with the bootstrap validation (Efron and Tibshirani, 1993) on the training/validation set with 1000 bootstrap replications so that we had 1000 different combinations of training/validation data. In the bootstrap validation, the training/validation set is divided into two bootstrap sample sets; the first set (bootstrap training set to train the SVM) has n instances drawn with replacement from the original training/validation set, and the second set (validation set to test the SVM) contains the remaining instances not being drawn after n samples where n is the number of data points in the training/validation set (Efron and Tibshirani, 1993). Note that, the probability of an
12
instance not being chosen is (1 – 1/n)n ≈ e-1 ≈ 0.368. Hence, the expected number of distinct instances in the bootstrap training set is 0.632n. Anguita et al. (2000) has shown that the bootstrap validation can be used for selecting SVM classifiers with good generalization properties. The SVM outputs were then mapped into posterior probabilities using a sigmoid function (Platt, 1999). If the probability is greater than or equal to 0.5, the region is considered tornadic. On the other hand, the region is considered non-tornadic if the probability is less than 0.5. Based on these outputs, the performance of a support vector classifier can be determined by computing scalar skill scores commonly used in the weather forecasting, such as POD, FAR, CSI, Bias, and HSS.
5. Experimental Results
For SVMs, choosing the C and kernel function parameters that give good generalization properties was a challenging task. In order to find those parameters, several experiments with the bootstrap validation were conducted using different combinations of kernel functions (linear, polynomial, radial basis function) and C parameter values. The best support vector classifier was chosen in which the classifier has the highest mean Heidke’s Skill Score based on the bootstrap validation results after 1000 replications. The best classifier used the radial basis function kernel with γ = 0.001 and C = 100. This classifier was then tested on test cases drawn randomly with replacement using the bootstrap resampling (Efron and Tibshirani, 1993) with 1000 replications on the independent test set. Results of training stage and test run with 95% confidence intervals are shown in Table V.
13
The displays of the results are shown in Figures 10 and 11. In Figure 11, for example, it can be seen that at region #111, the probability of this region being tornadic within the next 30 minutes is 0.79. [Table V places here] [Figure 10 places here] [Figure 11 places here]
In the previous paragraph, it has been explained that the selection of the C and kernel function parameters could influence the performance of our SVM-based tornado prediction algorithm. Another relevant factor that might affect the performance was choosing the attributes or variables for the data set that are important for predicting tornadoes. The attributes in our data set were derived from the level II reflectivity and velocity data from WSR-88D radars. For future research, incorporating more spatial inputs and attributes, such as from NSE data, satellite data, dual-polarization radar data, and multiple radars data, needs to be investigated. Another challenging task in constructing our tornado prediction algorithm was labeling each tornado possibility region into a tornadic or non-tornadic region. This task was time consuming since we had to compare each region with the tornado truth field manually. In a real-time application, if new data are coming online, we can predict the outcomes using the SVM classifier instantly, but we cannot add the new data directly into the training set since we need to label and compare them with the ground truth. The ground truth data are not available directly because these data are obtained after the locations of
14
tornado events have been examined. Therefore, it would take time to update the SVM classifier with new data points added in the training set. Comparison of support vector machine algorithm with neural network (NN) and linear discriminant analysis (LDA) algorithms for classification can be seen in Table VI and Figure 12. The training/validation set and independent test set for NN and LDA were the same as the ones used for SVM training and testing. The experiments for the NN and LDA were performed in Matlab 7.0 using Neural Network and Discriminant Analysis Toolboxes, respectively. We trained several feed-forward neural networks (with different numbers of hidden nodes) on the training set. The TRAINGM (gradient descent with momentum back-propagation) network training function was used with a learning rate of 0.01 and a momentum of 0.9. Training stopped when 5000 epoch was reached. The best neural network had 4 hidden nodes at which the HSS was maximum. For LDA, we developed prediction equations on the training set that would discriminate between tornadic and non-tornadic regions. The experimental results on the independent test set were reported with 95% confidence intervals after bootstrapping with 1000 replicates. Note that, if the confidence intervals overlap each other, the skill score difference is not statistically significant.
The POD results indicated that the LDA classifier has the highest score
compare to the SVM and NN classifiers, but the LDA classifier has the worst score on the FAR. Although having a high POD score, the LDA classifier suffers by a high FAR score which is not preferable since it would predict more “yes” forecast events that are observed to be non events. Decreasing the FAR score and increasing the POD score at the same time is one of the objectives in weather forecasting. The SVM classifier has the best FAR score but compared to the NN classifier, the difference was not statistically significant since both
15
confidence intervals for the FAR overlapped. However, the mean difference between the SVM and NN by 0.08 was considered a good indication that the SVM classifier performed better than the NN classifier on the FAR. The Bias scores showed that the LDA classifier (Bias of 2.04 > 1) tends to be over forecast compared to the SVM and NN classifiers that both have the Bias scores closed to 1. For the CSI and HSS scores, the SVM classifier has better scores than the NN and LDA classifiers but the differences were not statistically significant since all confidence intervals for the CSI and HSS overlapped. In general, the results of the LDA classifier were considered not as good as the SVM and NN classifiers since the LDA classifier would predict more false alarms because of a high FAR score and have a tendency to be over forecast because of a high Bias score. The results also showed that the SVM classifier performed slightly better than the NN classifier. The main advantage of SVMs compared to NNs is that SVM training always finds a global optimum solution, whereas NN training might have multiple local minima solutions (Burges, 1998).
[Table VI places here] [Figure 12 places here]
Using neural networks on the mesocyclone detection and near storm environment algorithms, Lakshmanan et al. (2005b) achieved a HSS of 0.41 using just the MDA parameters, a HSS of 0.45 using a combination of MDA and NSE parameters, a CSI of 0.29 for the MDA-only neural network, and a CSI of 0.32 with both MDA and NSE parameters on an independent test set of 27 storm days. Even though our results are better than theirs, we cannot make a direct comparison since we used different approach and data
16
set.
However, our approach shows potential to be more intuitive than other tornado
detection or prediction algorithms in terms of spatial extent instead of numerical or categorical information that were used by others. The spatial grids of tornado likelihood provided by our approach to classify radar-observed circulations can help users or weather forecasters in their decision-making process in real-time operations. In addition, using the SVM as the tornado possibility region classifier will provide a good tornado prediction since the SVM classifiers performed well compared to the NN and LDA classifiers. Severe weather warnings are issued by the National Weather Service (NWS) Forecast Office for specified geopolitical boundaries (county-based warnings) where the severe weather will occur within this specified geopolitical boundary during the valid time of the warning (Browning and Mitchell, 2002).
Browning and Mitchell (2002) also
suggested using the polygon-based warnings for a better warning system. Our approach can be easily implemented in these warning systems since it provides the spatial grids of regions that are likely to be tornadic within the next 30 minutes.
6. Conclusions
In this paper, we presented the use of SVMs for predicting tornadoes using a spatiotemporal approach. Our work has established that SVMs can be applied in our formulation successfully. Our approach provides tornado prediction in terms of spatial extent instead of numerical or categorical information which is preferred by users of algorithm information and can be used as guidance for county-based or polygon-based
17
tornado warnings. One of the advantages of our approach is that it may increase the lead time of tornado warning since we estimate the probability that there will be a tornado at a particular spatial location in the next 30 minutes, while the average lead time of a tornado being predicted by the National Weather Service currently is 18 minutes. The results are promising, but we need to consider more spatial inputs, for example the NSE data, and other classification methods, such as Bayesian SVMs and Bayesian neural networks, that can improve the results. A real-time test of the algorithm needs to be investigated as well in order to evaluate the usefulness of the algorithm in the tornado warning decision-making process.
Acknowledgements
The authors would like to thank Dr. Cihan H. Dagli, the Editor-in-Chief of this journal, and two anonymous referees for comments that greatly improved the paper. Funding for this research was provided under the National Science Foundation Grant EIA-0205628 and NOAA-OU Cooperative Agreement NA17RJ1227.
References
Adrianto, I., Smith, T. M., Scharfenberg, K. A., and Trafalis, T. B. (2005) “Evaluation of various algorithms and display concepts for weather forecasting”, in 21st
18
International Conference on Interactive Information Processing Systems (IIPS) for Meteorology, Oceanography, and Hydrology (San Diego, CA, American Meteorological Society, CD–ROM, 5.7). Anguita, D., Boni, A., and Ridella, S. (2000) “Evaluating the generalization ability of Support Vector Machines through the Bootstrap”, Neural Processing Letters, 11(1), 51–58. Boser, B. E., Guyon, I. M., and Vapnik, V. N. (1992) "A training algorithm for optimal margin classifiers", in D. Haussler, editor, 5th Annual ACM Workshop on COLT (ACM Press, Pittsburgh, PA), 144-152. Burges, C., (1998) “A tutorial on support vector machines for pattern recognition”, Data
Mining and Knowledge Discovery, 2(2), 121-167. Brown, M. P., Grundy, W. N., Lin, D., Cristianini, N., Sugnet, C. W., Furey, T. S., Ares Jr., M., and Haussler, D. (2000) “Knowledge-based analysis of microarray gene expression data by using support vector machines”, in Proceedings of the National
Academy of Sciences of the United States of America, 97(1), 262-267. Browning, P. R., and Mitchell, M. (2002) “The advantages of using polygons for the verification of NWS warnings”, in 16th Conference on Probability and Statistics in
the Atmospheric Sciences (Orlando, FL, American Meteorological Society, JP1.1). Decker, T. B. (2004) Shear patterns near severe tornadic thunderstorms, Master’s thesis, School of Meteorology, University of Oklahoma. Donaldson, R., Dyer, R., and Krauss, M. (1975) “An objective evaluator of techniques for predicting severe weather events”, in Preprints, Ninth Conference on Severe Local
Storms (Norman, OK), American Meteorological Society, 321–326.
19
Efron, B. and Tibshirani, R. J. (1993) An introduction to the bootstrap (Chapman & Hall, New York). Haykin, S. (1999) Neural Network: A Comprehensive Foundation (2nd Edition, Prentice Hall, New Jersey). Heidke, P. (1926) “Berechnung des erfolges und der gute der windstarkvorhersagen im sturmwarnungsdienst”, Geografiska Annaler, 8, 301–349. Hondl, K. (2002) “Current and planned activities for the warning decision support systemintegrated information (WDSS-II)”, in 21st Conference on Severe Local Storms (San Antonio, TX), American Meteorological Society. Jain, A. (1989) Fundamentals of Digital Image Processing (Prentice Hall, Englewood Cliffs, New Jersey). Joachims, T. (1998) “Text categorization with support vector machines”, in Proceedings of
10th European Conference on Machine Learning (Springer-Verlag), 137-142. Lakshmanan, V., Rabin, R. and DeBrunner, V. (2003a) “Multiscale storm identification and forecast,” Atmospheric Research, 67-68, 367–380. Lakshmanan, V., Hondl, K., Stumpf, G., and Smith, T. (2003b) “Quality control of weather radar data using texture features and a neural network”, in 5th International
Conferece on Advances in Pattern Recognition (Kolkota, India), IEEE. Lakshmanan, V., Adrianto, I., Smith, T., and Stumpf, G. (2005a) “A spatiotemporal approach to tornado prediction”, in Proceedings of 2005 IEEE International Joint
Conference on Neural Networks (Montreal, Canada), 3, 1642 – 1647. Lakshmanan, V., Stumpf, G., and Witt, A. (2005b) “A neural network for detecting and diagnosing tornadic circulations using the mesocyclone detection and near storm
20
environment algorithms”, in 21st International Conference on Information
Processing Systems (San Diego, CA), American Meteorological Society, CD–ROM, J5.2. Mitchell, E. D., Vasiloff, S. V., Stumpf, G. J., Eilts, M. D., Witt, A., Johnson, J. T., and Thomas, K. W. (1998) “The national severe storms laboratory tornado detection algorithm”, Weather and Forecasting, 13(2), 352–366. Platt, J. C. (1999) “Probabilistic outputs for support vector machines and comparisons to Regularized likelihood methods”, in Advances in Large Margin Classifiers, A. Smola, P. Bartlett, B. Schölkopf, D. Schuurmans, eds., (MIT Press), 61-74. Smith, T. M. and Elmore, K. L. (2004) “The use of radial velocity derivatives to diagnose rotation and divergence”, in 22nd Conference on Severe Local Storms (Hyannis, MA), American Meteorological Society, CD Preprints. Stumpf, G., Witt, A., Mitchell, E. D., Spencer, P., Johnson, J., Eilts, M., Thomas, K., and Burgess, D. (1998) “The national severe storms laboratory mesocyclone detection algorithm for the WSR-88D”, Weather and Forecasting, 13(2), 304–326. Trafalis, T. B., Ince, H. and Richman, M. (2003) “Tornado detection with support vector machines”, in Computational Science -ICCS 200, P. M. Sloot, D. Abramson, A. Bogdanov, J. J. Dongarra, A. Zomaya, and Y. Gorbachev, eds., 202 – 211. Trafalis, T. B., Santosa, B., and Richman, M. (2004) “Bayesian neural networks for tornado detection”, WSEAS Transactions on Systems, 3(10), 3211–3216. Trafalis, T. B., Santosa, B., and Richman, M. (2005) “Learning networks for tornado forecasting: a Bayesian perspective”, WIT Transaction on Information and
Communication Technologies, 35, 5-14.
21
Vapnik, V. N. (1998) Statistical Learning Theory (Springer Verlag. New York). Wilks, D. (1995) Statistical Methods in Atmospheric Sciences (Academic Press, San Diego).
22
Indra Adrianto received his B.S. in mechanical engineering from Bandung Institute of Technology, Indonesia, in 2000. In 2003, he earned his M.S. in industrial engineering from the University of Oklahoma, Norman, OK, USA. Currently, he is a graduate research assistant under Dr. Theodore B. Trafalis and working toward his Ph.D. degree in industrial engineering at the University of Oklahoma. His research interests include kernel methods, support vector machines, artificial neural networks, and engineering optimization. Dr. Theodore B. Trafalis is a Professor in the School of Industrial Engineering at the University of Oklahoma, Norman, OK, USA. He earned his B.S. in mathematics from the University of Athens, Greece, his M.S. in Applied Mathematics, MSIE, and Ph.D. in Operations Research from Purdue University, USA. He is a member of INFORMS, SIAM, Hellenic Operational Society, International Society of Multiple criteria Decision Making, and the International Society of Neural Networks. His is listed in the 1993/1994 edition of Who’s Who in the World. He was a visiting Assistant Professor at Purdue University (19891990), an invited Research Fellow at Delft University of Technology, Netherlands (1996), and a visiting Associate Professor at Blaise Pascal University, France and at the Technical University of Crete (1998). He was also an invited visiting Associate Professor at Akita Prefectural University, Japan (2001). His research interests include: operations research/management science, mathematical programming, interior point methods, multiobjective optimization, control theory, computational and algebraic geometry, artificial neural networks, kernel methods, evolutionary programming and global optimization. He is an associate editor of Computational Management Science and the Journal of Heuristics. Dr. Valliappa Lakshmanan is a Research Scientist at the Cooperative Institute of Mesoscale Meteorological Studies, a joint institute between the University of Oklahoma and the National Oceanic and Atmospheric Administration (NOAA). He received degrees from the University of Oklahoma (PhD, 2002), The Ohio State University (M.S., 1995) and the Indian Institute of Technology, Madras (B.Tech, 1993). His research interests are in automated machine intelligence algorithms involving image processing, artificial neural networks and optimization procedures applied to the detection and prediction of severe weather phenomena. He serves on the Artificial Intelligence Science and Technology Advisory Committee of the American Meteorological Society.
23
Table I. Confusion matrix.
Yes Forecast No
Observation Yes No hit false alarm a b miss correct null c d
24
Table II. List of attributes of each region/data point in the data set. No. 1 2 3 4 5 6 7 8 9 10 11 12 13 14 15 16 17 18 19 20 21 22 23 24 25 26 27
Attributes
No. -1
Azimuthal Shear Low Level Average (s ) -1 Azimuthal Shear Low Level Maximum (s ) -1 Azimuthal Shear Low Level Minimum (s ) -1 Azimuthal Shear Low Level Weighted Average (s ) -1 Azimuthal Shear Mid Level Average (s ) -1 Azimuthal Shear Mid Level Maximum (s ) -1 Azimuthal Shear Mid Level Minimum (s ) -1 Azimuthal Shear Mid Level Weighted Average (s ) -1 Dilated Negative Shear Low Level Average (s ) -1 Dilated Negative Shear Low Level Maximum (s ) -1 Dilated Negative Shear Low Level Minimum (s ) -1 Dilated Negative Shear Low Level Weighted Average (s ) -1 Dilated Negative Shear Mid Level Average (s ) -1 Dilated Negative Shear Mid Level Maximum (s ) -1 Dilated Negative Shear Mid Level Minimum (s ) -1 Dilated Negative Shear Mid Level Weighted Average (s ) -1 Dilated Positive Shear Low Level Average (s ) -1 Dilated Positive Shear Low Level Maximum (s ) -1 Dilated Positive Shear Low Level Minimum (s ) -1 Dilated Positive Shear Low Level Weighted Average (s ) -1 Dilated Positive Shear Mid Level Average (s ) -1 Dilated Positive Shear Mid Level Maximum (s ) -1 Dilated Positive Shear Mid Level Minimum (s ) -1 Dilated Positive Shear Mid Level Weighted Average (s ) Dilated Reflectivity Aloft Average (dBZ) Dilated Reflectivity Aloft Maximum (dBZ) Dilated Reflectivity Aloft Minimum (dBZ)
28 29 30 31 32 33 34 35 36 37 38 39 40 41 42 43 44 45 46 47 48 49 50 51 52 53
25
Attributes Dilated Reflectivity Aloft Weighted Average (dBZ) Dilated Reflectivity Low Level Average (dBZ) Dilated Reflectivity Low Level Maximum (dBZ) Dilated Reflectivity Low Level Minimum (dBZ) Dilated Reflectivity Low Level Weighted Average (dBZ) -1 Gate to Gate Shear Low Level Average (s ) -1 Gate to Gate Shear Low Level Max (s ) -1 Gate to Gate Shear Low Level Min (s ) -1 Gate to Gate Shear Low Level Weighted Average (s ) Gradient Direction Average Gradient Direction Maximum Gradient Direction Minimum Gradient Direction Weighted Average Reflectivity Aloft Average (dBZ) Reflectivity Aloft Maximum (dBZ) Reflectivity Aloft Minimum (dBZ) Reflectivity Aloft Weighted Average (dBZ) Reflectivity Gradient Low Level Average Reflectivity Gradient Low Level Maximum Reflectivity Gradient Low Level Minimum Reflectivity Gradient Low Level Weighted Average Reflectivity Low Level Average (dBZ) Reflectivity Low Level Maximum (dBZ) Reflectivity Low Level Minimum (dBZ) Reflectivity Low Level Weighted Average (dBZ) 2 Region Size (km )
Table III. The cases for the training/validation set. No.
Radar
1 2 3 4 5 6 7 8 9 10 11 12 13 14 15
KABR KEVX KEWX KGRB KLCH KLZK KMVX KPUX KTBW KTLX KFWS KHDX KIWA KMPX KTLX
Date
Location
5/31/1996 Aberdeen, SD 10/4/1995 Eglin AFB, FL 5/27/1997 Austin/San Antonio, TX 7/18/1996 Green Bay, WI 1/2/1999 Lake Charles, LA 1/21/1999 Little Rock, AR 6/6/1999 Grand Forks, ND 5/31/1996 Pueblo, CO 10/7/1998 Tampa, FL 5/3/1999 Oklahoma City, OK 5/5/1995 Dallas/Ft. Worth, TX 10/30/1998 Holloman AFB, NM 9/28/1995 Phoenix, AZ 8/9/1995 Minneapolis/St. Paul, MN 9/28/1995 Oklahoma City, OK
Case Tornadic Tornadic Tornadic Tornadic Tornadic Tornadic Tornadic Tornadic Tornadic Tornadic Null Null Null Null Null Total:
# of volume # of volume scans scans with a tornado(es) 5 4 7 6 1 1 6 5 6 6 23 11 3 3 2 2 8 6 12 12 14 0 12 0 7 0 2 0 3 0 111 56
26
# of candidate # of regions regions/clusters deemed tornadic 31 4 60 12 2 2 38 8 103 10 391 37 8 6 2 2 53 9 161 33 124 0 32 0 94 0 3 0 4 0 1106 123
Table IV. The cases for the independent test set. No.
Radar
Date
Location
Case
1 2 3 4 5 6 7 8 9 10 11 12 13 14 15 16 17 18
KBMX KDDC KENX KILX KJAN KLBB KLVX KMHX KMLB KMPX KABR KDDC KFFC KIND KINX KINX KMLB KOUN
4/8/1998 5/26/1996 5/31/1998 4/19/1996 4/20/1995 6/4/1995 5/28/1996 8/26/1998 2/23/1998 3/29/1998 7/9/1995 6/3/1993 6/12/1996 6/20/1995 5/14/1996 5/7/1994 3/25/1992 3/28/1992
Birmingham, AL Dodge City, KS Albany, NY Lincoln, IL Jackson, MS Lubbock, TX Louisville, KY Morehead City, NC Melbourne, FL Minneapolis/St. Paul, MN Aberdeen, SD Dodge City, KS Atlanta, GA Indianapolis, IN Tulsa, OK Tulsa, OK Melbourne, FL Norman, OK
Tornadic Tornadic Tornadic Tornadic Tornadic Tornadic Tornadic Tornadic Tornadic Tornadic Null Null Null Null Null Null Null Null Total:
# of volume # of volume scans scans with a tornado(es) 5 5 6 3 9 7 8 8 6 3 4 3 5 5 2 1 5 5 7 3 7 0 5 0 4 0 4 0 8 0 13 0 6 0 4 0 108 43
27
# of candidate # of regions regions/clusters deemed tornadic 63 6 30 3 116 9 64 14 47 3 35 3 70 5 23 1 22 7 140 4 25 0 7 0 7 0 12 0 48 0 155 0 34 0 4 0 902 55
Table V. Results of training stage and test run for SVMs. The mean performance scores after 1000 bootstrap replications and the 95% confidence intervals are reported here. Measure POD FAR CSI Bias HSS
Validation 0.57 ± 0.13 0.18 ± 0.10 0.50 ± 0.10 0.69 ± 0.21 0.62 ± 0.09
28
Test 0.57 ± 0.13 0.31 ± 0.14 0.45 ± 0.12 0.83 ± 0.20 0.60 ± 0.11
Table VI. Results of SVM, NN, and LDA on the independent test set. The bold scores indicate the best mean scores. The mean performance scores after 1000 bootstrap replications and the 95% confidence intervals are reported here. Measure POD FAR CSI Bias HSS
SVM 0.57 ± 0.13 0.31 ± 0.14 0.45 ± 0.12 0.83 ± 0.20 0.60 ± 0.11
29
NN 0.58 ± 0.13 0.39 ± 0.13 0.43 ± 0.12 0.96 ± 0.24 0.57 ± 0.12
LDA 0.78 ± 0.11 0.61 ± 0.09 0.35 ± 0.08 2.04 ± 0.46 0.47 ± 0.10
x2
Support vectors
2 Margin of separation = w
Class 1, yi = 1
x1
Misclassification point
T
ξi Class -1, yi = -1
w xi + b = 1 wTxi + b = 0, separating hyperplane wTxi + b = -1
Support vectors
Figure 1. Illustration of support vector machines.
30
Figure 2. A kernel map converts a nonlinear problem into a linear problem.
31
1 km
1° 1 km 1 km
Figure 3. Black lines depict the polar radar grids; each polar radar pixel (gate) represents a 1 km x 1° area. Red lines depict the latitude-longitude grids; each pixel represents a 1 km x 1 km area. The latitude-longitude grids used in Lakshmanan et al. (2005a) had a resolution of 0.01 degrees x 0.01 degrees which is approximately 1 km x 1 km at mid-latitudes. Each latitude-longitude pixel may have several polar radar pixels. Subsampling those polar radar pixels to one latitude-longitude pixel can cause loss of information.
32
Polar radar data, 33 storm days from 27 different WSR-88D radars
Extract level II reflectivity data
Extract level II velocity data
Clean up reflectivity data
Derive the azimuthal shear dan radial convergence using LLSD
Create reflectivity gradient and gradient direction fields
Create dilated reflectivity fields
Create dilated positive shear fields
The MDA ground truth database
Create the tornado possibility field using a fuzzy logic weighted aggregate
Create the tornado truth field
Create the tornado possibility regions using region growing clustering
The generated data set contains 2008 regions/data points and 53 attributes/variables and 1 class attribute (tornadic or non tornadic) from 33 storm days
Compare each tornado possibility region with the tornado truth field (labeling each region into a tornadic or non-tornadic region) Generate tabular data relating the attributes of each region to its tornadic or non-tornadic classification.
Create dilated negative shear fields
Use 15 storm days’ data for the training/validation set (1106 data points)
Use 18 storm days’ data for the independent test set (902 data points)
Train the SVM, find the best classifier using the bootstrap validation
Test the SVM classifier on the independent test set Use the SVM-based tornado prediction algorithm in real-time
Figure 4. A schematic diagram of the spatiotemporal tornado prediction with SVMs.
33
Figure 5. A spatial field that indicates areas where a tornado existed in a 30-minute window centered from KTLX around 00:02 on May 4, 1999 UTC (coordinated universal time), displayed using the WDSS-II system.
34
Figure 6. Reflectivity gradient at low level (left) and reflectivity gradient direction from KTLX at 00:02 on May 4, 1999 UTC. Yellow marks/circles show the areas of tornado. Note that these marks are sketched manually.
35
Figure 7. Morphologically dilated positive (left) and negative (right) azimuthal shear fields at low level from KTLX at 00:02 on May 4, 1999 UTC. Yellow circles (sketched manually) show the areas of tornado.
36
Figure 8. Morphologically dilated reflectivity at low level (left) and dilated reflectivity aloft (right) fields from KTLX at 00:02 on May 4, 1999 UTC. Yellow circles (sketched manually) show the areas of tornado.
37
(b)
(a)
Figure 9. (a) A fuzzy tornado possibility field created by aggregating several spatial fields. (b) A fuzzy tornado possibility field is shown superimposed by the ground truth closely. Both are taken from KTLX at 00:02 on May 4, 1999 UTC.
38
Figure 10. SVM classification of each tornado possibility region from KTLX at 00:02 on May 4, 1999 UTC. The red triangles represent tornadic regions (regions #110, #111, #112) and the green triangles represent non-tornadic regions (the rest regions).
39
Figure 11. Tabular data including the properties and tornado probability value of each tornado possibility region from KTLX at 00:02 on May 4, 1999 UTC.
40
2.80 2.60 2.40 2.20 2.00
Score
1.80 1.60 1.40 1.20 1.00 0.80 0.60 0.40 0.20 0.00 POD- POD- PODSVM NN LDA
-
FAR- FAR- FARSVM NN LDA
-
CSI- CSI- CSISVM NN LDA
-
Bias- Bias- BiasSVM NN LDA
-
HSS- HSS- HSSSVM NN LDA
Figure 12. Comparison of support vector machines, neural networks, and linear discriminant analysis for different skill scores (POD, FAR, CSI, Bias, and HSS) using 95% confidence intervals.
41
Lists of Table and Figures LIST OF TABLES: Table I. Confusion matrix. Table II. List of attributes of each region/data point in the data set. Table III. The cases for the training/validation set. Table IV. The cases for the independent test set. Table V. Results of training stage and test run for SVMs. The mean performance scores after 1000 bootstrap replications and the 95% confidence intervals are reported here. Table VI. Results of SVM, NN, and LDA on the independent test set. The bold scores indicate the best mean scores. The mean performance scores after 1000 bootstrap replications and the 95% confidence intervals are reported here.
LIST OF FIGURES: Figure 1. Illustration of support vector machines. Figure 2. A kernel map converts a nonlinear problem into a linear problem. Figure 3. Black lines depict the polar radar grids; each polar radar pixel (gate) represents a 1 km x 1° area. Red lines depict the latitude-longitude grids; each pixel represents a 1 km x 1 km area. The latitude-longitude grids used in Lakshmanan et al. (2005a) had a resolution of 0.01 degrees x 0.01 degrees which is approximately 1 km x 1 km at mid-latitudes. Each latitude-longitude pixel may have several polar radar pixels. Subsampling those polar radar pixels to one latitude-longitude pixel can cause loss of information. Figure 4. A schematic diagram of the spatiotemporal tornado prediction with SVMs. Figure 5. A spatial field that indicates areas where a tornado existed in a 30-minute window centered from KTLX around 00:02 on May 4, 1999 UTC (coordinated universal time), displayed using the WDSS-II system. Figure 6. Reflectivity gradient at low level (left) and reflectivity gradient direction from KTLX at 00:02 on May 4, 1999 UTC. Yellow marks/circles show the areas of tornados. Note that these marks are sketched manually. Figure 7. Morphologically dilated positive (left) and negative (right) azimuthal shear fields at low level from KTLX at 00:02 on May 4, 1999 UTC. Yellow circles (sketched manually) show the areas of tornados. Figure 8. Morphologically dilated reflectivity at low level (left) and dilated reflectivity aloft (right) fields from KTLX at 00:02 on May 4, 1999 UTC. Yellow circles (sketched manually) show the areas of tornados. Figure 9. (a) A fuzzy tornado possibility field created by aggregating several spatial fields. (b) A fuzzy tornado possibility field is shown superimposed by the ground truth closely. Both are taken form KTLX at 00:02 on May 4, 1999 UTC. Figure 10. SVM classification of each tornado possibility region from KTLX at 00:02 on May 4, 1999 UTC. The red triangles represent tornadic regions (regions #110, #111, #112) and the green triangles represent non-tornadic regions (the rest regions).
42
Figure 11. Tabular date including the properties and tornado probability value of each tornado possibility region from KTLX at 00:02 on May 4, 199 UTC. Figure 12. Comparison of support vector machines, neural networks, and linear discriminant analysis for different skill scores (POD, FAR, CSI, Bias, and HSS) using 95% confidence intervals.
43