Supporting Information Structural and electronic properties of uranium-encapsulated Au14 cage Yang Gao1, Xing Dai1, Seunggu Kang2, Camilo Andres Jimenez Cruz2, Minsi Xin1, Yan Meng1, Jie Han1, Zhigang Wang1,* & Ruhong Zhou1,2,3,*
1
Institute of Atomic and Molecular Physics, Jilin University, Changchun 130012, P. R. China.
Computational Biology Center, IBM Thomas J. Watson Research Center, Yorktown Heights, NY
2
10598. Department of Chemistry, Columbia University, New York, NY 10027
3
*To whom correspondence should be addressed. E-mail:
[email protected];
[email protected].
Part 1. Two designed isomers of UAu14 clusters. Part 2. Total bonding energy results by different functionals. Part 3. Energy calculation for U@Au14 structure using spin-orbital ZORA approach. Part 4. Structures of Au2 , U2, and Zr@Au14. Part 5. The ionization potential (IP) and electron affinity (EA) of U@Au14 cluster. Part 6. Mulliken populations of U@Au14. Part 7. The charge transfer of different systems. Part 8. List of portion MOs, ordered by energy, with the most significant SFO gross populations. Part 9. Occupied MOs contributed by the 5f and 6d electrons of the U atom (α orbitals only).
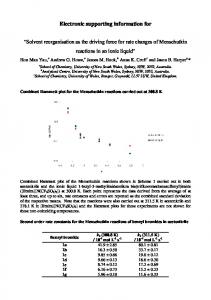
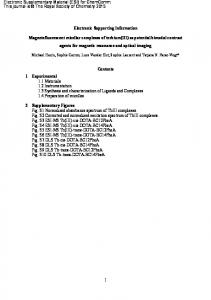
Part 1. Two designed isomers of UAu14 clusters. In addition to the U-embedded gold-cage structure U@Au14 in the main text, two designed isomers of UAu14 clusters have been considered. The first isomer, a gold-cage with a U atom adsorbed on its surface and an Au atom located inside, is marked as “iso-1”. The second isomer, an Au14-flake with a U atom adsorbed on its surface, is marked as “iso-2”. Similar to the structures in a previous report [29], in these two structures, the U atom prefers to move into the gold-cage, which can be clearly seen from the following Figure S1. As shown in the Table S1, the spin multiplicity of ground states of all these three structures is triplet, and the U-embedded gold-cage structure U@Au14 is the most stable.
Figure S1.The relaxation process of two types of UAu14 structures. Table S1. Total bonding energies results (Scalar Relativistic) of UAu14 isomers. Multiplicity 1 3 5 7
EIso-1 (eV) -40.76 -41.11 -40.44 -39.23
EIso-2 (eV) -43.08 -43.51 -42.67 -41.24
EU@Au14 (eV) -44.63 -44.74 -43.34 -42.15
Multiplicity 1 3 5 7 1 3 5 7
Total bonding energy (eV) -44.63 -44.74 -43.34 -42.15 -43.67 -43.72 -42.46 -41.31
Part 2. Total bonding energy results by different functionals. Table S2. Total bonding energy results by different functionals. System
Method PBE
BP86 U@Au14
1 3 5 7 1 3 5 7
PW91
B3LYP
-45.13 -45.22 -43.85 -42.67 -44.64 -45.80 -43.98 -42.77
Part 3. Energy calculation for U@Au14 structure using spin-orbital ZORA approach. Table S3. Relative energy calculation for U@Au14 using spin-orbital ZORA approach. System
Method
U@Au14
PBE
Multiplicity 3 5 7
△E (eV) 0 0.45 0.52
On the basis of scalar-relativistic ZORA approach optimization system, energy calculation is performed for the corresponding structures using the spin-orbital coupling ZORA approach. Part 4. Structures of Au2, U2, and Zr@Au14. Au2 and U2. To check the validity of our computational method (PBE/TZ2P, scalar-relativistic ZORA), we performed the calculation on structure Au2 and U2 dimers. For the Au2 dimer (Au, treating the 4f145s25p65d106s1 as valence electrons), the computed values of bond length, electron affinity and vibration frequency are 2.52 Å, 1.85 eV, 175.11 cm-1, respectively. These results are in reasonable agreement with experimental data (bond length, 2.47 Å [37]; electron affinity 1.94 eV [38]; vibration frequency, 190.09 cm-1 [41]), and previous theoretical results with higher-level Quantum Mechanics methods (bond length, 2.55 Å [40], 2.60 Å [39]; electron affinity 2.05 eV [39]; vibration frequency, 173.00 cm-1 [40]). For the U2 dimer (U, treating the 5s25p65d105f36s26p66d17s2 as valence electrons), the computed values of vibration frequency and bond length are 257.27 cm-1 and 2.28 Å, respectively. Compared with the CASSCF/CASPT2 data (265.00 cm-1 and 2.43 Å) from a previous report [45], our current vibration frequency is in satisfactory agreement with it. Although the bond length of U2 is underestimated in our DFT method, it is consistent with a previous DFT calculation (bond length, 2.27 Å [13]; 2.3-2.4 Å, [14]). Thus, the comparison between our calculations and available past data of Au2 and U2 dimer indicates the reliability of our current approach. Zr@Au14.
A previous theoretical report indicated Zr@Au14 is a highly stable gold-cage metal cluster [4]. Therefore, we calculated the data of bond lengths, HOMO-LUMO gap and total bonding energy for Zr@Au14, at the same level (PBE/TZ2P, scalar-relativistic ZORA) with U@Au14. As shown in the Table S4, these results are in good agreement with the previous theoretical data. These comparisons confirmed that our current approach is reliable. Furthermore, we also compared the total bonding energy between Zr@Au14 and U@Au14, their energy values are very close, suggesting that the U@Au14 is a highly stable gold-cage metal cluster. Table S4. Calculated properties of Zr@Au14. Zr@Au14[a]
Zr@Au14[b]
U@Au14
HOMO-LUMO gap (eV)
2.23
2.22
---
Au-Au bond length (Å) shortest longest
2.71 2.84
2.74 2.85
-----
Zr-Au bond length (Å) shortest longest
2.80 2.92
2.80 3.14
-----
---
-44.15
-44.74
Property
total bonding energy (eV) [a] Ref
[4].
[b]
Our calculations.
Part 5. the ionization potential (IP) and electron affinity (EA) of U@Au14 cluster. EVIP, EAIP, EVEA and EAEA are defined as following: EVIP = E+(sp) – E0(opt)
EAIP = E+(opt) – E0(opt)
EVEA = E0(opt) – E-(sp)
EAEA = E0(opt) – E-(opt)
where E0(opt) is total bonding energy of the neutral U@Au14 cluster, while E+(opt) and E-(opt) represent total bonding energy of the cation and anion in optimized neutral geometry, respectively; E+(sp) and E-(sp) represent total bonding energy of the cation and anion in single point neutral geometry, respectively. Table S5. Calculated ionization potentials (eV) and electron affinities (eV) of U@Au14 cluster. Method PBE experimental value [Ref 5]
Structure U@Au14 W@Au12
EVIP 6.79 ---
EAIP 6.78 ---
EVEA EAEA 2.68 2.73 2.08±0.02
Part 6. Mulliken populations of U@Au14. Table S6. Mulliken populations of U@Au14. Number/Atom 1 Au
Charge (e) 0.12
Spin density 0.01
Spin direction α β
s
p
d
f
1.45 1.45
3.19 3.18
4.79 4.79
7.01 7.01
2 Au
0.12
-0.00
3 Au
0.13
-0.01
4 Au
0.12
-0.00
5 Au
0.13
-0.00
6 Au
0.13
0.01
7 Au
0.12
-0.01
8 Au
0.11
-0.01
9U
-1.68
2.03
10 Au
0.14
-0.01
11 Au
0.12
-0.00
12 Au
0.14
-0.01
13 Au
0.08
-0.01
14 Au
0.12
0.01
15 Au
0.10
-0.00
α β α β α β α β α β α β α β α β α β α β α β α β α β α β
1.46 1.46 1.45 1.46 1.46 1.46 1.45 1.45 1.45 1.45 1.46 1.46 1.45 1.45 2.27 2.26 1.46 1.46 1.45 1.45 1.46 1.46 1.46 1.47 1.45 1.45 1.46 1.46
3.18 3.17 3.18 3.18 3.18 3.17 3.19 3.19 3.18 3.18 3.18 3.18 3.20 3.20 6.24 6.23 3.17 3.17 3.18 3.18 3.17 3.17 3.18 3.18 3.18 3.17 3.18 3.18
4.79 4.79 4.78 4.79 4.79 4.79 4.79 4.79 4.79 4.79 4.78 4.79 4.78 4.79 6.90 6.81 4.78 4.79 4.80 4.80 4.78 4.79 4.79 4.80 4.81 4.80 4.80 4.80
Part 7. The charge transfer of different systems. Table S7. The charge transfer of different systems. U@Au4 Number/Atom 1 Au 2 Au 3 Au 4 Au 5 U
Charge (e) -0.22 -0.21 -0.22 -0.22 0.87 U@Au6
Number/Atom 1 Au 2 Au 3 Au 4 Au 5 Au 6 Au 7 U
Charge (e) -0.05 -0.17 -0.19 -0.04 -0.17 -0.04 0.66 U@Au8
Number/Atom 1 Au 2 Au 3 Au
Charge (e) 0.01 0.01 0.01
7.01 7.01 7.01 7.01 7.01 7.01 7.01 7.01 7.01 7.01 7.01 7.01 7.01 7.01 2.45 0.52 7.01 7.01 7.01 7.01 7.01 7.01 7.01 7.01 7.01 7.01 7.01 7.01
4 Au 5 Au 6 Au 7 Au 8 Au 9 U
0.01 0.01 0.01 0.01 0.01 -0.08 U@Au12
Number/Atom 1 Au 2 Au 3 Au 4 Au 5 Au 6 Au 7 Au 8 Au 9 Au 10 Au 11 Au 12 Au 13 U
Charge (e) 0.10 0.11 0.11 0.10 0.10 0.11 0.10 0.10 0.10 0.10 0.10 0.10 -1.23 U@Au16
1 Au 2 Au 3 Au 4 Au 5 Au 6 Au 7 Au 8 Au 9 Au 10 Au 11 Au 12 Au 13 Au 14 Au 15 Au 16 Au 17 U
0.17 0.17 0.09 0.17 0.09 0.09 0.09 0.09 0.09 0.09 0.09 0.15 0.09 0.09 0.09 0.09 -1.74
All structures are relaxed to the status of lowest energy in PBE/TZ2P level. All obtained structures were then analyzed with vibration frequency calculations at the same level to avoid imaginary frequencies and ensure the reliability of the results. For the M@Aun structure, Ref S1 pointed out that it was more stable when the number of gold atoms n is even. Therefore, n was given the values of 4, 6, 8, 12 and 16 for comparison. Calculation shows that with the increment of n, the direction of charge transfer changes, and this pattern is consistent with those found in previous studies [44,S2].
Part 8. List of portion MOs, ordered by energy, with the most significant SFO gross populations.
Table S8. List of portion MOs, ordered by energy, with the most significant SFO gross populations. E (eV) -5.63
MO HOMOα-1
-5.67
HOMOα-2
-5.70
HOMOα-3
-5.73
HOMOα-4
-5.83
HOMOα-5
-7.36
HOMOα-30
-7.60
HOMOα-34
-7.63
HOMOα-35
-7.68
HOMOα-37
-7.89
HOMOα-38
-7.98
HOMOα-39
-8.09
HOMOα-41
-8.19
HOMOα-45
-9.06
HOMOα-58
-9.40
HOMOα-66
-9.50
HOMOα-67
-9.52
HOMOα-68
-9.53
HOMOα-69
-9.97
HOMOα-74
-10.05
HOMOα-75
Percentages (%) 9.87% 32.76% 17.17% 10.64% 30.15% 16.70% 9.36% 32.42% 12.52% 10.52% 32.86% 10.41% 9.24% 28.71% 18.96% 1.18% 85.48% 1.23% 81.76% 3.00% 79.36% 1.69% 81.30% 7.62% 77.95% 3.33% 81.18% 1.36% 79.79% 1.49% 80.45% 1.08% 81.76% 1.44% 6.86% 69.18% 1.18% 1.24% 7.35% 68.24% 1.49% 1.21% 6.17% 74.37% 1.05% 1.19% 77.12% 15.91% 7.21% 56.87% 17.14%
SFO 6d 6s 5d 6d 6s 5d 6d 6s 5d 6d 6s 5d 6d 6s 5d 5f 5d 5f 5d 5f 5d 5f 5d 5f 5d 5f 5d 5f 5d 5f 5d 5f 5d 5f 6s 5d 6d 5f 6s 5d 6d 5f 6s 5d 5f 6s 5d 6d 6s 5d 6d
Fragment U Au14 Au14 U Au14 Au14 U Au14 Au14 U Au14 Au14 U Au14 Au14 U Au14 U Au14 U Au14 U Au14 U Au14 U Au14 U Au14 U Au14 U Au14 U Au14 Au14 U U Au14 Au14 U U Au14 Au14 U Au14 Au14 U Au14 Au14 U
-10.13
HOMOα-76
-10.14
HOMOα-77
-10.16
HOMOα-78
-5.61
HOMOβ-1
-5.65
HOMOβ-2
-5.68
HOMOβ-3
-5.71
HOMOβ-4
-5.82
HOMOβ-5
-7.60
HOMOβ-34
-7.62
HOMOβ-35
-7.66
HOMOβ-37
-7.85
HOMOβ-38
-7.96
HOMOβ-39
-9.36
HOMOβ-64
-9.47
HOMOβ-67
-9.52
HOMOβ-69
-9.34
HOMOβ-74
-10.00
HOMOβ-75
-10.07
HOMOβ-76
9.54% 53.01% 15.66% 10.89% 58.06% 14.39% 11.04% 52.04% 15.80% 12.32% 47.32%
6s 5d 6d 6s 5d 6d 6s 5d 6d 6s 5d
Au14 Au14 U Au14 Au14 U Au14 Au14 U Au14 Au14
9.17% 33.13% 16.69% 9.26% 30.70% 15.64% 8.91% 32.39% 14.27% 9.85% 32.87% 11.45% 8.73% 29.52% 18.56% 1.10% 82.71% 1.19% 81.22% 1.31% 80.77% 5.26% 81.46% 2.69% 80.96% 1.04% 2.33% 73.55% 1.45% 7.19% 73.71% 1.11% 1.60% 77.20% 14.67% 8.59% 56.48% 14.84% 8.30% 56.18% 13.47% 12.01%
6d 6s 5d 6d 6s 5d 6d 6s 5d 6d 6s 5d 6d 6s 5d 5f 5d 5f 5d 5f 5d 5f 5d 5f 5d 5f 6s 5d 6d 6s 5d 6d 6s 5d 6d 6s 5d 6d 6s 5d 6d 6s
U Au14 Au14 U Au14 Au14 U Au14 Au14 U Au14 Au14 U Au14 Au14 U Au14 U Au14 U Au14 U Au14 U Au14 U Au14 Au14 U Au14 Au14 U Au14 Au14 U Au14 Au14 U Au14 Au14 U Au14
-10.11
HOMOβ-77
-10.13
HOMOβ-78
59.11% 13.88% 10.12% 51.13% 14.42% 11.11% 49.99%
5d 6d 6s 5d 6d 6s 5d
Au14 U Au14 Au14 U Au14 Au14
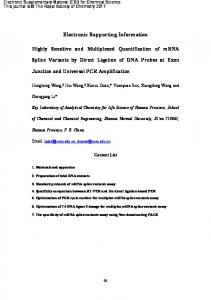
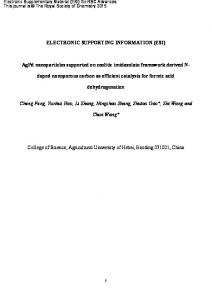
Part 9. Occupied MOs contributed by the 5f and 6d electrons of the U atom (α orbitals only) Table S9. Occupied MOs contributed by the 5f and 6d electrons of the U atom (α orbitals only).
HOMOα-1
HOMOα-2
HOMOα-4
HOMOα-5
HOMOα-30
HOMOα-34
HOMOα-35
HOMOα-37
HOMOα-39
HOMOα-41
HOMOα-45
HOMOα-58
HOMOα-66
HOMOα-67
HOMOα-68
HOMOα-69
HOMOα-74
HOMOα-75
HOMOα-76
HOMOα-77
HOMOα-78
Reference: S1. Zhang, M., Zhang, H., Zhao, L., Li, Y. & Luo, Y. Low-Energy Isomer Identification, Structural Evolution, and Magnetic Properties in Manganese-Doped Gold Clusters MnAun (n= 1–16). J. Phys. Chem. C. 116, 1493-1502 (2012). S2. Hossain, D., Pittman, J. C. U. & Gwaltney, S. R. Structures and Stabilities of the Metal Doped Gold NanoClusters: M@ Au10 (M= W, Mo, Ru, Co). J. Inorg. Organomet. Polym. 2013, DOI:10.1007/s10904-013-99956.