The Journal of Neuroscience, March 7, 2012 • 32(10):3287–3295 • 3287
Behavioral/Systems/Cognitive
Supramodal Parametric Working Memory Processing in Humans Bernhard Spitzer1 and Felix Blankenburg1,2 1Department of Neurology and Bernstein Center for Computational Neuroscience, Charite ´ Universita¨tsmedizin Berlin, 10115 Berlin, Germany, and 2Dahlem Institute for Neuroimaging of Emotion, Freie Universita¨t Berlin, 14195 Berlin, Germany
Previous studies of delayed-match-to-sample (DMTS) frequency discrimination in animals and humans have succeeded in delineating the neural signature of frequency processing in somatosensory working memory (WM). During retention of vibrotactile frequencies, stimulus-dependent single-cell and population activity in prefrontal cortex was found to reflect the task-relevant memory content, whereas increases in occipital alpha activity signaled the disengagement of areas not relevant for the tactile task. Here, we recorded EEG fromhumanparticipantstodeterminetheextenttowhichthesemechanismscanbegeneralizedtofrequencyretentioninthevisualandauditory domains. Subjects performed analogous variants of a DMTS frequency discrimination task, with the frequency information presented either visually, auditorily, or by vibrotactile stimulation. Examining oscillatory EEG activity during frequency retention, we found characteristic topographical distributions of alpha power over visual, auditory, and somatosensory cortices, indicating systematic patterns of inhibition and engagement of early sensory areas, depending on stimulus modality. The task-relevant frequency information, in contrast, was found to be represented in right prefrontal cortex, independent of presentation mode. In each of the three modality conditions, parametric modulations of prefrontal upper beta activity (20 –30 Hz) emerged, in a very similar manner as recently found in vibrotactile tasks. Together, the findings corroborate a view of parametric WM as supramodal internal scaling of abstract quantity information and suggest strong relevance of previous evidence from vibrotactile work for a more general framework of quantity processing in human working memory.
Introduction Research in the somatosensory domain has shown that during working memory (WM) maintenance of previously presented tactile vibrations, neural activity in prefrontal cortex (PFC) is systematically modulated by the to-be-maintained vibrotactile frequency (Romo and Salinas, 2003; Spitzer et al., 2010). In PFC of behaving monkeys, such “parametric” coding of vibrotactile information in WM was characterized by monotonic increases and decreases of single-cell firing rates (Romo et al., 1999), as well as by systematic modulations of small neuronal populations’ states (Barak et al., 2010). Only recently, evidence for parametric WM coding was found in human subjects as well. Noninvasive EEG recordings during vibrotactile frequency maintenance showed parametric modulations of prefrontal upper beta oscillations (⬃20 –25 Hz) by the frequency of the to-be-maintained vibration (Spitzer et al., 2010; Spitzer and Blankenburg, 2011). Despite these recent advances in uncovering the neural signature of frequency processing in PFC, the precise functional nature Received Oct. 19, 2011; revised Dec. 7, 2011; accepted Jan. 4, 2012. Author contributions: B.S. and F.B. designed research; B.S. performed research; B.S. and F.B. analyzed data; B.S. and F.B. wrote the paper. This research was supported by a grant from the German Federal Ministry of Education and Research (Bundesministerium fu¨r Bildung und Forschung) to F.B. We thank T. Schmidt and A. Schlegel for help with data acquisition, R. Aucksztulewicz and D. Ostwald for comments on the manuscript, and K. Friston and V. Litvak for technical advice. Correspondence should be addressed to Bernhard Spitzer, Department of Neurology and Bernstein Center for Computational Neuroscience, Charite´ University Hospital Berlin, Philippstrasse 13, House 6, 10115 Berlin, Germany. E-mail:
[email protected]. DOI:10.1523/JNEUROSCI.5280-11.2012 Copyright © 2012 the authors 0270-6474/12/323287-09$15.00/0
of parametric WM activity remains unknown. In particular, until now empirical evidence for this type of processing has been obtained only for vibrotactile information, which is known to be parametrically encoded already at early stages of the primate somatosensory processing pathways (for review, see Romo and Salinas, 2003). The critical question arises whether parametric WM representations in PFC, as reflected by modulations of oscillatory beta activity, may also be established for information provided via other sensory modalities. In addition to the crucial involvement of PFC, previous MEG/ EEG investigations of tactile WM in humans have consistently reported sustained increases of oscillatory alpha activity (8 –13 Hz) over posterior areas throughout the retention period (Haegens et al., 2010; Spitzer et al., 2010; Spitzer and Blankenburg, 2011). These effects have been interpreted in terms of modalityspecific disengagement of visual areas considered irrelevant for the task, in accordance with the established view that alpha oscillations signal top-down controlled cortical inhibition (for review, see Klimesch et al., 2007). Consistent with this view, in addition to alpha increases over visual areas, we recently observed alpha decreases in primary somatosensory cortex during retrospective focusing on vibrotactile memory contents (Spitzer and Blankenburg, 2011). It remains to be shown, whether such patterns of engagement of relevant sensory areas and disengagement of irrelevant areas, in terms of modality-specific decreases and increases of cortical alpha, may emerge during frequency maintenance in other sensory modalities as well. Here, we recorded EEG from human subjects performing three different variants of a delayed-match-to-sample
3288 • J. Neurosci., March 7, 2012 • 32(10):3287–3295
Spitzer and Blankenburg • Supramodal Parametric Working Memory in Humans
(DMTS) frequency discrimination task, with the to-be-maintained information presented in either the tactile, auditory, or visual modality. We expected to replicate previous findings of stimulus-dependent prefrontal beta modulations during tactile WM processing, accompanied by taskinduced changes of alpha activity over sensory cortices. The critical question was to what extent these correlates of frequency processing in human WM are specific to the tactile domain, or can be generalized to analogous auditory and/or visual WM tasks.
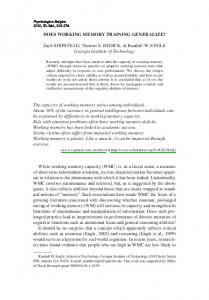
Materials and Methods Subjects. Twenty-eight healthy volunteers (21–35 years; 13 females, 15 males) participated in the experiment with written informed consent. Four Figure 1. Experimental setup, task, and behavioral results. A, On separate blocks, periodic stimuli were presented either participants were excluded from analysis due to auditorily (acoustic “flutter”), visually (“flicker” lights), or by vibrotactile stimulation of the fingertips (tactile flutter). All stimuli excessive ocular and/or movement artifacts. The were presented bilaterally. B, Delayed-match-to-sample frequency discrimination task. For each modality, the to-be-maintained study was approved by the Ethical Committee of stimulus frequency (f1) was varied between 14 and 34 Hz, for later discrimination against a comparison stimulus (f2) of the same the Charite´ University Hospital Berlin and corre- modality. C, Average behavioral discrimination performance (left) and response times (right) for the different task conditions. sponded to the Human Subjects Guidelines of Clipart courtesy of Microsoft. the Declaration of Helsinki. frequency selection represented a compromise between the typical Stimuli and behavioral task. On tactile trials, bimanual vibrotactile ranges of tactile/acoustic flutter (⬃10 – 45 Hz; Romo and Salinas, 2003; stimulation of the index fingers was delivered by two identical 16-dot Bendor and Wang, 2007) and possible “fusion” of visual flicker at high piezoelectric Braille display (4 ⫻ 4 quadratic matrix, 2.5 mm spacing) frequencies (Smith and Misiak, 1976; see Discussion). After comparison controlled by a programmable stimulator (Piezostimulator, Quaerostimulus offset, responses were given with the right foot by pressing a reSys). The pins of both Braille displays were simultaneously driven by sponse pedal either once or twice to indicate whether the base or the coma constant 145 Hz sinusoidal carrier signal which was amplitudeparison stimulus was “faster.” After 2000 ms response time, performance modulated by a fixed-amplitude sinus function at the respective stimfeedback was given. Participants were instructed to look at the fixation cross ulus frequency. The sound of the tactile stimulation was masked by and touch the Braille displays throughout the entire experiment. After a few white noise (⬃80 dB) played via loudspeakers throughout the entire practice trials, each subject performed 5 sessions of 6 blocks (2 of each moexperiment. None of the participants reported hearing any sound dality, in a counterbalanced serial order) of 20 frequency discrimination attributable to the tactile stimulation. trials, for a total of 200 trials in each modality. On auditory trials, binaural flutter stimulation was delivered via isoEEG recording and analysis. EEG was recorded using a 64-channel lating supra-aural closed-back stereo headphones (AKG K518-DJ). active electrode system (ActiveTwo, BioSemi), with electrodes placed in Auditory stimuli consisted of a 1 kHz carrier sine tone which was an elastic cap according to the extended 10 –20 system. Individual elecamplitude-modulated by a fixed amplitude sine function of the respectrode locations were registered using an electrode positioning system tive stimulus frequency. The sounds were generated at 48 kHz sampling (Zebris Medical GmbH). Vertical and horizontal eye movements were rate and were output via the left channel of the stimulation PC’s onboard recorded from 4 additional channels. Signals were digitized at a sampling soundcard linked to both channels of a stereo headphone amplifier rate of 2048 Hz, off-line bandpass filtered (1–100 Hz), downsampled to (DELL AX 510). 512 Hz, and average referenced. All analyses were performed using SPM8 On visual trials, bilateral flicker stimulation was delivered by two sets for MEG/EEG (Wellcome Department of Cognitive Neurology, London, of white light-emitting diodes (LEDs) mounted to the left and the right of UK; www.fil.ion.ucl.ac.uk/spm/) and custom MATLAB code (The a 19 inch TFT screen. The driving signal for flicker stimulation consisted MathWorks). The EEG was corrected for eye blinks using calibration of an 8 kHz carrier signal (sampled at 48 kHz for an optimized six-point data to generate individual artifact coefficients and adaptive spatial filelementary waveform; for details, see Allefeld et al., 2011) which was tering (for details, see Ille et al., 2002). Remaining artifacts were rejected amplitude modulated by a fixed amplitude rectangular function at the by excluding all epochs containing amplitudes ⬎65 V from analysis. respective stimulus frequency. The LEDs were driven by the right chanSpectral analysis. The EEG data from all correct trials were epoched nel of the stimulation PC’s onboard soundcard, using a hi-fi amplifier (⫺1500 to 5000 ms relative to f1 onset). Time frequency (TF) represen(Dynavox CS-PA1) and a custom-built circuit of resistors (6 ⍀) and tations of spectral power between 5 and 40 Hz were obtained by applying diodes (adopted from Allefeld et al., 2011) to match the LEDs’ impedance a tapered sliding window FFT using a single Hanning taper and an adapand polarity. tive time window of 7 cycles length. Stimulus-evoked (phase-locked) A schematic of the experimental setup is illustrated in Figure 1 A. responses were removed from the data by subtracting for each condition Before each block of 20 trials, a brief visual instruction (“seeing,” “hearthe average waveform from the waveform of each individual trial before ing,” or “touching”) indicated the modality in which the forthcoming applying the TF transform to the single trial data. Exploratory analysis of frequencies would be presented. The experimental procedure (Fig. 1 B) higher frequency bands (⬎40 Hz), using a multi-tapered FFT, yielded no was identical for all stimulus modalities. Each trial began with the presignificant effects. sentation of a small fixation cross centered on the TFT screen (enlarged Statistical analysis. The statistical analysis was implemented in SPM8, for illustrative purpose in Fig. 1 A). After a variable prestimulus interval using the general linear model (GLM). To warrant conformity with the GLM (1500 –2000 ms), two 500 ms periodic stimuli of the same modality were under normal error assumptions, the spectral power data were converted sequentially presented, separated by a 3000 ms retention interval (Fig. 1). into amplitude values using a square root transform (Kiebel et al., 2005) and The base stimulus frequency (f1) was varied between 14 and 34 Hz in convolved with a 3 Hz ⫻ 300 ms (FWHM) Gaussian kernel. The GLM was steps of 4 Hz; the comparison stimulus frequency (f2; 10 –38 Hz) was specified as a 3 (modalities) ⫻ 6 (frequencies) within-subjects design and randomly chosen to be either 4 Hz higher or 4 Hz lower than f1. The
Spitzer and Blankenburg • Supramodal Parametric Working Memory in Humans
J. Neurosci., March 7, 2012 • 32(10):3287–3295 • 3289
Table 1. Behavioral data Accuracy (%) Tactile Auditory Visual RT (ms) Tactile Auditory Visual
14 Hz
18 Hz
22 Hz
26 Hz
30 Hz
34 Hz
76.7 82.5 81.6
78.4 81.3 82.2
77.7 80.0 77.8
77.5 76.2 68.8
71.3 72.1 65.0
68.5 72.3 61.4
547 474 514
550 488 527
539 506 542
530 524 542
555 524 549
518 516 579
Linear slope ⫺0.45* ⫺0.59* ⫺1.16* ⫺0.99 2.40 2.79*
Top, Mean f1–f2 frequency discrimination accuracy (% correct) for each f1 frequency, and linear regression slopes for the different modality conditions. Asterisks indicate significance of a linear trend across f1 frequencies (p ⬍ 0.05, Bonferroni corrected). Bottom, Same as top, for RT (milliseconds).
was inverted using restricted maximum-likelihood estimation. Contrasts of interest were then computed from the model’s parameter estimates using standard SPM procedures, yielding t-statistics of the contrast’s significance at each TF bin (statistical parametric maps). Contrasts of interest included difference contrasts between modality conditions (cf. Fig. 3A, below), and parametric contrasts reflecting the strength of a linear relationship to f1 frequency (cf. Fig. 4 A, below). TF bins potentially affected by frequency-dependent stimulation artifacts were excluded from parametric contrast analysis (transparent mask; see Fig. 4 A, left). FWEs in time-frequency space were controlled using Random Field Theory (Worsley et al., 1996; Kilner et al., 2005) to determine the FWEcorrected probability that at a given channel, significant TF bins may have been obtained by chance. If significant TF effects were identified in the parametric contrast analysis, GLM-based inference was complemented by inspection of changes in the average raw spectral amplitudes in the respective TF window, across the different f1 frequencies (cf. Fig. 4 A right, B). Unless noted otherwise, only correct discrimination trials were included in the reported analyses. Where applicable, error trials were analyzed separately. Source reconstruction. The sources of EEG activity were modeled using source reconstruction as implemented in SPM8 (Friston et al., 2006). For each participant a forward model was constructed, using a 8196 vertex template cortical mesh coregistered to the individual electrode positions via 3 fiducial markers. The forward model’s lead field was computed using the 3-shell BEM EEG head model available in SPM8. Before model inversion, the raw data were bandpass filtered around the frequency band of interest. Source estimates were then computed on the canonical mesh using multiple sparse priors (Friston et al., 2008) under group constraints (Litvak and Friston, 2008), including the data from all conditions of interest. Trial-specific TF contrasts were used to summarize oscillatory source power for specific frequency bands and at specific times, as 3D images, which were then analyzed using conventional statistical parametric mapping procedures.
Results Behavioral results On average, participants correctly discriminated 75.0% of the stimulus pairs in the tactile task, 77.4% in the auditory task, and 72.7% in the visual task (Fig. 1C, left). Pairwise comparisons showed a significant performance difference between the auditory and the visual tasks only (p ⬍ 0.05, Bonferroni-corrected). As expected by Weber’s law (Fechner, 1966) discrimination performance in general decreased with increasing f1 frequency (Table 1, top). The slope of the decrease was significantly steeper in the visual compared with the remaining conditions (p ⬍ 0.05, Bonferroni-corrected). Mean response times (RTs) did not differ significantly between the tactile, auditory, and visual conditions (Fig. 1C, right; 539, 505, and 542 ms; all p values ⬎0.05), and a linear trend for a slowing of RTs with increasing f1 was significantly evident in the visual modality condition only (Table 1, bottom). Thus, f1–f2 discrimination performance was particu-
larly poor for fast flicker stimuli in the visual task, in terms of both reduced accuracy and increased RTs. Task-related changes in oscillatory activity First, we examined task-induced changes of spectral activity relative to a prestimulus baseline (800 –500 ms before f1 onset), for each of the three modality conditions (Fig. 2). Throughout the WM period, a sustained increase in alpha activity (8 –12 Hz) over posterior channels was evident in the tactile and auditory tasks (Fig. 2 A), but also in the visual task (Fig. 2 A, bottom). Statistical comparisons (Fig. 2 B) showed that the posterior alpha increase was significantly weaker in the visual compared with the tactile task (300 –2300 and 2900 –3750 ms, all time bins p ⬍ 0.05), whereas no significant difference arose between the tactile and the auditory retention periods (⬍3500 ms, all time bins p ⬎ 0.05). In all three modality conditions, however, posterior alpha showed a steady increase throughout the retention interval and peaked at similar levels shortly before f2 onset (2350 –2900 ms, all time bins p ⬎ 0.05). A separate analysis of error trials yielded no significant deviations from the above pattern of results. We reconstructed the cortical sources of the overall alpha increase during late retention (2000 –3000 ms, relative to ⫺1000 to 0 ms baseline), using “conjunction” statistical analysis as implemented in SPM8 to determine source activity common to all three modality conditions (Fig. 2C, top). This revealed widespread effects in occipital cortex, with maximum activity in early visual areas (Area 17; p ⬍ 0.05, FWE). Next, we computed the contrast in source activity between the visual and the remaining two modalities for an earlier time window (1000 –2000 ms), during which the strongest difference was observed on the channel level (cf. Fig. 2 B). The vision-specific reduction in alpha during early retention was localized to similar visual areas (Fig. 2C, bottom, maxima in Area 17; p ⬍ 0.05, FWE) as the modality-unspecific overall alpha increase during later retention (cf. Fig. 2C, top). In addition to the above effects in the alpha band, no sustained activity changes relative to prestimulus baseline or between modality conditions were found in the theta, beta, or gamma bands. Modality-specific topographical distribution of alpha activity In the above analysis, strong alpha increases relative to prestimulus baseline were evident over visual areas, but no effects over other sensory cortices (somatosensory, auditory) were detected. However, modality-specific effects on sensory alpha activity may have arisen already in expectation of stimulation and preparation for the task (Jones et al., 2010; Mu¨ller and Weisz, 2011; Rohenkohl and Nobre, 2011), and thus might not have been easily detected relative to prestimulus baseline. Therefore next, rather than quantifying alpha activity relative to prestimulus baseline, we examined for each modality topographical statistical maps of the difference in alpha power relative to the two remaining modality conditions (Fig. 3A). Notably, a clear pattern of modalityspecific alpha topographies emerged, with relatively decreased contrast activity over bilateral central areas in the “tactile” contrast (Fig. 3A, top row), temporal areas in the “auditory” contrast (middle row), and posterior areas in the “visual” contrast (bottom row). The modality-specific topographies were most prominent during stimulus presentation, but were also clearly evident during the retention period. As expected, an indication of the pattern appeared already in the prestimulus interval (Fig. 3A, leftmost column). 3D source reconstruction (Fig. 3B) attributed the modality-specific decreases of alpha power in the tactile and visual contrasts to bilateral somatosensory (Area 3b) and visual (Area 17) cortices respectively (p ⬍ 0.05, FWE). Localization of
3290 • J. Neurosci., March 7, 2012 • 32(10):3287–3295
Spitzer and Blankenburg • Supramodal Parametric Working Memory in Humans
the auditory contrast decrease was less reliable (p ⫽ 0.002, uncorrected) but, within the limited spatial accuracy of EEG, consistent with a source in auditory sensory areas (cf. Fig. 3B). Critically, from the between-modality comparisons shown in Figure 3, A and B, it cannot be differentiated to what extent decreased contrast activity in a given topographical area may reflect decreased power in the target modality, and/or increased power in any of the two other modalities. To shed light on this, we correlated the average contrast decreases over sensory areas during WM maintenance (1–3 s) with the individual accuracy levels in the different tasks (% correct, normalized to subject mean), across subjects. For instance, if the decrease in the tactile contrast (T-AV) at channel C4 reflected a behaviorally relevant engagement of somatosensory areas during tactile trials, then any potential correlation with tactile task performance may be expected to be positive. On the other hand, if the T-AV decrease at C4 was due to a disengagement of somatosensory areas during the auditory and/or visual tasks, then the sign of any correlation with performance in any of these tasks should be negative. The results (Fig. 3C) largely conform to both aspects of the above predictions: By tendency, the contrast decrease over sensorimotor areas in the target T-AV (Fig. 3C, left) correlated positively with tactile task performance (r ⫽ 0.35, p ⫽ 0.09) but correlated negatively with performance in the auditory condition (r ⫽ ⫺0.39, p ⫽ 0.06). For the auditory target contrast (A-TV), where the alpha decreases over temporal channels were relatively weak (Fig. 3A, middle row), none of the correlations reached statistical significance (all p values ⬎ 0.30). However in the visual target contrast (Fig. 3C, right) again, the contrast Figure 2. Temporal evolution of spectral activity, expressed as percentage change relative to prestimulus baseline. A, Alpha activity (8 –12 Hz) over parieto-occipital channels increases throughout the WM task in each of the modality conditions. B, decrease over visual areas correlated posiComparison of parieto-occipital alpha power changes between conditions. Colored ribbons indicate significance of pairwise comtively with performance in the visual task parisons. The alpha increase in the visual condition is significantly reduced during early retention (red shading). C, 3D source (r ⫽ 0.45, p ⬍ 0.05) and correlated nega- reconstructions. Top, Conjunction analysis of alpha source activity increases common to all three modality conditions, during late tively with performance in the (non- retention (blue shading in B). Bottom, Difference in source power between the visual and the remaining conditions, during early target) tactile task (r ⫽ ⫺0.42 p ⬍ 0.05). retention (red shading in B). Together, this pattern of correlations suggests that behaviorally optimal WM beta modulations were found in previous tactile work (Spitzer et al., processing of modality-specific information involved both 2010; Spitzer and Blankenburg, 2011). In line with our recent finddisengagement of task-irrelevant areas and engagement of ings, the present analysis revealed a significant parametric modulatask-relevant sensory cortices, as mediated by cortical alpha tion in the upper beta band during late retention (TF maximum at oscillations. 26 Hz, 2800 ms, pFWE ⫽ 0.025; cluster of TF bins p ⬍ 0.05 ranging from 21 to 30 Hz, and 2550 –3000 ms). This TF range was defined as Frequency-dependent parametric modulations of prefrontal window of interest for subsequent analyses of modality-specific upper beta activity modulations. The critical question was whether the above modulaTo examine parametric modulations of oscillatory activity as a function was driven by modulations during vibrotactile trials only, or tion of the frequency information maintained in WM, we analyzed whether such phenomenon was present in the auditory and/or visual parametric contrasts reflecting the strength of a linear relation betasks as well. tween TF activity and the frequency of f1. Figure 4A illustrates the To account for potential differences between the modalityjoint parametric contrast, collapsed across modality conditions, for specific effects in TF space, we first determined the parametric representative right-prefrontal channel F2, where parametric upper
Spitzer and Blankenburg • Supramodal Parametric Working Memory in Humans
J. Neurosci., March 7, 2012 • 32(10):3287–3295 • 3291
Figure 3. Modality-specific alpha topographies. A, Statistical topographical maps of modality-specific alpha activity. In each row, alpha activity in one modality (blue, tactile; green, auditory; red, visual) was contrasted against the two remaining modalities. Modality-specific patterns were most pronounced during stimulation (f1, f2) and late retention (2–3 s). B, 3D source reconstructions of the modality-specific alpha contrast decreases shown in A. C, Correlations of modality-specific contrast decreases over somatosensory (left) and visual (right) areas during retention (1–3 s) with individual task-performance levels. Different bar colors represent correlations with performance in the different tasks (normalized to subject mean). Representative channels used for computation are outlined in A. By tendency, correlations with performance in the contrasts’ target conditions were always positive, while any correlations with performance in the contrasts’ non-target conditions were negative. For the A-TV contrast decrease over temporal channels, none of the correlations reached significance (all p values ⬎0.30).
contrast maximum separately for each modality (cf. Fig. 4 A). The three maxima were found to lie within a narrow TF range (21–26 Hz, 2850 –2950 ms), at neighboring channels (F2 and FC2). Figure 4 B illustrates for each modality condition the changes of prefrontal beta amplitude as a function of f1 (relative to modality condition mean) for the TF maxima identified above. As expected, in the tactile task (Fig. 4 B, left) a significant parametric modulation by vibrotactile frequency was found (TF maximum at 21 Hz, 2850 ms, F2; p ⬍ 0.005). Moreover, and central to the present study, a significant parametric modulation of prefrontal beta by f1 was evident in the auditory task as well (TF maximum at 26 Hz, 2900 ms, FC2; p ⬍ 0.001). In fact, prefrontal beta during auditory WM maintenance (Fig. 4 B, middle) exhibited a strictly monotonic increase across the six acoustic flutter frequencies. To the best of our knowledge, this is the first demonstration of parametric WM effects during maintenance of auditory, rather than somatosensory, stimulus information in humans. For the visual task, initial analysis revealed only a mild linear modulation of prefrontal beta across the six visual flicker stimuli (TF maximum at 25 Hz, 2850 ms, p ⫽ 0.01). Closer inspection of this modulation (Fig. 4 B, right) shows that prefrontal beta increased from lower to midrange flicker frequencies, but de-
creased again for the fastest flicker stimuli (30 Hz and above). We reasoned that this result might be affected by partial “flickerfusion,” whereby flicker above an individually different frequency may appear as an increasingly steady light (Smith and Misiak, 1976; Gutherie and Hammond, 2004). Thereby, encoding of the fast visual flicker’s frequencies may have been compromised, which may explain not only the relatively low f1–f2 discrimination performance for these stimuli (see behavioral results), but also the lack of a frequency-dependent representation of fast visual flicker during stimulus maintenance. In fact, after discarding the fastest f1 flicker stimuli (34 Hz) for which the likelihood of fusion was highest, a statistically more robust linear modulation of prefrontal beta emerged across the remaining stimulus frequencies (14 –30 Hz, p ⬍ 0.005, Fig. 4 B). Figure 4C illustrates topographical statistical maps and SPM 3D source reconstructions of the above parametric modulations. In each modality condition, the parametric modulation was maximal over prefrontal scalp channels and by tendency right lateralized. Consistently, the modulations were source-localized to regions in right lateral prefrontal cortex, including the right inferior frontal gyrus (IFG, BA 45/44) in the auditory and visual tasks (Fig. 4C, middle and right), and a slightly more anterior right
3292 • J. Neurosci., March 7, 2012 • 32(10):3287–3295
Spitzer and Blankenburg • Supramodal Parametric Working Memory in Humans
Figure 4. Parametric modulations of oscillatory activity by the stimulus frequency maintained in working memory. A, Left, Time-frequency statistical parametric map indicating the significance of overall linear modulations of oscillatory activity by f1 frequency, collapsed across modality conditions, for representative channel F2. Maximum at 26 Hz, 2800 ms (p ⬍ 0.05, FWE). Right, Changes of prefrontal upper beta amplitudes as a function of f1. Amplitudes were zero-centered relative to overall mean. B, Changes of prefrontal upper beta amplitudes as a function of f1 frequency, for the different modality conditions. Amplitudes were zero-centered relative to modality condition mean. In all modalities, significant linear modulations were found (indicated by solid colored lines). In the visual condition (right), the fastest flicker frequencies (⬎30 Hz) may have been partially “fused” (see Discussion) and were excluded from subsequent analyses (light red indicates modulation across the remaining visual f1s, 14 –30 Hz). C, Topographical statistical maps (color-scaling as in A) and 3D source reconstructions of the above parametric modulations. Source renderings appear larger for more superficial sources and may not reflect actual differences in activity strength between modality conditions. D, Conjunction analysis of parametric contrast activity common to all three modality conditions. E, Overall parametric modulation by f1 (cf. A, computed from correct trials (dark brown) compared with incorrect trials (light brown). On incorrect trials, the parametric modulation was significantly reduced (z ⫽ 3.06, p ⬍ 0.005; resampling statistics based on 1000 iterations).
prefrontal region in the tactile task (Fig. 4C, left). Within the limited precision of EEG source reconstruction, these results suggest that lateral right prefrontal cortex which has been shown to be crucially involved in WM processing of vibrotactile information in animals and humans (Romo et al., 1999; Spitzer et al., 2010; Auksztulewicz et al., 2011), also plays a central role in WM processing of auditory and visually presented frequency information. For objective quantification of the temporal, spectral, and topographical overlap of the parametric modulations illustrated in Figure 4, B and C, we performed conjunction analysis across the parametric GLM contrasts in the three modality conditions. Complementing the analysis of the overall modulation by f1 (cf.
Fig. 4 A) which may have been driven by modulations in any of the three modalities, conjunction analysis delineates the common time/frequency/channel space of parametric modulations evident in each of the modalities. The conjunction analysis (Fig. 4 D) revealed a cluster of significant overlap at channel F2, between 2500 and 3000 ms in the upper beta band (maximum at 25 Hz), indicating that the (very similar) overall modulation by f1 (cf. Fig. 4 A) was indeed driven by parametric modulations in each of the three modality conditions. Conjunction analysis of the focal parametric modulations in source space (cf. source renderings in Fig. 4C) yielded no significant result, which may be explained by the limited spatial precision of EEG source reconstruction applied to relatively small
Spitzer and Blankenburg • Supramodal Parametric Working Memory in Humans
numbers of trials. Targeted analysis of potential modalityspecific differences did not produce significant results either, indicating that the precise anatomical origin of the modulations within lateral PFC may not be determined on a finer spatial scale from the present analysis of noninvasive EEG. Concluding our analysis, we sought to determine the potential behavioral relevance of the parametric modulation effects described above. The relatively small number of available error trials per modality-frequency combination precluded separate analyses in each modality condition. We therefore repeated the analysis of overall parametric modulations by f1 (collapsed across modalities, cf. Fig. 4 A) on error trials, which yielded no indication of any significant modulation (Fig. 4 E). To account for the smaller number of incorrect compared with correct trials, we used resampling statistics (Voytek et al., 2010) based on 1000 iterations to determine the significance of the observed reduction in modulation strength. On each iteration we determined the average GLM regression coefficient for the parametric modulation by f1 in a subset of randomly drawn correct trials (matched to the number of incorrect trials available for each frequency and modality condition), to estimate a surrogate distribution of coefficients expected under the hypothesis of no difference between correct and error trials. Relative to the surrogate distribution’s mean (0.01), the observed coefficient on incorrect trials (⫺0.002, Fig. 4 E) was significantly decreased (z ⫽ 3.06, p ⬍ 0.005), indicating a statistically reliable reduction of the f1-dependent parametric modulations on error trials.
Discussion To summarize, in each of the different modality conditions (tactile, auditory, visual), WM maintenance of periodic stimulus frequency was accompanied by task-induced increases of alpha activity over occipitoparietal areas. Between-modality comparisons further revealed characteristic and behaviorally relevant distributions of alpha over somatosensory, auditory, and visual cortices, according to task modality. Finally, and most central to the present investigation, parametric WM representations of the task-relevant frequency information in prefrontal cortex, in terms of modulations of upper beta oscillations, were evident regardless of the sensory modality in which the information was presented. After extensive study in non-human primates (for review, see Romo and Salinas, 2003) vibrotactile DMTS frequency discrimination tasks have received increased attention in recent investigations of human WM processing (Preuschhof et al., 2006; Kostopoulos et al., 2007; Burton et al., 2010; Haegens et al., 2010; Spitzer et al., 2010; Bancroft et al., 2011; Bancroft and Servos, 2011; Spitzer and Blankenburg, 2011). In addition to evidence for the engagement of broadly similar task-relevant brain areas in both species, recent EEG/MEG work in humans consistently showed increases in oscillatory alpha activity over visual areas considered irrelevant for the tactile task (Haegens et al., 2010; Spitzer et al., 2010; Spitzer and Blankenburg, 2011). As expected, such effect was replicated in the present analysis of DMTS retention in the nonvisual (tactile and auditory) modalities, in accordance with the prominent view of alpha increases as a signal of top-down controlled cortical inhibition (Klimesch et al., 2007). Interestingly however, albeit initially less pronounced, parieto-occipital alpha amplitudes increased also during WM maintenance of visual flicker information, apparently conflicting with an interpretation in terms of disengagement of taskirrelevant sensory areas. Indeed, alpha increases during WM maintenance of visually presented items, such as faces or letters, have been reported pre-
J. Neurosci., March 7, 2012 • 32(10):3287–3295 • 3293
viously, and were found to correlate positively with WM “load” (i.e., the number of to-be-maintained items; Jensen et al., 2002; Tuladhar et al., 2007). According to inhibitory accounts of alpha, these effects relate to suppression of information that may interfere with WM maintenance (Klimesch et al., 2007; Tuladhar et al., 2007; but see Palva and Palva, 2007), suggesting a prevalence of top-down controlled, internal processing as WM demands increase. Indeed, despite the low WM load of only a single stimulus attribute, the present DMTS task emphasized active internal processing, demanding the evaluation and maintenance of abstract quantity information (see below). At the same time, peripheral flicker stimuli per se are low in visual complexity and easily registered even with little attention devoted to the visual environment. Together, emphasizing internal over externally oriented processing, our results are compatible with an inhibitory view of posterior alpha (for review, see Klimesch et al., 2007) and suggest that visual sensory areas may have been disengaged to a certain degree even in the visual DMTS task. In this light, at least a portion of the posterior alpha increases previously considered a hallmark of nonvisual DMTS tasks (Haegens et al., 2010; Spitzer et al., 2010) appears as a general aspect of active frequency processing in WM, regardless of presentation modality. In addition to task-induced effects in visual areas (relative to a prestimulus baseline), our analysis showed that the different modality conditions were characterized by specific distributions of alpha activity over visual, tactile and auditory cortices, respectively. By tendency, these patterns persisted throughout the entire task period, including the prestimulus interval, and were found to be systematically related to participants’ individual performance levels. In particular during retention, optimal DMTS performance in a given modality condition appeared to be reflected both by relatively large alpha amplitudes in task-irrelevant sensory areas, and by relatively small alpha amplitudes in those sensory areas that encoded the stimulus information. These results generalize previous evidence for a disengagement of task-irrelevant sensory areas during vibrotactile DMTS tasks, in terms of increased alpha activity (Haegens et al., 2010; Spitzer et al., 2010), to analogous tasks in other sensory modalities. Further, they corroborate recent evidence for a sustained engagement of the task-relevant sensory areas during WM processing of previous sensory input (Spitzer and Blankenburg, 2011). Such WM-related effects on activity in sensory areas may be closely intertwined with a neural signature of modalityspecific attention (Awh et al., 2006), and thus may not easily be detected in traditional analyses of WM-related activity changes relative to prestimulus periods of attentive expectation (for related results and discussion, see Spitzer and Blankenburg, 2011; Langner et al., 2011). Central to the present investigation however, while WM processing was accompanied by activity changes in modality-specific sensory areas, these areas did not reflect the task-relevant memory contents (i.e., stimulus frequency). The notion of a parametric coding of periodic stimulus frequency in lateral PFC was originally derived from the observation of monotonic relations between single cells’ firing rates and the to-be-maintained frequency of vibrotactile stimuli, in nonhuman primates (Romo et al., 1999). Only recently, parametric WM processing of vibrotactile frequency was found to be reflected also on a large-scale neuronal population level, by modulations of prefrontal oscillatory activity in human EEG recordings (Spitzer et al., 2010; Spitzer and Blankenburg, 2011). The present results for the first time extend and generalize these parametric WM findings from the vibrotactile domain to DMTS frequency maintenance in other sensory modalities. In particular, in con-
3294 • J. Neurosci., March 7, 2012 • 32(10):3287–3295
trast to parametric manipulations of WM load, which typically lead to increases of prefrontal theta activity (⬃4 –7 Hz; Jensen and Tesche, 2002), our previous and present findings converge on a central role of parametric activity in the upper beta band during WM processing of a single stimulus attribute. Representing a formalized link to the to-be-maintained stimulus, delayed parametric modulations of neural activity may be considered as correlates of WM processing per se (GoldmanRakic, 1995), but the precise function of such parametric activity remains unclear. We recently hypothesized that parametric prefrontal WM effects may indicate an abstract internal scaling of analog quantity information, according to DMTS task demands (Spitzer and Blankenburg, 2011). Parametric WM activity during DMTS retention (Romo et al., 1999; Barak et al., 2010; Spitzer et al., 2010; Spitzer and Blankenburg, 2011) may thereby reflect a WM representation of f1’s “value” on such abstract internal scale. The present finding of similar prefrontal activity modulations across different modality conditions, and for perceptually dissimilar appearances of temporal frequency information, supports such view of parametric WM as supramodal processing of abstract quantity. Thereby, like in our previous tactile work, f1dependent prefrontal activity emerged with considerable delay after f1 onset, in line with the suggestion that parametric beta activity may in particular reflect active maintenance processes preventing the decay of previous sensory information in WM (Spitzer and Blankenburg, 2011). Across the different modality conditions, the strongest parametric modulations by f1 were found in the upper beta frequency range, at very similar times during late retention, and were localized to right lateral prefrontal sources, including the IFG. Minor topographical and spectral differences between conditions may be accounted for by precision limits of noninvasive EEG. However, an obvious deviation from the overall modulation pattern was evident for fast visual flicker stimuli (⬎30 Hz), for which prefrontal beta did not increase as predicted by a linear trend across the entire stimulus range. As a likely explanation for this deviation, taking into account the relatively poor behavioral performance for fast visual flicker, these stimuli may have approached many participants’ “critical flicker-fusion frequency,” above which flicker is perceived as a continuous, increasingly steady light (Smith and Misiak, 1976; Gutherie and Hammond, 2004). Consequently, direct assessment of the fast visual flickers’ periodic frequency may have been compromised, compared with the auditory and tactile domains, in which much higher stimulus frequencies can be encoded (Pollack, 1952; Talbot et al., 1968). Indeed, considering that partial flicker fusion may have rendered the appearance of the fast visual frequencies qualitatively different, the observed pattern of prefrontal beta activity in the visual task fits well with our view of parametric WM activity as quantitative scaling of the task-relevant stimulus dimension, which in the present context was informed by the fine temporal properties, or speed, of periodic stimulus dynamics. At the same time, the above results join previous evidence against alternative interpretations of parametric WM effects in terms of increasing taskdifficulty (Spitzer and Blankenburg, 2011). To conclude, the present study for the first time generalizes previous evidence for parametric WM processing in human prefrontal cortex, as previously demonstrated for vibrotactile information only, to the auditory and visual modalities. Converging with the recent unimodal work, parametric WM activity was reflected by upper beta oscillations in right-lateral PFC, and was found to be behaviorally relevant. The results extend and complement previous work in animals and humans and portray fre-
Spitzer and Blankenburg • Supramodal Parametric Working Memory in Humans
quency processing in prefrontal cortex as modality-independent internal scaling of abstract quantity information in working memory.
References Allefeld C, Pu¨tz P, Kastner K, Wackermann J (2011) Flicker-light induced visual phenomena: Frequency dependence and specificity of whole percepts and percept features. Conscious Cogn 20:1344 –1362. Auksztulewicz R, Spitzer B, Goltz D, Blankenburg F (2011) Impairing somatosensory working memory using rTMS. Eur J Neurosci 34:839 – 844. Awh E, Vogel EK, Oh SH (2006) Interactions between attention and working memory. Neuroscience 139:201–208. Bancroft T, Servos P (2011) Distractor frequency influences performance in vibrotactile working memory. Exp Brain Res 208:529 –532. Bancroft TD, Servos P, Hockley WE (2011) Mechanisms of interference in vibrotactile working memory. PLoS ONE 6:e22518. Barak O, Tsodyks M, Romo R (2010) Neuronal population coding of parametric working memory. J Neurosci 30:9424 –9430. Bendor D, Wang X (2007) Differential neural coding of acoustic flutter within primate auditory cortex. Nat Neurosci 10:763–771. Burton H, Sinclair RJ, Dixit S (2010) Working memory for vibrotactile frequencies: comparison of cortical activity in blind and sighted individuals. Hum Brain Mapp 31:1686 –1701. Fechner G (1966) Elements of psychophysics. New York: Holt Rinehart and Winston. Friston K, Henson R, Phillips C, Mattout J (2006) Bayesian estimation of evoked and induced responses. Hum Brain Mapp 27:722–735. Friston K, Harrison L, Daunizeau J, Kiebel S, Phillips C, Trujillo-Barreto N, Henson R, Flandin G, Mattout J (2008) Multiple sparse priors for the M/EEG inverse problem. Neuroimage 39:1104 –1120. Goldman-Rakic PS (1995) Cellular basis of working memory. Neuron 14: 477– 485. Gutherie AH, Hammond BR Jr (2004) Critical flicker fusion frequency: relation to resting systolic blood pressure. Optom Vis Sci 81:373–376. Haegens S, Osipova D, Oostenveld R, Jensen O (2010) Somatosensory working memory performance in humans depends on both engagement and disengagement of regions in a distributed network. Hum Brain Mapp 31:26 –35. Ille N, Berg P, Scherg M (2002) Artifact correction of the ongoing EEG using spatial filters based on artifact and brain signal topographies. J Clin Neurophysiol 19:113–124. Jensen O, Tesche CD (2002) Frontal theta activity in humans increases with memory load in a working memory task. Eur J Neurosci 15:1395–1399. Jensen O, Gelfand J, Kounios J, Lisman JE (2002) Oscillations in the alpha band (9 –12 Hz) increase with memory load during retention in a shortterm memory task. Cereb Cortex 12:877– 882. Jones SR, Kerr CE, Wan Q, Pritchett DL, Ha¨ma¨la¨inen M, Moore CI (2010) Cued spatial attention drives functionally relevant modulation of the mu rhythm in primary somatosensory cortex. J Neurosci 30:13760 –13765. Kiebel SJ, Tallon-Baudry C, Friston KJ (2005) Parametric analysis of oscillatory activity as measured with EEG/MEG. Hum Brain Mapp 26:170177. Kilner JM, Kiebel SJ, Friston KJ (2005) Applications of random field theory to electrophysiology. Neurosci Lett 374:174 –178. Klimesch W, Sauseng P, Hanslmayr S (2007) EEG alpha oscillations: the inhibition-timing hypothesis. Brain Res Rev 53:63– 88. Kostopoulos P, Albanese MC, Petrides M (2007) Ventrolateral prefrontal cortex and tactile memory disambiguation in the human brain. Proc Natl Acad Sci U S A 104:10223–10228. Langner R, Kellermann T, Boers F, Sturm W, Willmes K, Eickhoff SB (2011) Modality-specific perceptual expectations selectively modulate baseline activity in auditory, somatosensory, and visual cortices. Cereb Cortex 21:2850 –2862. Litvak V, Friston K (2008) Electromagnetic source reconstruction for group studies. Neuroimage 42:1490 –1498. Mu¨ller N, Weisz N (2011) Lateralized auditory cortical alpha band activity and interregional connectivity pattern reflect anticipation of target sounds. Cereb Cortex. Advance online publication. Retrieved October 12, 2011. doi: 10.1093/cercor/bhr232. Palva S, Palva JM (2007) New vistas for alpha-frequency band oscillations. Trends Neurosci 30:150 –158. Pollack I (1952) Auditory flutter. J Psychol 65:544 –554.
Spitzer and Blankenburg • Supramodal Parametric Working Memory in Humans Preuschhof C, Heekeren HR, Taskin B, Schubert T, Villringer A (2006) Neural correlates of vibrotactile working memory in the human brain. J Neurosci 26:13231–13239. Rohenkohl G, Nobre AC (2011) Alpha oscillations related to anticipatory attention follow temporal expectations. J Neurosci 31:14076 –14084. Romo R, Salinas E (2003) Flutter discrimination: neural codes, perception, memory and decision making. Nat Rev Neurosci 4:203–218. Romo R, Brody CD, Herna´ndez A, Lemus L (1999) Neuronal correlates of parametric working memory in the prefrontal cortex. Nature 399: 470 – 473. Smith JM, Misiak H (1976) Critical flicker frequency (CFF) and psychotropic drugs in normal human subjects-a review. Psychopharmacologia 47:175–182. Spitzer B, Blankenburg F (2011) Stimulus-dependent EEG activity reflects internal updating of tactile working memory in humans. Proc Natl Acad Sci U S A 108:8444 – 8449.
J. Neurosci., March 7, 2012 • 32(10):3287–3295 • 3295 Spitzer B, Wacker E, Blankenburg F (2010) Oscillatory correlates of vibrotactile frequency processing in human working memory. J Neurosci 30:4496 – 4502. Talbot WH, Darian-Smith I, Kornhuber HH, Mountcastle VB (1968) The sense of flutter-vibration: comparison of the human capacity with response patterns of mechanoreceptive afferents from the monkey hand. J Neurophysiol 31:301–334. Tuladhar AM, ter Huurne N, Schoffelen JM, Maris E, Oostenveld R, Jensen O (2007) Parieto-occipital sources account for the increase in alpha activity with working memory load. Hum Brain Mapp 28:785–792. Voytek B, Davis M, Yago E, Barcelo´ F, Vogel EK, Knight RT (2010) Dynamic neuroplasticity after human prefrontal cortex damage. Neuron 68:401- 408. Worsley KJ, Marrett S, Neelin P, Vandal AC, Friston KJ, Evans AC (1996) A unified statistical approach for determining significant signals in images of cerebral activation. Hum Brain Mapp 4:58 –73.