Neuronames: Hu- man/macaque neuroanatomical nomenclature. In Proceed- ing., 14th Annual Sympoaium on Computer Application. in Medical Care, pages ...
Visualization and Mapping of Neurosurgical Functional Brain Data onto a 3-D MR-based Model of the Brain Surface B. R. Modayur, J. Prothero, C. Rosse, R. Jakobovits, and J.F. Brinkley Dept. Biological Structure University of Washington, Seattle, WA 98195
ABSTRACT
in order to develop new insights into brain function. In response to this need, a national Human Brain Project Initiative was instigated in 1993, the goal of which is to develop methods for managing and sharing information about the brain [1]. As a prototype Human Brain Project application we are developing a system for organizing, visualizing, integrating and sharing information about human language function, initially obtained during neurosurgery for intractable epilepsy, but in the longer term obtained from multiple sources. Our basic approach is to organize functional language data around a structural information framework that we are developing as part of the Digital Anatomist Program at the University of Washington [2], [3]. The functional brain mapping project is one test of our hypothesis that a structural framework provides a rational foundation for organizing many kinds of biomedical information. The framework we are developing will organize language data both spatially and symbolically. The data will be organized symbolically by labelling them with well-defined neuroanatomic terminology developed as an extension to the Unified Medical Language System [4]. In this paper we describe methods for spatially organizing the data by mapping them onto a 3-D MR-based model of the patient's own brain.
The Human Brain Project was initiated with the goal of developing methods for managing and sharing information about the brain. As a prototype Human Brain Project application we are developing a system for organizing, visualizing, integrating and sharing information about human language function. The goal of the brain mapping component of our work, described in this article, is to generate the 3D location and extent of cortical language sites with respect to a uniform, 3D patient coordinate system. The language sites of individual patients can then be combined with or related to other patient data in terms of a Talairach, surface-based, or other deformable coordinate systems. Language site mapping is done by visually comparing an intraoperative photograph with the rendered image (from MRI data). The techniques outlined in this article have been utilized to map cortical language sites of six patients. Preliminary results point to the adequacy of our volume visualizations for language mapping. The strength of the visualization scheme lies in the combination of interactive segmentation with volume and surface visualization. We are now in the process of acquiring more patient data to further validate the tuefulness of our method.
INTRODUCTION
CORTICAL LANGUAGE MAPPING
In the past decade there has been an explosion of information about the human brain, due in large part to advances in technology that permit not only the structure, but also the function of the living brain to be studied. The amount of information is now so great that no single researcher is able to grasp it all, yet it is becoming increasingly necessary to integrate multiple sources of information
The language data that we are initially utilizing are obtained at the time of neurosurgery for intractable left temporal focal epilepsy. Previous studies have shown [5] that a discrete set of approximately 1 cm regions on the surface of the left temporal cortex are important for language: if these areas are avoided at surgery the patient has no language deficit, but if they are not avoided
0195-4210/96/$5.00 0 1996 AMIA, Inc.
304
there is usually some deficit. The problem for the neurosurgeons is that the distribution of these language sites is different for each patient. The neurosurgeons therefore determine the location of the sites for each patient by stimulation mapping: the relevant skull is removed, then the patient is awakened and shown a series of slides of common objects while different areas of the surface are electrically stimulated. Previous work has shown that a site is essential for language if the patient is not able to name the object [5]. Therefore these sites are avoided if possible during the resection. The language maps obtained in this way provide a rich source of information for research on language understanding, and non-computer- based studies have shown interesting correlations between the distribution of sites and such behavioral indicators as verbal IQ [5]. However, extensive data processing is too tedious for manual methods. The main source of data for the information management system we are developing is a digitized photograph of the exposed cortical surface, showing a series of numbered tags that define the areas that were stimulated (Figure 2). Associated with this photograph is a list of the numbered sites that were found to be essential for language. In addition, as part of a new protocol developed for this project, we obtain a series of MR image volumes the day before surgery.
-.
..
j..
:.
'I
..
4
-
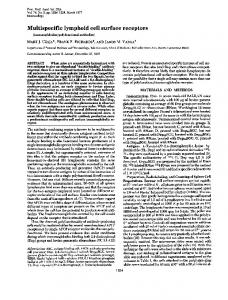
Figure 1: Overall dataflow for visualization and mapping
Overview of the Brain Mapper
sites. The mapping process involves dragging site numbers and placing them at the appropriate location on the cortex. The 3D coordinates at the language site will be easily available as a result of information preserved in the rendering process. The language mapping process is carried out in five stages: (i) data acquisition, (ii) alignment and cropping, (iii) cortical segmentation, (iv) visualization, and finally (v) language site mapping. The five stages are described below. The overall flow of data in the brain mapper is shown in Figure 1. Our heterogenous software environment consists of Advanced Visual Systems' AVS, a commercial data visualization package, and Skandha4, an inhouse graphics program. The alignment and language mapping are carried out in Skandha4, while the rest of the stages have been implemented in AVS. The advantage of using AVS is the availability of a large number of volume processing and visualization modules. These modules can be connected together in the form of AVS net-
The goal of the brain mapping component of our work is to generate the location and extent of the language sites with respect to a uniform, 3D patient coordinate system. The language sites of individual patients can then be combined with or related to other patient data in terms of a Talairach, surface-based, or other deformable coordinate systems. In the long term, 3D information about the language sites will be obtained using a 3D locating device. In the absence of an accurate locator device, our current approach is to create a realistic rendered image of the left cortical temporal surface to match the intra-operative photograph showing the essential language sites. The rendered image will clearly delineate the cortical surface and the associated blood vessels (arteries and veins). The neurosurgeon will be able to visually compare the intraoperative photograph with the rendered image, utilize the blood vessels and cortical landmarks to orient themselves, and map the language
305
information that relates it to the machine coordinate space. Cropping reduces the size of the datasets from over 100 megabytes to less than 10 megabytes, while still retaining enough information for satisfactory renderings. The cropped datasets are input to the segmentation module.
works using a visual programming language, thus enabling rapid prototyping and experimentation. AVS also provides a programming environment and user interface toolkits for transforming existing user-written code into AVS modules.
Data Acquisition
Cortical segmentation
MRI data are acquired the day before surgery in a series of three examinations optimized for cortical, venous, and arterial data respectively. All studies are performed on a whole body 1.5 Tesla MR scanner. A temporal phased-array coil centered over the sylvian fissure bilaterally is used to increase signal-to-noise ratio. The patient's head is immobilized using a vacuum-assisted head holder throughout the three examinations. For our studies, we assume that the head movement between exams is negligible. The exams provide the following three datasets: (a) Cortex: Three dimensional gradient recalled acquisition yielding 124 sagittal slices at 1.2mm spacing, (b) Veins: Two dimensional time-of-flight gradient recalled acquisition yielding a venogram dataset of 100 axial slices at 1.5 mm spacing, and (c) Artery: Three dimensional time-of-flight gradient recalled acquisition yielding an arteriogram dataset of 64 axial slices at 0.9 mm spacing.
In order to effect an efficient volume rendering of the cortical surface, interfering opaque structures such as the skull have to be segmented out from cortical data. The region growing algorithm described in [6] is used to derive a region-of-interest mask for cortical data. The segmented data are volume rendered to produce an image of the left temporal cortical surface. The output of the region grower is a set of labelled 3D regions or volumes. A label of zero indicates that the voxel is part of the background. The volumes are viewed by the user through the AVS module orthogonal slicer. The object of interest (in this case, the cortex) is selected by the user interactively. This becomes the region of interest mask for the rendering process.
Visualization The segmented cortical mask generated by the region grower is used as a region of interest mask for the rendering process. The mask ensures that data extraneous to the cortex are excluded from the rendering. The cortical mask is processed through a series of morphological routines to produce an annular region around the cortex surface. An annular region is used so that blood vessels deep to the cortical surface are excluded from the rendering. The three cropped datasets, along with the region of interest mask, are loaded into an AVS visualization network. The user interacts with this network, providing suitable grayscale contrast enhancements to ensure that tiny blood vessels show up in the final rendering. The gradient-shading ray-caster, which is part of standard AVS-supplied modules, is used to produce the rendering. The user adjusts parameters such as lighting location, color, ambience, surface properties, and grayscale contrast of the datasets until a satisfactory rendering is achieved. The three rendered images produced are finally composited to produce a single image showing cortex and the associated surface veins and arteries.
Alignment and Cropping Each exam series is acquired at a different orientation and spatial resolution. This necessitates registering the three volumes. The alignment procedure is implemented in Skandha4. The result of the alignment is a set of three volumes registered in the same machine coordinate system and having uniform-sized voxels. Information regarding slice thickness, slice spacing, voxel size, and location and orientation of the slices with respect to the machine coordinate system are extracted from the MR image headers. The datasets are rotated in 90 degree increments until all of them are in the same machine space orientation. Then the volumes are resampled into a 256-cubed grid. This results in a set of volumes each of which is a 2563 dataset, where the i, j, kth voxel in each dataset corresponds to the same physical location in the machine coordinate system. Cropping of the datasets is necessary due to AVS's inefficient usage of memory. Cropping is applied uniformly across the three datasets so that a cropped voxel will still have valid coordinate
306
Discussion
The AVS ray-caster module was modified to produce an additional floating point, 3-vector AVS field that represents the optical depth of each pixel in the rendered image. During the ray-casting process, the point along the 3D ray at which a particular percentage of opacity (say, 20%) is reached is defined to be the optical depth of that pixel. The optical depth approximates the 3D brain surface coordinate of a pixel in the final rendered image. If the optical depth opacity is set to be zero, then the 3D coordinate returned for a pixel is that of the first foreground voxel encountered by the cast ray. The 3D coordinate field produced this way is used during the actual mapping process to derive the 3D location of the mapped language sites.
The techniques outlined in this article have been utilized to partially map essential language sites of six patients. We are now in the process of acquiring more patient data to further validate the usefulness of our method. Preliminary results point to the adequacy of our volume visualizations of cortex and blood vessels in language mapping. The strength of the visualization scheme lies in the combination of interactive segmentation with volume and surface visualization. Using the scheme outlined in this article, one can visualize cortical anatomy with the associated blood vessels and also describe precisely, the location and extent of functional areas in terms of a uniform coordinate system. The main drawback of our current visualizations is that blood vessels, which are important landmarks used by neurosurgeons to orient themselves, show up poorly in the composite renderings. We have been able to produce excellent surface renderings of the blood vessels, however, using the AVS isosurface module. We are now developing methods for combining these with the anatomy renderings. We are also in the process of implementing a database system for managing the mapped data, and a Web-based interface to the database. Once the database is in place we will develop methods for correlating multiple patient data as well as data from multiple modalities. In order to relate multiple patient data, we need to add to our brain mapper the capability to map brain data to Talairach [7] or surface-based coordinate systems [5]. This will allow us to make a probabilistic determination about the functional membership of a particular brain voxel, and also to relate language sites to studies recorded in other online databases [8]. In addition, we will be able to generate color codes that signify probability distributions of language areas, and superimpose them onto the patient's cortical rendering for use in surgical planning. We will also develop methods for symbolically organizing functional brain data according to well-defined terminology, and for combining these organizational approaches in an online database that can be accessed by brain researchers. As these features are added, and as other brain project information systems are linked over the Internet, we can expect to see many new insights about the functioning of the human brain that will be arrived at not by new experiments, but by an integration of data from existing exper-
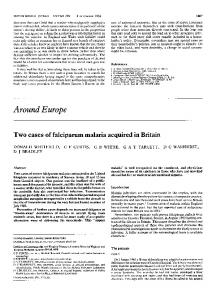
Language site mapping The language site mapping is done using the Skandha4 package. The rendered visualizations produced by AVS, the corresponding intraoperative photograph, and the original MR volume data are loaded into the language mapping module. The interface is shown in the screen dump of Figure 2. The language site mapping is done by the user, who may be a technician or a neurosurgeon, by comparing the intraoperative photograph visually with the rendered image, dragging the numbered tags from a palette, and dropping them off at the location corresponding to the numbered tags on the photograph. The vasculature and the cortical surface features guide the user in the accurate localization of the language sites. The two orthogonal MR slices shown on the right of the interface correspond to the two orthogonal lines (shown superimposed on the rendered image) and can be used to relate features on the rendered image to the original volume data. Major cortical landmarks such as the sylvian fissure, central sulcus, and the superior, middle, and inferior temporal gyri are clearly visible in the volume rendering shown in Figure 2. In addition, the major blood vessels can also be seen in conjunction with cortical anatomy. The language sites have been identified by a neurosurgeon using the cortical landmarks and the blood vessels and correlating the intraoperative photograph with the rendered image. After the mapping is complete, the language sites and their corresponding 3D coordinates in machine space are stored for that particular patient.
307
iments.
[3] J.F. Brinkley, K. Eno, and J.W. Sundsten. Knowledge-
based client-server approach to structural information retrieval: the Digital Anatomist Browser. Computer Methods and Programs in Biomedicine, 40:131-145, 1993.
Acknowledgments This work was funded by Human Brain project grant DC/LM02310, co-funded by the National Institute for Deafness and Other Communication Disorders, and the Nationl Library of Medicine. We would like to thank Jay Tsuruda and Ken Maravilla for developing the MR protocols, and George Ojemann and Etore Lettich for providing the surgical data and for mapping the language sites in figure 2.
[4] R.F. Martin, J. Dubach, and D. Bowden. Neuronames: Human/macaque neuroanatomical nomenclature. In Proceeding., 14th Annual Sympoaium on Computer Application. in Medical Care, pages 1018-1019. American Medical Informatics Asweiation, 1990. [5] G. Ojemann, J. Ojemann, E. Lettich, and M. Berger. Cortical language localization in left, dominant hemisphere. J Neurosurgery, 71:316-326, 1989.
[6] L. Myers and J. Brinkley. Visualization of brain surface features using registered partially segmented mri scans. In SPIE Medical Imaging: Image Display, pages 43-52. San Diego, CA, 1995.
References [11 C.M. Pechura and J. B. Martin (Editors). Mapping the Brain and its Functions. National Academy Press, Washington D.C., 1991.
[7] J. Talairach and P. Tournoux. Co-planar atereotaxic atla.
[2J J.F. Brinkley, J.S. Prothero, J.W. Prothero, and C. Rosse.
[8] P. Fox, S. Mikiten, G. Davis, and J. Lancaster. Brainmap:
A framework for the design of knowledge-based systems in structural biology. In Proceedings, 15th Annual Symposium on Computer Applications in Medical Care, pages 61-65, Baltimore, Maryland, 1989.
A database of human functional brain mapping. In Functional Neuroimaging, pages 95-105. Academic Press, San Diego, 1994.
w w ~~~~~~~~~~~~~~. - - i v:: E ~~~~.
::
."'
.......
........... ........ .....
of the human brain. Thieme Publishers, New York, 1988.
.S ...:::..... .. :.:.:.:::..8: :........
: : ;@.
..........
..............
......J
..................
~~
---
.....
,-..............
. ..;~~~~~~~~~~~~~~................ .... #{S //R M#{{R.-.-StB #.M- {diM.-S./B S/# t .. . . The photograph. the tSd{2/#{MS{S{intraoperative volume~~~~~~~~~~-shows.... Figure 2: The brainmapper. Top left of the interfice orthogonal... two the to corresponding slices MR are right the To left. bottom the at shown is visualization shown. are Sites~~~~~~~~~~~~... lines shown superimposed on the rendered image. The sites, mapped by a neurosurgeon, >d
S
/2 .... { {#{. . 8{
marked by smallrectangles are essential for
.
language.~~~~~~~~~~~~~~~~~~~~~~~~~~~~~~~~~~~~~.....................
308
-
-
-------