Technical Note pubs.acs.org/ac
Surface Plasmon Resonance Imaging by Holographic Enhanced Mapping B. Mandracchia,*,†,‡ V. Pagliarulo,† M. Paturzo,† and P. Ferraro† †
CNR−Istituto di Cibernetica “E. Caianiello”, Via Campi Flegrei 34, 80078, Pozzuoli, Napoli, Italy Dipartimento di Ingegneria Chimica, dei Materiali e della Produzione Industriale, Università di Napoli Federico II, Piazzale Tecchio 80, 80100, Napoli, Italy
‡
W Web-Enhanced Feature * S Supporting Information *
ABSTRACT: We designed, constructed and tested a holographic surface plasmon resonance (HoloSPR) objective-based microscope for simultaneous amplitude-contrast and phasecontrast surface plasmon resonance imaging (SPRi). SPRi is a widely spread tool for label-free detection of changes in refractive index and concentration, as well as mapping of thin films. Currently, most of the SPR sensors rely on the detection of amplitude or phase changes of light. Despite the high sensitivities achieved so far, each technique alone has a limited detection range with optimal sensitivity. Here we use a high numerical aperture objective that avoids all the limitations due to the use of a prism-based configuration, yielding highly magnified and distortion-free images. Holographic reconstructions of SPR images and real-time kinetic measurements are presented to show the capability of HoloSPR to provide a versatile imaging method for high-throughput SPR detection complementary to conventional SPR techniques.
S
sensitivity and a different response to the same sample depending on the experimental conditions and, in general, one is more effective where the other is not. Recently, in order to exploit this complementary nature of amplitude and phase contrast methods, the possibility of simultaneous measurements of amplitude and phase contrast SPR images using digital holography (DH) was demonstrated.13 DH in microscope configuration is already used for imaging microstructures and biological systems because of its excellent approach in obtaining intensity and quantitative phase information on a light-wave,14−19 and prism-based configurations have been used to easily combine DH with total internal reflection (TIR) and SPRi.20−22 Unfortunately, the physical constraint of the prism limits both the numerical aperture (NA) and magnification of an imaging system. Hence, it yields a poor spatial resolution compared to that achievable with optical microscopy. Moreover, resolution in prism-based imaging is mainly governed by geometrical aberrations, which distort SPR images.23 Finally, the prism also limits the compatibility with conventional microscopes and causes the images to move when the incident angle is changed, thus limiting the use of angular scanning techniques.
urface plasmon polaritons are an electromagnetic surface wave bound in the region between two dielectrics and a metallic or conducting layer. When external light energy resonantly induces the free electrons of the metal to oscillate at the interface, the radiant energy is absorbed and the metal displays a reflectivity minimum. This phenomenon, called surface plasmon resonance (SPR), occurs at a certain incident angle depending on the index of refraction of the dielectric medium in contact with the metal surface. Detecting changes in the refractive index allows monitoring of biomolecular interactions as well as to achieve two-dimensional imaging, which is called surface plasmon resonance imaging (SPRi). Since its invention in 1988,1 SPRi has become a powerful tool to image subtle interfacial features by means of refractive index contrast. The high sensitivity of SPRi has made it a good tool for the characterization of thin films or to read biomolecular binding events on, for example, DNA or protein microarrays, in a label-free fashion.2−4 Many kinds of SPR imaging systems have been developed in order to obtain instruments for high-throughput analysis with low detection limits. The majority of the current SPRi methods can be divided into two groups, based on amplitude and phase contrast, respectively.5 The amplitude contrast imaging methods detect the intensity distribution of the reflected light beam directly,1,6−8 while phase contrast imaging methods detect the interference pattern between the reflected beam and a reference beam.9−12 Each technique has a different range of © 2015 American Chemical Society
Received: January 8, 2015 Accepted: March 27, 2015 Published: March 27, 2015 4124
DOI: 10.1021/acs.analchem.5b00095 Anal. Chem. 2015, 87, 4124−4128
Technical Note
Analytical Chemistry
passes through a λ/2 plate, where polarization can be rotated and then is focused by an achromatic lens (fL = 200 mm) to the back focal plane of a high numerical aperture objective (Nikon Plan Apo 60× NA 1.49) and finally emerges from the objective as a parallel beam. The radius of the focal spot is estimated Δd = {(DA/2)f L} = 11 μm. In the detection arm, a polarizing cube is placed to laterally split the s- and p-polarization components of reflected light. The s-polarized beam, carrying no information, acts as the reference arm of the interferometer. It passes through another λ/2 plate, which rotates its polarization by 90 deg, converting it in a p-polarized beam, allowing, in this way, the interference with the object beam and, thus, the formation of the holographic images. The interference pattern of the two beam is recorded in a CCD camera (UI-1550SE, 1.92 MPix; pixel size, 2.8 μm) and analyzed by numerical processing. The exit angle θ of the laser beam from the objective is changed using a linear translation stage and calculated by the sine condition of an aplanatic optical system: d = fob sin(θ), where d is the lateral displacement of the stage and f the objective focal length. The error in θ due to the finite focal spot size at the objective back focal plane is given by Δθ = {1/(1 − sin2 θ)}1/2 (Δd/fob). In our setup at 45°, the expected error is Δθ = 4.8 mrad. Digital Holography. Digital holography in off-axis geometry is based on the classic holography principle, with the difference being that the hologram recording is performed by a digital camera and transmitted to a computer and the subsequent reconstruction of the holographic image is carried out numerically. The recorded intensity IH(xH,yH) at the hologram plane is the square module of the amplitude superposition of the object and reference waves. It is given by
An alternative configuration avoids these issues using a high NA microscope objective to launch the SPR, like the throughthe-objective configuration in total internal reflection fluorescence (TIRF) microscopy.24 A high numerical aperture (NA) and high magnification imaging system ensures that the lateral resolution of SPRi in the direction perpendicular to the incident plane of light is diffraction-limited. On the other hand, in the direction parallel to the incident plane, the propagation length of surface plasmons limits the longitudinal resolution (e.g., 3 μm for gold in air). Different groups, however, have addressed the issue of poor longitudinal resolution and proposed solutions leading to near diffraction-limited resolutions.25−28 In this work, we present a holographic setup for distortionfree simultaneous amplitude and phase SPR imaging (HoloSPRi). We built an inverted SPR microscope with a Mach− Zehnder interferometer placed in the detection-arm of the optical path. We can adopt this configuration because SPR excitation occurs only when the illuminating light is p-polarized, thus we can use the s-polarized component of light as a reference beam. This way, we have realized a compact setup that can be easily implemented using conventional microscopes and which, minimizing the optical-path-difference between the two beams, suppresses the vibration noise during image detection.29
■
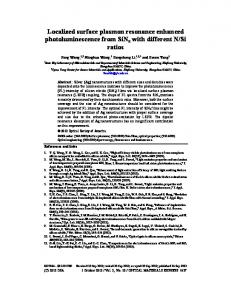
EXPERIMENTAL SECTION Setup. We designed the HoloSPRi microscope as an inverted microscope, see Figure1. A 633 nm He−Ne laser is
IH(x H , yH ) = |O0(x H , yH )|2 + |R 0|2 + O0*(x H , yH )R 0 + O0(x H , yH )R 0*
The first two terms represent the intensities of the reference and object waves, respectively. They do not provide spatial information about the object optical field and form the zeroorder term. The last two terms provide spatial frequency of the recorded hologram and are responsible for the virtual and real images, respectively. We reconstructed holograms by numerically propagating the optical field along the z direction using the angular spectrum method, which has a significant advantage in that it has no minimum reconstruction distance requirement. If E(x,y;0) is the wavefront at plane z = 0, the angular spectrum A(ξ,η;0) = F{E(x,y;0)} at this plane is obtained by taking the Fourier transform, where F{ } denotes the Fourier transform; ξ and η are the corresponding spatial frequencies of x and y directions, respectively; and z is the propagation direction of the object wave. The new angular spectrum A at plane z = d is calculated from A(ξ,η;0) as Figure 1. HoloSPR imaging setup: BS, beam splitter cube; PBS, polarizing beam splitter cube; λ/2, half-wave plate.
{
A(ξ , η ; d) = A(ξ , η ; 0) exp j
2πd λ
[1 − (λξ)2 − (λη)2 ]2
coupled into a single-mode optical fiber (core size c = 4 μm). The fiber output is collimated with a fiber collimator (OZ optics, fc = 18 mm) and then expanded using two plano-convex lenses (f1 = 100 mm and f 2 = 200 mm). The estimated divergence angle is DA = {(c/fc)( f1/f 2)} = 0.11 mrad. Light is converted to p-polarization by a linear polarizer. The beam
}
The reconstructed complex wavefront at plane z = d is found by taking the inverse Fourier transform as E(x , y ; d) = F −1{A(ξ , η ; d)} 4125
DOI: 10.1021/acs.analchem.5b00095 Anal. Chem. 2015, 87, 4124−4128
Technical Note
Analytical Chemistry where F−1{} denotes the inverse Fourier transform. The intensity image I(x,y;d) and phase image φ(x,y;d) are simultaneously obtained from a single digital hologram by calculating the square module of the amplitude and the argument of the reconstructed complex wavefront:
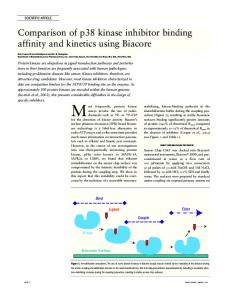
reconstruction returns an increase of 20% in the signal-tonoise ratio for HoloSPRi and a Speckle Index improvement of 39%, see the Supporting Information. Simultaneous Amplitude and Phase-Contrast SPR Imaging of Polymeric Patterns. SPR imaging can be useful when it comes to measure the thickness of a film on a surface. It has, in fact, a resolution in the axial direction of few nanometers, which it is helpful to reveal small features such as unevenness in flat surfaces or imperfections in a specific pattern. We used HoloSPRi to obtain simultaneous amplitude and phase contrast images of two polymeric patterns. The first pattern was made by domes of 10 μm diameter while the second one was made by a series of lines with a spacing of 10 μm, Figure 3a−d.
I(x , y ; d) = |E(x , y ; d)|2
⎛ Im[E(x , y ; d)] ⎞ ϕ(x , y ; d) = arctan⎜ ⎟ ⎝ Re[E(x , y ; d)] ⎠
The resolution of the reconstructed images from the angular spectrum method is the same as that in the hologram plane.30 We can assume that the reflectivity is 1 when the amplitude of object wave is a maximum so the reflectivity of amplitude r can be defined as the normalization of I(x,y:d).13 Sample Preparation. Standard 10 mm × 10 mm glass substrates have been cleaned in acetone and 5 min in an ultrasound bath. After that, they have been coated with gold 50 nm thin by means of magnetron sputtering, and then a positive photoresist (Microresist mp-1210) has been spin coated on the gold surface. Finally, conventional mask lithography has been used to pattern 10 μm wide lines and domes.
■
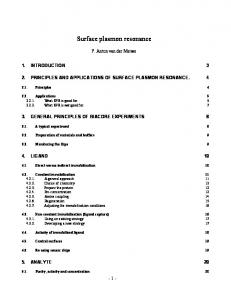
RESULTS AND DISCUSSION The setup uses an oil immersion objective having a NA of 1.49. Using this objective, when the incident light is shifted to the edge of the objective back aperture, it will reach the sample at an angle that is larger than the critical angle up to a nominal maximum angle of 79.6°. The large angle coverage allows adjusting the SPR excitation conditions to obtain the image contrast and sensitivity that best fits a wide range of samples. Comparison with Standard through-the-Objective SPRi. In order to evaluate the reliability of the amplitude contrast images obtained by numerical reconstruction, we compared them with conventional amplitude contrast SPR images (recorded turning off the reference beam) using Photoresist patterns on the gold surface as a sample, Figure 2a,b. The incident angle was fixed close to the SPR minimum angle of the air interface. The comparison of the intensity profiles in correspondence with the photoresist shows no significant differences between the two images proving, thus, the reliability of the numerical reconstruction, Figure 2c. Furthermore, the reduction of coherent noise in the
Figure 3. Digital holography allows simultaneous retrieval of amplitude and phase contrast images. Photoresist domes pattern: amplitude-contrast image (a) and phase-contrast image (b). Photoresist lines pattern: amplitude-contrast image (c) and phase-contrast image (d). Scale bar 10 μm.
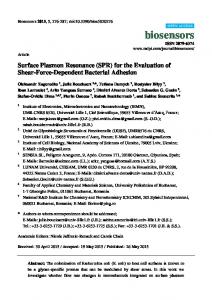
The patterns were realized by the interference lithography process of a photoresist polymer spun on a gold substrate. Not ideal conditions in the photolithographic process can give rise to irregularities in the pattern and the presence of local defects in the polymeric film. We took advantage of this to show how such irregularities can be clearly observed with SPR imaging and how amplitude and phase contrast images underline different features of the same sample. In Figure 3a,b, for example, the amplitude map shows with a good contrast a photoresist residue, between two domes at the center of the image, while the phase map emphasizes the imperfections at the top of the domes. It is worth noting, furthermore, that while the phase map in Figure 3d seems neater in comparison with the amplitude map in Figure 3c, it also shows three neat lines whereas in the latter there is no signal. This is due to an ambiguity in the SPR response, which can be mostly overcome, with a wise choice of the experimental conditions, by the simultaneous collection of amplitude and phase images obtained with HoloSPRi. The complementarity of information given by amplitude and phase in SPR imaging is not only limited to determining ambiguities in image interpretation but it extends further to sensitivity. In principle, then, it is possible to take advantage of this feature and to merge both amplitude and phase information to construct a synthetic 3D map with enhanced sensitivity. We report in Figure 4 the synthetic map of the same pattern previously shown in Figure 3a,b. The map was obtained
Figure 2. Amplitude reconstruction accurately matches the original image: (a) conventional SPR image of the photoresist pattern, (b) amplitude reconstruction, and (c) comparison between the intensity profiles of the two images in correspondence of the dashed line. Scale bar 10 μm. 4126
DOI: 10.1021/acs.analchem.5b00095 Anal. Chem. 2015, 87, 4124−4128
Technical Note
Analytical Chemistry
Figure 5. Evaporation of a DMEM droplet. Reconstructions of the amplitude and phase-contrast SPR images at T = 0 s, parts a and c, respectively, and T = 20 s, parts b and d, respectively. (e) Reflectivity and phase were calculated at the center of the droplet.
Figure 4. (a) Synthetic 3D map of photoresist lines obtained merging the amplitude and phase-contrast images in Figure 3a,b. (b) Plot of the profile at the center of the map (see red dashed line).
taking into the account that amplitude and phase images, see the Supporting Information. A profile obtained by profilometry measurements (Dektak XT 2011) of the photoresist lines was compared with a profile from an amplitude-contrast, phase-contrast, and synthetic map, respectively, see Figure S-2 in the Supporting Information. Correlation analysis and square-error-analysis are summarized in Table 1. They show a good fit between the two profiles and, by the way, a better agreement respect to the profiles calculated using only amplitude or phase data.
to obtain a qualitative behavior of concentration in time, see Figure 5e.
■
CONCLUSIONS The objective-based HoloSPRi technique offers the possibility of simultaneous detection of reflectivity and phase changes in SPR images. It extends, thus, the range of detectable samples and yields a higher throughput capacity with respect to both phase-contrast and amplitude-contrast imaging methods. In comparison with previous holographic SPR imaging techniques, it avoids geometrical aberrations and limitations due to the use of a prism. Finally, the employment of a configuration similar to the widely used objective-type TIR and the modular design keep it compatible with conventional microscopes, paving the way for an easy implementation with other optical techniques, from standard bright field microscopy to fluorescence.
Table 1. Estimation of the Verisimilitude of Three Profiles of Photoresist Lines Obtained by Figures 3a,b and 4a square error profile amplitude phase synthetic
correlation coefficient 0.83 0.47 0.94
mean 0.19 0.47 0.03
mode
max −9
2.53 × 10 9.06 × 10⁻⁷ 1.70 × 10⁻⁷
1.6 10 0.1
■
ASSOCIATED CONTENT
S Supporting Information *
a
Each of them is compared with the same profile measured by profilometry.
Additional information as noted in text. This material is available free of charge via the Internet at http://pubs.acs.org. W Web-Enhanced Feature *
A movie of reconstructed amplitude-contrast SPR images is available in the online version of the paper.
Kinetic Measurements of Droplet Evaporation. Simultaneous acquisition of amplitude and phase contrast images can be useful also in kinetic measurements. We have monitored, then, the evaporation of a drop of DMEM (Dulbecco’s Modified Eagle Medium) in real time. The droplet was deposited on the surface of a gold-coated coverslip illuminated at an incident angle of about 60 deg and a series of holograms of the evaporating droplet were taken every 0.42 s. The reconstructed amplitude-contrast SPR images are shown in the movie, and Figure 5a−d shows the amplitude and phase reconstructions at the beginning and the end of measurements. The refractive index of a solution approximately shows a linear behavior with concentration. While evaporation takes place, the solute concentration rises, producing an increase of the refractive index. This increase can be detected by SPR imaging
■
AUTHOR INFORMATION
Corresponding Author
*E-mail:
[email protected]. Notes
The authors declare no competing financial interest.
■ ■
ACKNOWLEDGMENTS This work was supported by Progetto “Smart Cities”− AquaSystem: Grant PON04a2. REFERENCES
(1) Rothenhäusler, B.; Knoll, W. Nature 1988, 339, 186−186.
4127
DOI: 10.1021/acs.analchem.5b00095 Anal. Chem. 2015, 87, 4124−4128
Technical Note
Analytical Chemistry (2) Nelson, B. P.; Grimsrud, T. E.; Liles, M. R.; Goodman, R. M.; Corn, R. M. Anal. Chem. 2001, 73, 1−7. (3) Wolf, L. K.; Fullenkamp, D. E.; Georgiadis, R. M. J. Am. Chem. Soc. 2005, 127, 17453−17459. (4) Shumaker-Parry, J. S.; Zareie, M. H.; Aebersold, R.; Campbell, C. T. Anal. Chem. 2004, 76, 918−929. (5) Wong, C. L.; Olivo, M. Plasmonics 2014, 9, 809−824. (6) Yeatman, E.; Ash, E. A. Electron. Lett. 1987, 23, 1091−1092. (7) Jordan, C.; Frutos, A.; Thiel, A.; Corn, R. Anal. Chem. 1997, 69, 4939−4947. (8) Nelson, B. P.; Frutos, A. G.; Brockman, J. M.; Corn, R. M. Anal. Chem. 1999, 71, 3928−3934. (9) Kabashin, A.; Nikitin, P. Quantum Electron. 1997, 653, 653−655. (10) Ho, H. P.; Lam, W. W. Sens. Actuators, B: Chem. 2003, 96, 554− 559. (11) Su, Y. D.; Chen, S. J.; Yeh, T. L. Opt. Lett. 2005, 30, 1488−1490. (12) Xinglong, Y.; Dingxin, W.; Xing, W.; Xiang, D.; Wei, L.; Xinsheng, Z. Sens. Actuators, B: Chem. 2005, 108, 765−771. (13) Li, S.; Zhong, J. Biomed. Opt. Express 2012, 3, 3190−3202. (14) Xu, L.; Peng, X.; Miao, J.; Asundi, A. K. Appl. Opt. 2001, 40, 5046. (15) Kemper, B.; von Bally, G. Appl. Opt. 2008, 47, A52. (16) Kühn, J.; Montfort, F.; Colomb, T.; Rappaz, B.; Moratal, C.; Pavillon, N.; Marquet, P.; Depeursinge, C. Opt. Lett. 2009, 34, 653. (17) Cotte, Y.; Toy, F.; Jourdain, P.; Pavillon, N.; Boss, D.; Magistretti, P.; Marquet, P.; Depeursinge, C. Nat. Photon. 2013, 7, 113−117. (18) Bianco, V.; Merola, F.; Miccio, L.; Memmolo, P.; Gennari, O.; Paturzo, M.; Netti, P. A.; Ferraro, P. Lab Chip 2014, 14, 2499−2504. (19) Coppola, G.; Ferraro, P.; Iodice, M.; Nicola, S. De; Finizio, a; Grilli, S. Meas. Sci. Technol. 2004, 15, 529−539. (20) Ash, W.; Kim, M. Opt. Express 2008, 16, 9811−9820. (21) Calabuig, A.; Matrecano, M.; Paturzo, M.; Ferraro, P. Opt. Lett. 2014, 39, 2471−2474. (22) Hu, C.; Zhong, J.; Weng, J. J. Biomed. Opt. 2011, 15, 056015. (23) Laplatine, L.; Leroy, L.; Calemczuk, R.; Baganizi, D.; Marche, P. N.; Roupioz, Y.; Livache, T. Opt. Express 2014, 22, 22771. (24) Huang, B.; Yu, F.; Zare, R. N. Anal. Chem. 2007, 79, 2979− 2983. (25) Kano, H.; Knoll, W. Opt. Commun. 2000, 182, 11−15. (26) Somekh, M.; Stabler, G.; Liu, S.; Zhang, J.; See, C. Opt. Lett. 2009, 34, 3110−3112. (27) Berger, C. E. H.; Kooyman, R. P. H.; Greve, J. Rev. Sci. Instrum. 1994, 65, 2829. (28) Giebel, K.-F.; Bechinger, C.; Herminghaus, S.; Riedel, M.; Leiderer, P.; Weiland, U.; Bastmeyer, M. Biophys. J. 1999, 76, 509− 516. (29) Nikitin, P.; Grigorenko, A.; Beloglazov, A.; Valeiko, M.; Savchuk, A.; Savchuk, O.; Steiner, G.; Kuhne, C.; Huebner, A.; Salzer, R. Sens. Actuators, A: Phys. 2000, 85, 189−193. (30) Yu, L.; Kim, M. K. Opt. Lett. 2005, 30, 2092−2094.
4128
DOI: 10.1021/acs.analchem.5b00095 Anal. Chem. 2015, 87, 4124−4128