A neutron beam with an extremely sharp angular profile is ... Super Ultra-Small Angle Neutron Scattering (SUSANS) studies. ... Side faces of the reflector.
Volume 110, Number 3, May-June 2005
Journal of Research of the National Institute of Standards and Technology [J. Res. Natl. Inst. Stand. Technol. 110, 231-235 (2005)]
SUSANS With Polarized Neutrons
Volume 110 Apoorva G. Wagh and Veer Chand Rakhecha Solid State Physics Division, Bhabha Atomic Research Centre, Mumbai 400085, India Makus Strobl and Wolfgang Treimer Berlin Neutron Scattering Center, Hahn-Meitner-Institut, Glienicker Strasse 100, 14109 Berlin, Germany
1.
Number 3 Super Ultra-Small Angle Neutron Scattering (SUSANS) studies over wave vector transfers of 10–4 nm–1 to 10–3 nm–1 afford information on micrometer-size agglomerates in samples. Using a right-angled magnetic air prism, we have achieved a separation of ≈10 arcsec between ≈2 arcsec wide up- and downspin peaks of 0.54 nm neutrons. The SUSANS instrument has thus been equipped with the polarized neutron option. The samples are placed in a uniform vertical field of 8.8 × 10⁴ A/m (1.1 kOe). Several magnetic alloy ribbon samples broaden the up-spin neutron –3 peak significantly over the ±1.3 × 10 nm–1 range, while leaving the down-spin peak essentially unaltered. Fourier
Introduction and Discussion
May-June 2005 transforms of these SUSANS spectra corrected for the instrument resolution, yield micrometer-range pair distribution functions for up- and down-spin neutrons as well as the nuclear and magnetic scattering length density distributions in the samples. Key words: Bonse-Hart camera; magnetic agglomerates; polarized neutrons; USANS.
Accepted: August 11, 2005
Available online: http://www.nist.gov/jres
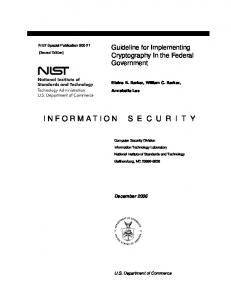
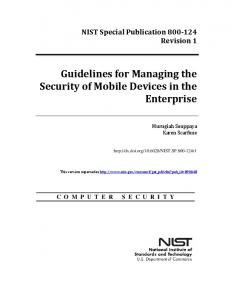
0.54 nm wavelength were subjected to 7 Ewald reflections each at the monochromator and analyzer channelcut silicon single crystals. Side faces of the reflector slabs were cut parallel to the exiting beams and covered with absorber Cd foils (Fig. 1) as prescribed by Wagh [2] to eliminate spurious tails in the reflectivity curve. In each crystal, a silicon prism was inserted after the third reflection (Fig. 1) to deflect neutrons by about 4 arcsec. Due to this shift between the triple and subsequent fourfold reflection patterns within each channel-cut crystal, the width of the rocking curve for the unpolarized beam (central peak in Fig. 3), obtained by rotating the analyzer crystal, reduced to nearly 2 arcsec [5]. Between the monochromator and analyzer, the horizontal neutron beam traversed a vertical magnetic field of 29 × 104 A/m (3.7 kOe) in a 2 cm high air gap between 2 cm × 20 cm rectangular poles of a C-shaped permanent magnet, at a small angle to the diagonal of the rectangle (Fig. 2). Neutrons were thus deflected by the “magnetic air prism” [6] of 90° apex angle. The magnet was fabricated by attaching 8 rare earth permanent magnet slabs (2 cm wide, 5 cm long
A neutron beam with an extremely sharp angular profile is required in Ultra-Small Angle Neutron Scattering (USANS) studies. Bonse and Hart [1] proposed multiple Bragg reflections from a channel-cut single crystal to obtain a beam with a nearly rectangular angular profile. The Bonse-Hart proposal was first realized in its totality with triple-triple Darwin reflections from optimally designed [2] monochromator and analyzer crystals to achieve the sharpest angular profile [3] for a neutron beam. This has paved the way for Super Ultra-Small Angle Neutron Scattering (SUSANS) studies. SANS experiments with polarized neutrons [4] have measured size distributions of magnetic nanoparticles in samples. Micrometer-sized magnetic agglomerates can be characterized with a polarized SUSANS facility. We present here the first polarized SUSANS instrument. The instrument has been set up at the V12b Double Crystal Diffractometer of the 10 MW reactor at the Hahn-Meitner-Institut in Berlin, Germany. Neutrons of 231
Volume 110, Number 3, May-June 2005
Journal of Research of the National Institute of Standards and Technology
Fig. 1. Si prism narrows reflectivity curve by a factor of 3.
Fig. 2. Magnetic prism separates up- and down-spin states.
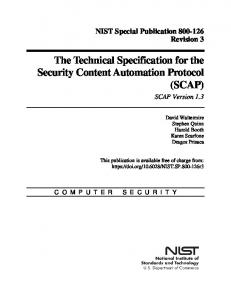
and 1.25 cm high, BHmax > 30 MGOe) each, just above the upper pole piece and just below the lower pole piece, within a magnet-grade soft iron “C”. The neutron angle of incidence to the magnet was optimized to achieve a separation of about 10 arcsec between the upand down-spin neutron peaks [7] and a neutron count rate of about 10/s at each peak position (Fig. 3) for a 10 mm wide and 20 mm high beam. A sample could be inserted in a holder, in a 8.8 × 10⁴ A/m (1.1 kOe) vertical magnetic field produced by a pair of ferrite magnets, placed between the magnetic prism and analyzer. The SUSANS instrument was thus equipped with the polarized neutron option. The neutron polarization attained here is ideal, since unlike other polarizers, a magnetic prism separates the two polarizations with 100 % efficiency and the spinflip probability for either state during its passage to the sample through air in the guide field is insignificantly small. Hence the polarization P and flipping efficiency ε can both [4] be safely equated to unity. We further have an advantage of recording SUSANS spectra for both the spin states side by side in a single rocking curve. This enables a direct comparison between the up- and down-spin spectra with no need for separate normalizations or for a spin-flip operation.
We illustrate the capability of the instrument with polarized SUSANS spectra of an as-cast Fe73Al5Ga2P8C5B4Si3 ribbon sample (Fig. 4). The rocking curve recorded without a sample, representing the instrument resolution, is also shown for comparison. The sample has broadened the up-spin peak (left) considerably, but has an insignificant effect on the downspin peak. This measurement needs to be combined with complementary techniques in order to characterize the distributions over shapes, sizes and orientations of nuclear and magnetic scattering structures in the sample. Proper Fourier transforms of scattering length distributions taking all these variations into account should then be used to analyze the polarized SUSANS spectra. However a flavor of the information obtainable can be provided even by simplistically assuming identical spherically symmetric nuclear and magnetic structures. The up- and down-spin SUSANS spectra corrected for the instrument resolution yield squares of the respective Fourier transforms, whose spherically symmetric inverse Fourier transforms help visualize the averaged spatial distributions, as outlined below.
232
Volume 110, Number 3, May-June 2005
Journal of Research of the National Institute of Standards and Technology The sum of convolutions of |Fu(Q)|2 and |Fd(Q)|2 with the respective fits to the instrument resolution, peaked at parameterized Q-centers, is least-square fitted (Fig. 5) to the sample SUSANS spectrum to extract ρu(r) and ρd(r). The nuclear and magnetic scattering length density distributions ρ N (r) and ρ M(r) then equal [4,8] half the sum and difference respectively between ρu(r) and ρd(r) (Fig. 6). The distributions extend upto a few micrometers, the up-spin distribution being narrower but stronger at r = 0 than that for the downspin, as expected from the SUSANS spectra. The average diameter deduced for the scattering “particle” is about 3 µm with the up- and 9 µm with the down-spin neutrons. Fig. 7 displays the scattering length densities over a shell of radius r. The magnetic shell density is narrower and weaker than the nuclear shell density. The fitted |F(Q)|2 distributions (Fig. 8) are inverse Fourier transformed [8] to obtain the respective pair distribution functions γ (r) (Fig. 9), which are wider than the respective ρ (r) curves. To recapitulate, the first polarized SUSANS instrument spanning Q > 10–4 nm–1 range and capable of characterizing micrometer-sized magnetic agglomerates in samples, has been commissioned.
Fig. 3. Up-down spin splitting with a magnetic prism.
We assume parameterized spherically symmetric scattering length distributions ρu(r) and ρd(r) of identical, spherically symmetric “particles” for up- and downspin neutrons respectively. Each Fourier transform F(Q) equals the volume integral [8] of the respective ρ (r)exp(– iQ ⋅ r), Q denoting the wave vector transfer.
Fig. 4. Polarized SUSANS for a magnetic sample.
233
Volume 110, Number 3, May-June 2005
Journal of Research of the National Institute of Standards and Technology
Fig. 5. Fitted up- and down-spin SUSANS spectra.
Fig. 6. Scattering length densities.
2 2 Fig. 8. |Fu(Q)| , |Fd(Q)| corrected for instrument resolution.
Fig. 7. Scattering length shell densities.
Fig. 9. Pair distribution functions.
234
Volume 110, Number 3, May-June 2005
Journal of Research of the National Institute of Standards and Technology Acknowledgments We thank S. Abbas for preparing schematic drawings (Figs. 1 and 2). We are grateful to S. C. Ojha’s team at BARC workshop for magnet fabrication, T. Nierhaus and A. Hilger for experimental assistance and G. Badurek and R. Sato Turtelli of Technical University of Wien, Austria for supplying magnetic alloy samples. One of us (AGW) acknowledges local hospitality received from BENSC, HMI during the experimental runs.
2.
References
[1] U. Bonse and M. Hart, Appl. Phys. Lett. 7, 238 (1965). [2] A. G. Wagh, Phys. Lett. A 121, 45 (1987); 123, 499 (1987). [3] A. G. Wagh, V. C. Rakhecha, and W. Treimer, Phys. Rev. Lett. 87, 125504 (2001); Appl. Phys. A 74 (Suppl.), S171 (2002). [4] See, e.g., A. Wiedenmann, J. Appl. Cryst. 33, 428 (2000). [5] W. Treimer, M. Strobl, and A. Hilger, Appl. Phys. A 74 (Suppl.), S191 (2002). [6] W. Just, C. S. Schneider, R. Ciszewski, and C. G. Shull, Phys. Rev. B 7, 4142 (1973). [7] A. G. Wagh, V. C. Rakhecha, M. Strobl, and W. Treimer, BENSC Experimental Reports 2002, HMI, Berlin (2003) p. 252. [8] S. K. Sinha, Introduction to Neutron and X-ray scattering, www.dep.anl.gov/nx/lectrnotes.pdf.
About the authors: Profs. A. G. Wagh and V. C. Rakhecha (retired) have scored several experimental firsts such as direct verification of Pauli anticommutation, separation of geometric and dynamical phases and observation of noncyclic interference amplitudes and phases. Prof. W. Treimer and Dr. M. Strobl are physicists at the University of Applied Sciences (TFH) and Hahn-Meither-Institute in Berlin.
235