Sustainability 2015, 7, 9293-9309; doi:10.3390/su7079293 OPEN ACCESS
sustainability ISSN 2071-1050 www.mdpi.com/journal/sustainability Article
Sustainable Consumption: Analysis of Consumers’ Perceptions about Using Private Brands in Food Retail Dan Boboc †, Adrian Laurentiu Ariciu † and Raluca Andreea Ion †,* Department of Agro-food and Environmental Economy, The Bucharest University of Economic Studies, 6 Piata Romana, Bucharest 010374, Romania; E-Mails:
[email protected] (D.B.);
[email protected] (A.L.A.) †
These authors contributed equally to this work.
* Author to whom correspondence should be addressed; E-Mail:
[email protected]; Tel.: +40-722-959-353. Academic Editor: Andrei Jean Vasile Received: 13 May 2015 / Accepted: 30 June 2015 / Published: 16 July 2015
Abstract: Private brands are representing an important vector for retailers, helping them to build sustainable relationships with their customers. Usually, private brands are perceived as products differentiated by lower prices. The purpose of this research is to identify consumers’ trust level in private brands used in food retail and their perceptions about the quality of retailers’ own products. The research question is: What are consumers’ perceptions about using private brands in food retail? Pursuing this question, a survey based on a questionnaire was carried out. Research findings showed that the main reason why people buy private brands’ products is lower price rather than high quality. The interviews showed that the typical private brand user is male, aged between 45 and 65 years old, with middle-level income, and employees with secondary education. These results are useful for retailers in their efforts to decide strategies for their private brands and for building consumers’ trust. The findings are useful for food producers as well, because they should reconsider their marketing strategies in order to adapt themselves to the continuous growth of retailers’ private brands. Keywords: private brands; food retail; survey; consumers’ trust
Sustainability 2015, 7
9294
1. Introduction This study tries to address the following question: What are the main factors explaining consumers’ choice of private brands vs. producers’ brands of foodstuffs? The ambition of this study is thus to enhance our understanding of the factors that are influencing the purchase of food private brands. This will help retailers and food producers in building marketing strategies. Sustainable consumption is closely linked to the term sustainable development. As such, it brings into discussion the three dimensions of the latter: social, economic, and ecological. As regards the economic aspect, sustainable consumption means, among other issues, that products will have lower prices and are affordable to consumers [1]. This could be achieved in the case of products sold under retailers’ brands, which are cheaper than products sold under producers’ brands. In a sustainable approach, consumption of private brands’ products reflects one of the principles of sustainable consumption: wise use of resources, including financial ones. This paper shows the development of private brands and their growth drivers, underlying the reasons why people buy products sold under retailers’ brands. Discount brands were introduced into American supermarkets in the late 1970s [2]. At that time, consumers’ perceptions about private brands were “a cheap and nasty generic substitute for the real thing, rolled out by retailers during recessions and discarded once the economy picked up again” [3]. Over time, consumers changed their view when high-quality private-label products were introduced in the late 1980s and early 1990s [4]. In Romania, private brands were introduced in modern trade channel in 1999, in Metro Cash & Carry and in Billa supermarkets. The period 2005–2008 was favorable to launch entry-level brands, consistent with a European trend clearly centered around 2005. Further on, the period 2009–2010 represented the start of quality brands’ launches: volume levels corresponding to the critical threshold began to appear, there were several categories of products where price ranges were sufficiently large to justify introduction of private labels at an intermediate level, and therefore a growing number of suppliers were able to consistently provide quality controlled to the own brand of quality level. All these happened in an unfavorable economic situation [5], which increased customer interest in products offering similar quality as the leading brands, but with lower prices. At the same time, existing international retailers on the Romanian market after 2007, when Romania joined the EU, brought new product lines under the umbrella of their private brands from Europe. This factor influenced local producers’ strategies, making them more open to developing private brands in different price tiers with retailers. The economic crisis starting in 2009 forced consumers to change their purchasing behavior towards discount brands, usually private ones. Thus, retailers took advantage and developed their businesses in this direction. Private brands sales increased year after year and reached 12% of retailers’ turnover in 2011 [6]. Retailers’ target for the future is that private brands sales reach 25% of turnover. Sales of private label products account for 14% of Romania’s retail market, higher by one percentage point compared to 2013 [7]. As a result of their introduction, the market responded to their lower prices and consumers started to buy private brands instead of producers’ brands. Worldwide, the phenomenon has been reported by producers arguing that “the private-label invasion was killing brand loyalty, so that they had to cut
Sustainability 2015, 7
9295
prices to compete” [3]. Some authors [8,9] observed that this reasoning was given by Philip Morris when they cut their price for Marlboro cigarettes, Procter & Gamble when they reduced the price of Pampers diapers by a quarter, and Kraft General Foods when they lowered cheese prices by 8%. Competition of private vs. producers’ brands has advantages for consumers because it triggers price battles between producers and retailers, resulting in low food prices. The research level conducted in recent years is trying to understand how private brands’ purchasing pattern has changed [10–15]. This can mainly be explained by the fact that private brands are occupying an emerging position in the global food market and in global purchasing processes. The number and the volume of private brands are expected to grow significantly. Many studies have also tried to find the most important motivations in purchasing private brands vs. producers’ brands. Batra (2000) [10] found that private brands purchases in a category increase when consumers perceive reduced consequences of making a mistake in brand choice in that category, and when that category has more “search” than “experience” characteristics. Garretson (2002) [16] found that both price and non-price related constructs are impacting both private label attitude and national brand promotion attitude, but the directionality and strength of several of these relationships differ. In regards to branding strategies, Choi (2006) [17] determined that when national brands are differentiated, a high-quality private label should position itself closer to a stronger national brand, and a low-quality private label should position itself closer to a weaker national brand. When the national brands are undifferentiated, the private label should differentiate itself from national brands. The literature is mainly based on survey methods. In this article, the results of a survey conducted in Bucharest in spring 2015 are analyzed. The aim of this study is to identify and analyze the process of purchasing private brands, in order to get a better picture of the complex factors involved. The originality of the paper consists in finding the relative importance of the variables that are influencing consumers’ behavior and motivations to buy private brands. The further significance of this study lies in retail market segmentation into private brands buyers and producers’ brands buyers. The practical implications consist in identifying retailers’ choices for appropriate product categories as they are developing private brands. Private brand marketing strategies in food retail should be designed in changing consumers’ perception of private brands products, from low-priced products to high-quality products. 2. Experimental Section The data used in this paper were obtained from a survey on consumer awareness and purchasing behavior with respect to private brands. The data were obtained from 292 interviews with consumers. The objective was to distinguish private brands buyers from producers’ brands buyers in food retail. Variables. The dependent variables considered are: purchase of private brands, type of private brands purchased, awareness of private brands, reasons for buying or not buying private brands, willingness to pay a higher price for private brands, consumers’ perceptions of buying private brands, and their considerations regarding the solutions for increasing consumers’ trust in private brands. The independent variable are: gender, age, income, and occupation. These have been considered as relevant in market segmentation into private and producers’ brands buyers. This hypothesis has been tested and presented in the final part of this article.
Sustainability 2015, 7
9296
Questionnaire. The questionnaire was developed and administered to 10 people. The feedback collected improved the quality of research by changing some of the questions, so they could be understood by all potential interviewees. The questionnaire includes information concerning consumer demographics, economic and occupation characteristics, brands purchasing, consumers’ attitudes towards private brands, the perceived importance of private brands, private brands awareness, and reasons for buying or not buying private brands. Data were collected using the Internet. Each of the questionnaires took about 10 minutes to be filled in. Sample. The interviews were conducted in spring 2015. The final sample consisted of 292 respondents. The database has been normalized as it respects the quotas of total population. The population studied in this piece of research is the population of Bucharest, the largest city in Romania, with 1,883,425 official inhabitants. The sample has been selected respecting the quotas of the total population: 49% male and 51% female; 17% people aged between 15 and 24 years, 43% people aged between 25 and 44 years, 24% people aged between 45 and 64 years, and 13% people aged over 65 years. This method is often used in surveys and it is known as the quotas method [18–20]. Most participants (40%) indicated a monthly income over 1500 lei, which is comparable with the mean income in Romania: 1500 lei, about 340 Euros [21]. Most respondents (66%) list their occupational status as employee. Research hypotheses and objectives. The survey started from the following hypotheses, which will be tested in the Discussions section: H1: About 70% of people bought private brands in the last three months. O1: Identify the number of private brands users. Based on this information, retailers develop marketing strategies. H2: The most popular private brands are in the food category, specifically basic food. O2: Identifying the types of products from private brands that are bought more often. Based on this information, retailers develop the marketing mix: product, price, promotion, and placement. H3: The best known private brand is K-classic (55% of respondents). O3: Private brand awareness. H4: People prefer the brand K-classic. O4: Identify people’s preferences for private brands. H5: Thirty percent of people did not buy private brands and 50%of non-buyers trust producers’ famous brands. O5: Identify the main reason why people do not buy private brands. H6: Lower price is the reason why people buy private brands and the main characteristic that differentiates private brands from producers’ brands. O6: Identify the reasons why people buy private brands and the main characteristics that differentiate them from producers’ brands. H7: Eighty percent of people have the willingness to pay higher prices if the quality of private brands’ products increases. The products for which people would pay more are sweets and dairy products. O7: Identify people’s willingness to pay more for private brands’ products with an improved level of quality and identification of these categories of products. Based on this information, retailers develop the product–price mix.
Sustainability 2015, 7
9297
P8: Fifty percent of people would pay a price 10%higher for improved private brands products. O8: Estimate the price level for improved private brands’ products quality. H9: Fifteen percent of people have higher expectations as regards products’ quality compared to what they have experienced. O9: Compare people’s expectations as regards products’ quality compared to what they have experienced after buying the private brands’ products. H10: The most significant action needed to increase consumers trust in a private brand is communicating certification and independent tests on products’ labels. O10: Rank the actions needed for increasing consumers’ trust in private brands. Transversal hypothesis: Consumers of private brands are women, 45–64 years old and low income. Transversal objective: Identify private brands consumers’ profile. 3. Results and Discussion 3.1. Data Analysis The independent variables considered in this piece of research are gender, age, income, and occupation. We expect that consumers’ patterns of purchasing change with respect to these variables. The sample respects the quotas of the total population, as seen in Tables 1–4. Almost 50% of respondents are male and 50% are female, close to the statistical data for the total population in Bucharest. Table 1. Sample structure by gender, compared to total population. Gender Variable Male Female
Total population Absolute (persons) Relative (%) 871,530 46.3 1,011,895 53.7
Sample Absolute (persons) Relative (%) 142 48.6 150 51.4
Source: own calculations based on statistical data (Statistical yearbook 2013) [22] and results of the questionnaire.
Table 2. Sample structure by age, compared to total population. Age Variable 15–24 years 25–44 years 45–65 years over 65 years
Total population Absolute Relative (%) (persons) 225,820 13.7 668,253 40.5 483,045 29.3 272,151 16.5
Sample Absolute (persons) 49 125 80 38
Relative (%) 17 43 27 13
Source: own calculations based on statistical data (Statistical yearbook 2013) [22] and results of the questionnaire.
The sample consists of 17%young people (ages between 15 and 24 years old), 43% people aged between 25 and 44 years old, 27% people aged between 45 and 65 years old, and 13% aged over 65 years old. As seen in Table 2, the quotas of the sample are close to the quotas of the total population.
Sustainability 2015, 7
9298
With regards to income (Table 3), the sample slightly differs compared to the total population. Statistics show that 15% of the population has an income under 160 euros, but 25% of respondents belong to this low-income category. These results have been achieved because the sample contains numerous young people, considering the sample structure by age (17% young people within the sample, compared to 13.7% of the statistical data), and young people have lower incomes. Table 3. Sample structure by income, compared to total population. Income Variable < 700 lei (under 160 euros) 700–1500 lei (160–340 euros) > 1500 lei (over 340 euros)
Total population Absolute Relative (persons) (%) 15 37 48
Sample Absolute Relative (persons) (%) 75 25.7 98 33.6 119 40.7
Source: own calculations based on statistical data (Statistical yearbook 2013) [22] and results of the questionnaire.
Finally, the sample structure by occupation (Table 4) shows similarities between the sample and total population and small differences only for entrepreneurs (1.2% of the total population compared to 4.5% of the sample). Table 4. Sample structure by occupation, compared to total population.
Variable employee with secondary education employee with higher education unemployed, students entrepreneur other
Occupation Total population Sample Absolute Relative Absolute Relative (persons) (%) (persons) (%) 112 67.3 66.10 81 15.5 45 15.4 1.2 13 4.5 16 41 14.0
Source: own calculations based on statistical data (Statistical yearbook 2013) [22] and results of the questionnaire.
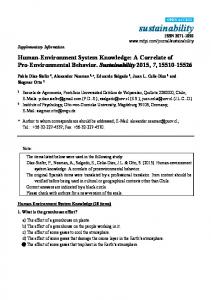
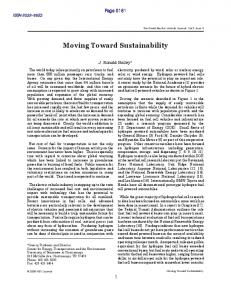
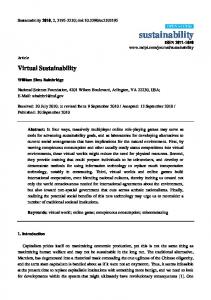
The first question aims to identify the number of private brands users and their profile. Seventy-six percent of people bought private brands in the last three months. As seen in Figure 1, men buy private brands more often than women. Their age is between 45 and 65 years old; they have middle level income and are employees with secondary education. People who do not buy private brands are over 65 years old, with no active occupation and low income. Age and occupation are the variables that divide markets into private brands users and non-users. Thus, 97% of people over 65 years old and 76% of unemployed people do not buy private brands. In return, 97% of people aged between 45 and 65 years old and 99% of employees with secondary education buy private brands. Income has a significant influence, as well: 94% of people with an income range in the middle level buy private brands, while 55% of people with low income do not buy them.
Sustainability 2015, 7
9299
100% 90% 80% 70% 60% no
50%
yes
40% 30% 20% 10%
hi g ith
ew
ot he r
r ne u pr e
en t re
,s
tu de nt s
tio n uc a un em pl
he r
ed
ed uc a y
on da r se c
pl oy e em
ew ith em pl oy e
oy ed
tio n
lei
le i
>1 50 0
70 015 00
le i
rs ye a 65
1 se em 50 co pl nd 0 oy l ar ei ee y w ed ith uc hi at io gh n er un ed em uc at pl io oy n ed ,s tu de nt s en t re pr en eu r em pl oy ee
1 50 0
00
le i 00 1 50 0
50 0
s
le i 70 01
1 5 s ec 00 em on lei pl da oy ry ee ed w u ith ca tio hi gh n er ed un uc em at io pl n oy ed ,s tu de nt s en tre pr en eu r
1 s 5 ec em 00 o nd pl le oy i ar y ee ed w uc ith a t hi io gh n er ed un u em ca tio pl n oy ed ,s tu de nt s en tre pr en eu r
em pl oy ee
w ith
70 015 00
le i 1
00 1 50 0
le i
70 015 00