Vol. 8, No. 2, 237-243, https://doi.org/10.12972/susb.20170021
INTERNATIONAL JOURNAL OF
SUSTAINABLE Building Technology and Urban Development pISSN 2093-761X ・ eISSN 2093-7628
Assessing sustainable urban densification using geographic information systems Natasha Cabrera-Jara, Daniel Orellana and M. Augusta Hermida* Universidad de Cuenca, Departamento de Espacio y Población, LlactaLAB – Ciudades Sustentables, Facultad de Arquitecturay Urbanismo, Cuenca, Ecuador *Corresponding author:
[email protected]
ABSTRACT Facing the expansive growth of cities and the wasteful consumption of resources, cities must be measured in its immense complexity, and its parts and layers must be observed so as to assess its ability to support such pressures. Cities should look at themselves and define how far away they are from a sustainable model, which means a greater sense of community, mixed uses, higher densities, better public space, higher quality of life, less energy consume, among others. This paper presents a toolbox for assessing sustainable urban densification using Geographic Information Systems (GIS). The toolbox uses spatial analysis and cartographic representation techniques to characterize and analyze the spatial distribution of a set of indicators using an orthogonal grid. The toolbox includes the automatic computation of 20 indicators of urban sustainability organized in four themes: compactness, diversity of uses, urban green, and socio-spatial integration. It also computes a Sustainable Urban Densification Index for each cell of the grid allowing to explore and discover spatial patterns of urban sustainability. The toolbox includes options for parameterization of both the indicators and the index, offering flexibility for adapting it to different realities and needs. These features allows the application of the toolbox for a wide variety of studies, such as comparative analysis of different cities or urban fabrics, monitoring of performance of urban policies, assessment of the impact of urban densification and urban sprawl, and future scenario evaluation. The toolbox is publicly available to researchers, practitioners, urban officials, technicians and students interested in urban sustainability. Keywords: urban sustainability; urban indicators; GIS; spatial analysis; assessment tools
Evaluation of Urban Fabric “Measure what is measurable, and make measurable what is not so” - Galileo Galilei The city is, among other definitions, a spatial and relational phenomenon, the most comprehensive work of human activity (Whitman cited in Chueca, 2011, p.19). It is a scene of life, so that understanding it means approaching its inhabitants. Therefore, the desire to study the city represents an act that involves tackling its immense complexity, observing its parts and abstracting the different layers that constitute it. La ciudad es esto (Hermida et al., 2015a) proposes a tool for measuring and comparing urban sustainability taking as a main issue housing densification and intensification of uses. Besides, this tool considers the different variables that affect urban life and mobility, green infrastructure and social cohesion (Hermida et al., 2015b, p. 29). Ⓒ International Journal of Sustainable Building Technology and Urban Development. This is an Open Access article distributed under the terms of the Creative Commons Attribution Non-Commercial License (http://creativecommons.org/licenses/by-nc/4.0) which permits unrestricted noncommercial use, distribution, and reproduction in any medium, provided the original work is properly cited.
238 ∙ International Journal of Sustainable Building Technology and Urban Development Vol. 8, No. 2, 2017
In fact, compact city is assumed as a sustainable urban model and densification as a key variable for analysis.
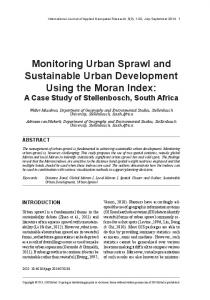
The Abstraction of the City Due to the expansive growth of cities and their wasteful consumption of resources it is necessary to measure their ability to face these pressures (Cabrera et al., 2015). The dispersed city has failed as urban model (Arbury, 2005) and its effects require a change of course. For this reason cities should look at themself to assess how much they have deviated from the compact model, which defends cities with a greater sense of community, mixed and walkable uses, higher densities, more space for its inhabitants and less for the car (Lehmann, 2010). It is necessary to measure how the city resembles the compact and diverse model and thus demonstrate urban sustainability (Rueda, 2008). With this in view techniques of spatial representation GIS (geographic information systems), that integrate mapping and information resources allowing the organization, storage, analysis and modeling of large amounts of geo-referenced data (Olaya, 2011) are used. Drawing on these data it is possible to create indicators represented in layers of geographic information that may overlap to measure urban sustainability addressing spatial heterogeneity. While GIS tools are useful and maps are essential to navigate and locate boundaries and landmarks, some representations are inefficient to visualize and communicate information as the visual impact of data displayed in a spatial way is influenced by the way space is divided (London Data Store, 2015). Irregular divisions of cartographic maps carry the “modifiable area unit problem” MAUP (Openshaw, 1981) due to the variability of spatial boundaries and the lack of a regular unit area which present spatial and statistical calculations (densities, proportions, etc.). To reduce the visual impact and to maintain possibilities of comparative analysis a regular grid is chosen. This divides the territory analyzed in uniform cells (Figure 1). The grid is dimensioned according to the average area of a city block and its cells contain at least 4 blocks. In the case of Cuenca-Ecuador, the cells are sized 200 m × 200 m (Hermida et al., 2015a, p. 35).
Figure 1. Division of the urban fabric through a square grid.
Indicators System The construction of this system uses at a starting point 52 indicators extracted from the indicator system for large and medium-sized cities (Agencia de Ecología Urbana de Barcelona & Red de Redes de Desarrollo Local Sostenible, 2009), and the environmental sustainability indicators plan of Seville (Rueda, 2008). From these studies
N. Cabrera-Jara et al. ∙ 239
20 indicators are proposed, which are adapted to the city of Cuenca and organized into four axes: 1) compactness, 2) diversity of uses, 3) urban green, and 4) socio-spatial integration (Table 1) (Hermida et al., 2015a, p. 36). The criteria for the selection and development of these indicators are based primarily on relevance, cost of production and information value. In this sense the existence of updated cadastral data to reduce the cost in obtaining information becomes fundamental. Table 1. Indicators system proposed Code Name
Description
Axis 1: Compactness 01
Urban housing density
Housing net density per hectare. It evidences consumption of residential land.
02
Inhabitants density
Inhabitants net density per hectare. It is complementary to the previous.
03
Absolute compactness
Building intensity, equivalent to building volume on a given surface.
04
Percentage of pedestrian road
Percentage of public road intended foot citizen.
05
Alternative transportation proximity
Percentage of population with access to three or more modes of transport other than the private car.
06
Pedestrian accessibility
Degree of accessibility on foot for the public road.
07
Percentage of closed condominium
Percentage of area destined to gated communities.
08
Empty lots area
Percentage of unused land or buildings on the block.
Axis 2: Diversity of uses 09
Urban complexity
Diversity and frequency of uses. It evidences the mixture of activities.
10
Ratio of activity and residence
Ratio of commerce activities and the amount of housing.
11
Daily commerce activities
Simultaneous coverage of day-to-day commerce activities.
12
Spatial and functional continuity of corridor
Street interaction in relation to percentage of pedestrian road and complexity of uses.
Axis 3: Urban green 13
Permeability of public land
Degree of permeability public land.
14
Green area per capita
Ratio of public green space and the number of inhabitants.
15
Volume of green in public space
Percentage of volume street occupied by vegetation.
16
Proximity to the nearest green area
Closeness of the population walk to the nearest green area.
17
Simultaneous proximity to three types of green areas
Closeness of the population walk to three types of green areas.
Axis 4: Socio-spatial integration 18
Provision of infrastructure
Simultaneous coverage of different types of infrastructure.
19
Percentage of households in narrow circumstances
Fraction of homes that are in conditions of deprivation.
20
Socio-spatial segregation
Percentage of low-income population, measured in quartiles.
A synthetic Index of Sustainability After the building of these 20 urban sustainability indicators, the Sustainable Urban Densification Index is proposed by obtaining four sub-indexes (Table 2). These in turn are built from 9 of the 20 indicators.
240 ∙ International Journal of Sustainable Building Technology and Urban Development Vol. 8, No. 2, 2017
Table 2. Sub-indexes for calculating the synthetic index Sub-index
Indicator
Optimum value
Housing and diversity of uses
Urban housing density
>40 dwellings/hectare
Urban complexity
>4
Pedestrian accessibility
Pedestrian accessibility
>75%
Alternative transportation proximity
100%
Urban green
Green area per capita
>15m2/inhabitant
Volume of green in public space
>30%
Simultaneous proximity to three types of green areas
100%
Percentage of households in narrow circumstances
0%
Socio-spatial segregation
0,76-1,25
Socio-spatial integration
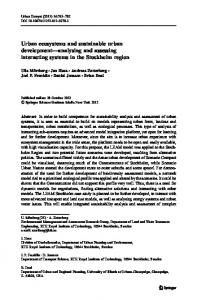
Figure 2. Spatial representation of indicators.
N. Cabrera-Jara et al. ∙ 241
The Sustainable Urban Densification Index represents the relative valuation of sustainability in terms of density and composition through the four sub-indexes, allowing a global reading and facilitating comparisons. Additionally, the results are normalized to values from zero to one, with zero being the lowest and 1 the highest value of sustainability (Hermida et al., 2015a, p. 123). The index and the values of these indicators are represented through the regular grid of 200×200 mm (Figure 2).
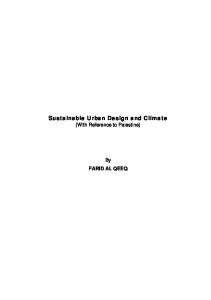
Automation The calculation of the indicators and the index is automated within GIS, using process flows that take data entry, stored inside geographic layers and Tables, perform spatial aggregation operations, overlay, execute statistical calculation and produce results which are referenced to each grid cell (Figure 3). A tool for calculating each indicator and a tool for calculating the Sustainable Urban Densification Index using ArcGIS 10.3 has been implemented. These tools are clustered in a “Toolbox” and can be executed through a friendly graphical user interface or through a command line that allows greater flexibility.
Figure 3. Schematic of process automation.
To use the tools, a data structure is required so the names and locations of the input files should be standardized according to a table in the Toolbox. Table 3 shows an example of the input data required for the calculation of an indicator. The files generated by each tool are automatically placed in a folder output structure depending on the indicator or index, which includes: a) the original files of each indicator; b) the intermediate files generated by geo-processes; and c) the final file that corresponds to the spatial representation of the values obtained for each indicator (Figure 4). To calculate the index, results of 9 indicators are required; therefore it is necessary to run the tools to calculate each indicator first. In order to facilitate the use of the Toolbox, each automation process is accompanied by a management protocol -a detailed explanation of each indicator and suggested representation ranges-.
242 ∙ International Journal of Sustainable Building Technology and Urban Development Vol. 8, No. 2, 2017
Table 3. Required information for calculating the indicator “Percentage of households in narrow circumstances” Indicator Percentage of households in narrow circumstances
List of data needed with the required name Malla_200×200.shp
Description Shape with the grid of 200x200m. Each cell must be assigned with a code.
Manzanas_Condiciones_Vida.shp Shape with blocks, whose attribute table contains the number of total dwellings and the number of dwellings in narrow circumstances, considering four elements: construction quality, access to public services, education and health services affiliation (Orellana & Osorio, 2014).
Figure 4. Organization of the information required for automation.
Conclusions This automation process by using geographic information systems, aims to facilitate the evaluation of urban sustainability in terms of densification in different cities, using the same methodology, which allows comparison between different cities or different areas within the same city. The most important requirement of the proposed approach is the availability of the necessary input data, so the indicators intend -as far as possible- to use secondary sources available in local government, to avoid obtaining data in field. Therefore the result is partly dependent on the quality of information available, which is highly variable for Latin American cases. The proposed Toolbox has been developed in such a way that allows the parameterization of the calculations and representation ranges, enabling the adaptation of the optimum values for different assessment approaches. This feature makes it a useful tool for a well informed and evidence based debate about different ways of assessing the parameters that affect sustainability, especially in terms of densification. The Toolbox, a set of demonstration data, a tutorial and research documents are publicly available to all individuals and institutions. The next step in this line of work consists of the implementation of this tool in open source software as an effort to democratize access and use of information and public debate on the decision-making
N. Cabrera-Jara et al. ∙ 243
around our urban spaces.
References [1] Agencia de Ecología Urbana de Barcelona & Red de Redes de Desarrollo Local Sostenible. Sistema de indicadores y condicionantes para ciudades grandes y medianas. Barcelona: Gobierno de España. 2009. [2] J. Arbury, From urban sprawl to compact city. An analysis of urban growth management in Auckland. Auckland: University of Auckland. 2005. [3] N. Cabrera, D. Orellana, A. Hermida, and P. Osorio, Assessing the sustainability of urban density. Indicators in the case of Cuenca (Ecuador). Bitácora Urbano Territorial. 25(2), (2015), pp. 21-34. [4] F. Chueca, Breve historia del urbanismo. Madrid: Alianza. 2011. [5] A. Hermida, D. Orellana, N. Cabrera, P. Osorio, and C. Calle, La ciudad es esto. Medición y representación espacial para ciudades compactas sustentables. Cuenca: Universidad de Cuenca. 2015a. [6] A. Hermida, C. Hermida, N. Cabrera, and C. Calle, La densidad urbana como variable de análisis de la ciudad. El caso de Cuenca, Ecuador. Revista EURE. 41(124) (2015b), pp. 25-44. [7] S. Lehmann, Green Urbanism: Formulating a Series of Holistic Principles. SAPIENS 3(2). 2010. Retrieved from: https://sapiens.revues.org/1057 [8] London Data Store. London Squared Map. After the flood. 2015. Retrieved from: http://aftertheflood.co/projects/ london-squared-map [9] V. Olaya, Sistemas de Información Geográfica. 2011. Retrieved from: ftp://ftp.ehu.es/cidira/profs/iipbaiza/ Libro_SIG.pdf [10] S. Openshaw, The modifiable area unit problem. Quantitative geography a British view. 35 (1981), pp. 60-70. [11] D. Orellana and P. Osorio, Segregación socio-espacial urbana en Cuenca, Ecuador. Analitika, Revista de Análisis Estadístico. 8(2) (2014), pp. 27-38. [12] S. Rueda, (ed.) Plan Especial de Indicadores de Sustentabilidad Ambiental de la Actividad Urbanística de Sevilla. 2008. Retrieved from: http://www.upv.es/contenidos/CAMUNISO/info/U0681581.pdf