Clive R. Bramham and Bolek Srebro. Department of Physiology ...... 29 Jones Leonard, B., McNaughton, B.L. and Barnes, C.A.,. Suppression of hippocampal ...
Brain Research, 493 (1989) 74-86
74
Elsevier BRE 14661
Synaptic plasticity in the hippocampus is modulated by behavioral state* Clive R. Bramham and Bolek Srebro Department of Physiology, University of Bergen, Bergen (Norway) (Accepted 10 January 1989)
Key words: Long-term potentiation; Long-term depression; Behavioral state; Sleep; Dentate gyrus; Perforant path; Freely moving rat
The possible influence of the sleep-waking cycle on evoked neurotransmission and on the induction of long-term potentiation (LTP) and depression (LTD) was studied in the perforant path-granule cell system. Freely moving rats received a high-frequency stimulus train (8 bursts at 400 Hz) during slow-wave sleep (SWS), rapid eye movement (REM) sleep, and a still-alert (SAL) behavioral state. Trains applied during SAL and REM reliably elicited LTP of the excitatory postsynaptic potential (EPSP) slope, population spike height, and spike onset latency. Granule cell excitability was also enhanced, as indicated by a leftward shift of the EPSP-population spike (E-S) relation. In contrast, tetanization in SWS rarely produced 'classical' LTP and often failed to elicit any lasting change in field potentials. Furthermore, the following types of E-S change occurred almost exclusively after tetanization in SWS: (1) LTP of the EPSP accompanied by depression of the population spike, and (2) E-S potentiation without a change in EPSP. When LTP occurred, however, its magnitude was independent of the animal's behavioral state at the time of the train. In agreement with previous reports, the efficacy of low-frequency neurotransmission varied with behavioral state. A modulation index (MI) was introduced to quantify the difference between field potentials evoked in SAL and SWS. Interestingly, both the occurrence and magnitude of LTP were related to the strength of the MI, as determined in each rat before the train. After trains, the state-dependent modulation of transmission was maintained and was superimposed on LTP and LTD. The results suggest that synaptic plasticity is dynamically modulated during the sleep-wakefulness cycle. INTRODUCTION Our understanding of the way by which neuronal systems influence, or are influenced by, the level of behavioral arousal in mammals has grown considerably over the past decade (see refs. 26, 44 for review). It is now clear, for example, that the firing activity of certain brainstem 7'27'28'37'55"57and cortical neurons 25,35'42'43'52"58 correlates with the specific sleep-waking activity (or behavioral state) of the experimental animal. In the hippocampal formation, studies in freely moving rats have shown that both spontaneous single-neuron activity 43'52, and field potentials evoked at the major synaptic junctions 2°" 33,59,60, change with behavioral state. Thus, Winson and Abzug 6° found that the magnitude of the population spike and excitatory postsynaptic potential (EPSP) elicited by low-frequency afferent stim-
ulation was different in each of 4 sleep-waking states, including: slow-wave sleep (SWS), rapid eye movment ( R E M ) sleep, a still-alert (SAL) state, and voluntary motion. However, just what role these changes in neurotransmission serve in processing information during a particular behavioral state, or in generating state-associated behavior, has not been determined. It is well established that hippocampal pathways display several forms of activity-dependent synaptic plasticity. The most notable of these is long-term potentiation (LTP), an enhancement of evoked synaptic transmission and neuronal excitability which can last for days or more in the chronic preparation, and is rapidly produced by a brief train of electrical stimuli applied to the afferent pathway 1°. Several properties of LTP make it an attractive model of neural ' m e m o r y ' or 'information'
* Preliminary accounts of this work have appeared elsewhere (refs. 15, 17). Correspondence: C.R. Bramham, Department of Physiology, University of Bergen, ,~rstadveien 19, N-5009 Bergen, Norway. 0006-8993/89/$03.50 © 1989 Elsevier Science Publishers B.V. (Biomedical Division)
75 storage in the cortex53. Since synaptic transmission is subject to statedependent modulation in the same circuits which show LTP, it naturally follows that LTP, another basic property of hippocampal pathways, may also be modulated by behavioral state. This raises the intriguing possibility that the capacity for long-term synaptic plasticity is not a fixed, static feature of hippocampal neurons but may be regulated in a meaningful way to suit the requirements of a particular behavior. Significant progress has been made in recent years in identifying and determining the mechanism of action of substances capable of modulating LTP (for review see ref. 12). Relatively less is known about the mechanisms underlying the behavioral modulation of neurotransmission in the hippocampus. In most of these studies, specific neurotransmitter systems were manipulated pharmacologically or by neurotoxic lesions. Emphasis has centered on the brainstem monoaminergic projections, as their firing activity tonically varies with the level of behavioral arousal 7'2s'37'55, and because they are implicated in high cognitive processes, including memory and learning 4'46. Interestingly, both field potential modulation and LTP induction appear to be influenced by noradrenergic and serotonergic inputs to the hippocampus arising in the locus coeruleus and median raphe nucleus, respectively. It has been reported that depletion of hippocampal noradrenaline 24 or serotonin 5° eliminates the difference between dentate field potentials evoked by perforant path stimulation during SWS and SAL. Likewise, results from anesthetized 11 and in vitro 51 preparations indicate that noradrenaline is necessary for the full expression of LTP in the dentate; although the force of these data are compromised by results suggesting that noradrenaline depletion may promote rather than impair LTP, in the unanesthetized rat 32'49. Evidence implicating serotonin in LTP ~1 has also been confounded by a conflicting report 51. In the present study using unrestrained rats, high-frequency stimulus trains were applied to the perforant path input to the dentate gyrus during SAL, SWS, and REM behavioral states. The results indicate that the induction of LTP and long-term depression (LTD) is strongly modulated by the animal's behavioral state.
MATERIALS AND METHODS Twenty-eight male MoI:SD rats (M011egaard Avlslaboratorium, Denmark) weighing between 250-350 g and ranging in age from 3 to 4 months were used as experimental subjects.
Surgery and electrophysiology Rats were anesthetized (chloral hydrate/pentobarbital) and prepared for chronic electrode implantation. Rectal temperature was kept at 37 + 0.5 °C by a servo-heating pad. Burr holes of 1.5 mm in diameter were drilled unilaterally at the following stereotaxic coordinates relative to bregma: A - P 4.0 and 7.9 ram, M - L 2.5 and 4.2 mm, for insertion of stimulation and recording electrodes, respectively. A concentric, bipolar stimulation electrode (SNEX 100; Rhodes Medical Instruments, Inc.) was placed in the angular bundle, and recording electrodes consisting of a pair of twisted, Teflon-insulated, stainless-steel wires (diameter 125/am, cut at right angles so that one tip projected about 200/am below the other) were slowly lowered into the hippocampus until stimulation evoked a maximal EPSP from the electrode in the dentate hilus, and the upper electrode recorded a corresponding negative-going synaptic response from the dentate molecular layer. The final depth of the stimulation electrode was adjusted to give a minimal current threshold for eliciting a population spike. Two stainless-steel jeweller's screws threaded into burr holes in the frontal bones served as a reference electrode and electrical ground. The stimulation and recording electrodes were cemented in position with dental acrylic, as was a connecting socket for the electrode pins. The signal from the hilar electrode was fed into a Grass E E G amplifier (model 7P5 AC pre-amplifier and 7DA driver amplifier; low and high one-half amplitude cut-off at 0.15 and 500 Hz), and the output passed into a Tektronix 468 Digital Storage Oscilloscope where the evoked field potentials were averaged, measured, and photographed. For continuous monitoring of the E E G , the hilar signal was also passed through a low-bandpass filter (0.15-75 Hz) and recorded on polygraph paper. The components of the field potential were measured as follows: the voltage of the population spike (spike height) from peak negativity to midway
76 between the first and second positive peaks; the voltage of the excitatory postsynaptic potential (referred to as EPSP slope) between two fixed latencies on the rising phase of the first positive wave; and the spike onset latency from the stimulus artifact to the first positive peak.
perforant pathway was given about 1 s after the end of the sensory stimulus in SAL. To avoid stimulating the perforant path during transitional stages of sleep, pulses were delivered at least 20 s after the onset of SWS and 10 s after R E M onset.
Experimental design Behavioral methods Animals had free access to food and water and were maintained in a temperature- and light-controlled room (23 + 0.5 °C, lights on 07.00 h-lights off 19.00 h) for at least 3 weeks prior to surgery. Experiments were carried out during all seasons of the year, and data were collected between 08.00 and 13.00 h. Rats were given at least 10 days to recover from surgery and were handled daily. Animals were individually housed in a wire mesh cage (36 cm square by 46 cm high) placed in a large, electrically shielded test chamber. When collecting data, the electrode socket on the rat's head was connected to the stimulation and recording equipment through a flexible, weight-counterbalanced cable attached to a mercury commutator. This arrangement allowed the rat to move around freely in its cage. To ensure adaptation to the testing environment, rats were moved to the test chamber 3 days before the experiment started and subjected to preliminary electrophysiological recordings. Behavioral states were defined on the basis of specific criteria for the animal's activity and hippocampal E E G (see Table I). Three states were recognized: a still-alert (SAL) state, slow-wave sleep (SWS), and rapid eye movement (REM) sleep. The behavior of the rat was continuously assessed by the experimenter, and in some cases video-monitored for further off-line analysis. E E G activity was simultaneously recorded at a paper speed of 10 mm/s and evaluated by the experimenter. The E E G records were manually scored after each day of testing. SAL was elicited by mild, non-noxious sensory stimuli (brushing cage wall; snapping of fingers; brief skin contacts; and gentle shaking of the cage), similar to those used by other investigators 8'6°. These stimuli were presented when rats were resting quietly or grooming; sleep was generally not disrupted. Data obtained during periods which failed to meet the criteria in Table I were eliminated from analysis. Electrical stimulation (test pulse or train) of the
The stability of field potentials was closely monitored on the first 3 days of testing to detect possible circadian and day-to-day drifts in amplitude. Averaged field potentials (8 pulses, 1 per 15 s) were collected in the SAL state every 15 min over a period of 5 h. In addition, every day a stimulus strengthresponse function (input-output or I-O curve) was established from averages taken in SAL and SWS at current intensities ranging from 30 to 600/tA. These I-O data were used to examine the influence of behavioral state on low-frequency evoked responses (also see section Data analysis). Plots of the EPSP slope against spike height (EPSP-spike (E-S) relation) were used as an indicator of granule cell excitability 5. The current intensity for test stimuli (biphasic, constant current pulses, half-width 150 kts), was chosen in each rat to evoke a small population spike (i.e. about 50 ~ A above population spike threshold). On days when trains were given, a TABLE I Criteria used to define behavioral state in the rat
Criteria for SWS and REM are based on detailed analyses by other investigators39'54'56.SWS is stage 3 or 4 (6-w~ve) sleep. State
Activity of rat
Hippocampal EEG
SAL
sitting or standing with head up, motionless, eyes fully open, (response to mild sensory stimulus e.g. tapping of cage)
low voltage, high-frequency irregular
SWS
lying down, motionless (postural shifts possible), eyes closed, slow and regular respiration
high voltage, irregular O-waves
lying down, completely relaxed with head down, eyes fully closed, occasional twitching of extremities and vibrissae, irregular respiration
intermediate voltage, rhythmic 0-waves
REM
(1-4 Hz) and occasional sharp waves
(5-8 Hz)
77 pre-train baseline level was estimated in the SAL state by measuring the components of an averaged field potential every 10 min over a period of at least 1 h. The mean of these values served as baseline amplitude. Data from animals whose response did not stabilize, or fluctuated beyond 10% of baseline, were discarded. A stimulus train was then applied to the perforant path (400 Hz, 8 bursts of 8 pulses, 10 s between bursts) in either SWS, or SAL, with the state of the animal during tetanization chosen at random. A train was given during the other behavioral state (SWS or SAL) on day 5, and in REM on day 6 (10 rats). Trains were only applied after the response changes (sometimes lasting days) produced in earlier sessions had returned to the original baseline level. It is important to point out that stimulus intensities used for tetanization were adjusted to evoke the same EPSP slope in all states. This was done because EPSP slope was found to be different in each behavioral state, and LTP magnitude is thought to be directly proportional to tetanus-induced, postsynaptic depolarization 16"22'3s. As a result, the stimulus intensity for trains given in SAL and SWS was about 100 and 300 /~A above spike threshold in SAL, respectively. Test stimulation was resumed in SAL after the train, and averaged potentials (4 sweeps) sampled at regular intervals for at least 70 min. Data for I-O curves were also collected during this period.
response averages collected between 10-70 min posttrain was used as a measure of LTP magnitude, and expressed in percent change from baseline. In each rat, an attempt was made to quantify the effect of behavioral state on neurotransmission. Differences between averaged field potential values obtained during SAL and SWS at each intensity of the I-O curve were used. First, the data for each response measure were normalized in relation to the maximum (or minimum for spike latency) value on the I-O curve. A modulation index (MI) score was then calculated for data pairs (SAL/SWS) on the I-O curve by the equation: MI --- State 1 - State2, where State 1 is the value obtained during the behavioral state predicted (on the basis of earlier reports 59'6°) to give a larger response than during the $2 state. From these scores the mean MI and maximum (max) MI value of the I-O curve was determined. The following statistical tests were applied: Student's t-test, two-way analysis of variance (ANOVA), X2 test, Pearson's rank correlation, Wiicoxon's matched-pair signed-rank test, and the Mann-Whitney U-test. After the experiments, a small electrolytic lesion was made at the tip of the recording electrode in 6 randomly selected animals. Histological analysis (Prussian blue-reacted iron deposits) located the recording site in the hilar region of area dentata in all cases.
Data analysis
RESULTS
Changes in field potentials after tetanization were classified as long-term potentiation (LTP), long-term depression (LTD), or no change (n.c.). The criterion for LTP and LTD of each response measure was a significant difference between its baseline value, and the mean of values obtained during the 10-70 min period posttrain (t-test correlated samples; P < 0.05; n = 7). This statistic gave criteria in percent change from baseline of about ___10% for the population spike height, EPSP slope, and E-S relation, and ___3% for the spike onset latency. In the case of the E-S relation, long-term effects (termed E-S LTP and LTD) were estimated as the percent change in spike height (8 sweeps) recorded 1 h after the train, after the stimulus strength was adjusted to return the EPSP slope to its baseline level. The mean of the
Stability and behavioral modulation or field potentials The stability test revealed no drifts in field potential measures sampled in SAL on the first 3 days of the experiment, suggesting that any circadian influence on neurotransmission is negligible during the first half of the light cycle. Fluctuations in spike height and EPSP slope were within 10% of their mean value for a given day. Large deviations in response amplitude (+40% of mean) occurred in two animals, apparently because the electrodes were loosely cemented to the skull. These animals were discarded from testing. Typical behavioral modulation of evoked field potentials, and the simultaneously recorded E E G , are illustrated in Fig. 1A,B. Two-way A N O V A
78
SAL
SWS
.
C
/-..
D
POPULATION SPIKE
\,..
,_
POPULATION EF~P 1.0-
6.
O8E
_ 0.6-
~"
n
2-
0 0
~ 0.4-
16o 2&
4bo
0.2
5OO
0
Stimulus intensity (pA)
E
SPIKE LATENCY
F
3.2.
SAL
EPSP-SPIKE RELATION 6-
mean h4I = 5.0
o SWS
o~ SWS
• SAL 0
3D-
o .
28"
/t
o, 2 . 6 -
O. ---r+
0
0.2 Stimulus intensity (IJA)
• SAL
2. •
2A
o
0
i 0.4
,
o'.6 ' da
,io
EPSP ornDlitu01e (mV)
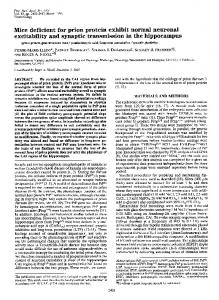
Fig. 1. A: typical EEG traces (10 s) recorded from the dentate hilus during SAL, SWS, and REM behavioral states. See Table I for electrographic criteria. B: corresponding dentate field potentials (mean of 8 sweeps) recorded from the same electrode and evoked by low-intensity stimulation (i.e. 50 HA above the population spike hreshold for SAL) of the perforant path. C-E: input-output curves collected in SAL and SWS illustrating significant behavioral modulation of all field potential measures (2-way ANOVA; P < 0.05). Values are means + S.E.M. (n = 8). The strength of the modulation effect is estimated by the mean MI. F: E-S plot showing the characteristic leftward shift during SWS.
demonstrated a significant difference between 1-O data collected in SAL and SWS. The EPSP slope was smaller, and the population spike was larger and occurred earlier when the rat was in SWS, as compared to the SAL state (P-values < 0.05). Perhaps the most striking effect of behavioral modulation was the leftward shift of the E-S plot during
SWS (Fig. 1F), implying a marked enhancement of granule cell excitability in this state. Field potential measurements taken during REM resulted in values intermediate to those of SAL and SWS (6 animals), although for practical reasons a detailed comparison was not made. The mean modulation index (MI) scores for I-O
79 curves collected on the first 3 days of testing suggested that the strength of modulation was stable within subjects. According to the way the MI was calculated for each response measure (see Materials and Methods), a positive value implies a smaller EPSP slope, larger spike height, and faster spike onset in SWS relative to SAL. Out of 24 animals, the percentage with a positive mean MI was 92% for the population spike height, 89% for the EPSP slope, and 88% for the spike latency. Curiously, one rat had a negative mean MI for all field response measures, implying a 'reversal' of the usual relationship between SWS and SAL. The reason for this anomaly was not determined. The group MI values for the pretrain period are given in Table IV. While the strength of the modulation effect on spike height and EPSP slope was about the same (group mean MI of 14.1 and 13.2, respectively), the effect on spike latency was significantly smaller (mean MI = 2.3; P < 0.001, t-test). Induction o f L T P and L T D
Stimulus trains did not arouse animals from sleep nor produce any other overt changes in behavior. The relationship between behavioral state at the time of tetanization and the probability of inducing long-term changes in field potentials is summarized in Table II. Trains given during the SAL and REM states were clearly more effective in producing LTP of the population spike height, spike onset latency, and E-S relation, than were trains applied in SWS (;(z > 5.99, df = 2, P < 0.05). A similar stateassociated effect on EPSP slope was observed, although this failed to reach statistical significance.
The percentage of animals exhibiting LTP of the various field potential measures ranged from 70 to 95% in the SAL and R E M groups, compared with only 5 to 45% in the SWS group. In fact, tetanization in SWS resulted equally often in no lasting change or long-term depression (LTD) of field potentials, as in LTE Further classification of the group data revealed the following state associated patterns between EPSP and population spike changes: (1) LTP of the EPSP slope tended to be accompanied by E-S potentiation in SAL (9/13), and by E-S depression in SWS (5/8); (2) cases of E-S potentiation in SWS were typified by LTP of the spike height without a change in EPSP slope (7/9); and (3) 30% (6/20) of rats receiving trains in SWS showed a complete 'LTP failure', with no lasting change in either response measure; no such LTP failures occurred in SAL (0/18). The behavioral state-dependency of LTP and LTD induction, implied by the above, was confirmed by a more detailed analysis of the within subject data (Figs. 2 and 3). It was found that a train resulting in no change or depression when given in SWS, could produce a robust LTP when delivered during the SAL and R E M states in the same rat (Fig. 2). To assess the replicability of the LTP failure effect in SWS, a train was reapplied in this state in four additional testing sessions (3 rats). While LTP failure occurred again, at least 1 of 4 trains successfully elicited LTP in each rat. Thus, even within individuals, the effect of tetani applied during SWS seems to be highly variable. Fig. 3 shows that the effect of high-frequency stimulation in SAL and R E M was
TABLE II Probability of inducing long-term changes in dentate field potentials during different behavioral states
Values give numbers of cases; n.c., no change (within predetermined significancelevels). Spike height* *
LTP LTD n.c. * P
5.99, df = 2, P < 0.05 (two-tailed).
80
similar in terms of the direction and magnitude of field potential changes. However, changes in spike height and latency in both states differed markedly from those of the SWS group (P < 0.05, Wilcoxon's matched-pair signed-rank test). It should also be pointed out that the outcome of tetanization in SWS and SAL did not appear to be influenced by the sequence of train delivery (day 4 vs 5). Thus prior tetanization in one state had no detectable effect on
A
sws 16o-
Train LTP
Rot no. 5 5
59
40
;
SPIKE H IGHT
o ci:r"
•• i• •
80-
,.
A
S A L Troin
N.C.
"
0 4
LTP/LTD induction in the other. Finally, we might add that LTP could be induced during an active state (cage exploration; n = 3), which like REM, is associated with '0' activity in the EEG.
--
__
•
•
•
•e
EPSP SLOPE
....... i
N.C.
1 LTP
", l!
1 EPSP SLOPE
!
•
2O
SPIKE LATENCY
"°1 o
• •e'°
;--.l'-Tf . . . . . . . .
,~"
.__
-10
••
LTD
4-
:
so
~ LTP 4
0J
.
--
~-
~ ......
°
i-"--.'-;
Doy4
~_-
0
40
80
sws
120
80
Troin
200
0
40
rirne(min)
•
SWS SAL
•
80
120
100 2 4 h t i
LTD
]
LTP • • ! I
gO
I
t'V
I!
-
'
SPIKE HEIGHT
O~ ~ J ' - ~ ' i . ~ r , , . . . . . . . . . ,oo 0
SWS SAL REM
R E M Troin
I
200
•
l•
SWS SAL REM
~--
B
B 400-
. . . . . . .
SPIKE L,~TENCY [ ~ y 5
-4-
-7
°
5"
40
80
';;:
120
180
-200 0
•
40
- -
SWS
. . . . 80
120
160
SAL
200
Time ( m i n )
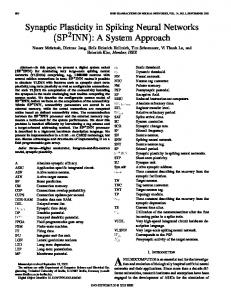
Fig. 2. Time course plots of averaged dentate field potential measures collected in the SAL state. High-frequency trains were delivered to the perforant path during SAL, SWS, or R E M at the time indicated by the arrow. In A, trains given in SAL elicited LTP of all field potential measures while trains applied during SWS (left panel), in the same rat, resulted in no significant change of the spike height and EPSP slope, and LTD of the spike onset latency. B: case in which trains evoked LTD in SWS and a large LTP in REM.
I
v
i
\ 1÷ /2mv
q
/-
4 ms
Fig. 3. A: changes in dentate field potential measures ofter tetanization in different behavioral states. Results from 3 representative animals are displayed. Histograms show means + S.E.M. of 7 response averages collected in the SAL state between 10 and 70 min posttrain. Significant differences between SWS vs SAL and R E M are indicated (**P < 0.05, *P < 0.10; t-test correlated samples). Note that the long-term effects of tetanization in R E M and SAL occur in parallel. B: corresponding traces of evoked potentials (average of 8 sweeps) collected at stimulus intensities used for tetanization in SWS and SAL. The EPSP slope was equalized by adjusting the current strength.
81 In addition to differences in the probability of inducing LTP, a possible state-associated effect on the m a g n i t u d e and decay of LTP was evaluated. It was found that when LTP occurred, its amplitude was i n d e p e n d e n t of the behavioral state at the time of tetanization (Table III). No conclusion could be m a d e regarding the kinetics of LTP decay, as the final descent to baseline was only m o n i t o r e d at infrequent intervals. It was noted, however, that regardless of the behavioral state in which LTP was induced, the percentage increase was above its h a l f - m a x i m u m a m p l i t u d e at 60 min, and always r e t u r n e d to the baseline level within 4 days of giving the train. The small n u m b e r of animals showing LTD p r e v e n t e d a detailed quantitative analysis of this p h e n o m e n o n . It was n o t e d that the depressed potential r e t u r n e d to the baseline level within 2 - 3 h, and r e m a i n e d at this level for the d u r a t i o n of testing. We emphasize, however, that in contrast to our previous results in anesthetized rats 16, this type of LTD was not associated with E E G changes (e.g. afterdischarges and spreading-depression).
120.~ 100-
• LTP
[] non -LTP
80..Q
60.,-; 4ocO}
~.
~ "~. ff'l
2o-
D O 0- b". . . . . . . . . . . . . . . . . i5 . . . . . . t~ . . . . . . . . . -20
, 0
1(3
'
,D 20
O '
3b
'
4b
Population spike max MI (pre-tmin) Fig. 4. Relationship between the (pretrain) strength of behavioral modulation and changes in spike height after tetanization in SWS. Note that rats with large pretrain modulation index (MI) values tend to demonstrate LTP. There is also a negative correlation between LTP magnitude and max MI (Pearson's rank correlation, P < 0.05). group, there was a negative correlation b e t w e e n the pretrain M I values for spike height and latency, vs the magnitude of LTP for the same response m e a sures ( P < 0.05, Pearson R a n k Correlation). T h e same negative correlation was f o u n d for spike height in the group tetanized in SWS (Fig. 4). N o significant correlations b e t w e e n m o d u l a t o r y strength and subsequent LTP magnitude occurred in the S A L group.
Effect o f field potential modulation strength on L T P Statistical analyses were p e r f o r m e d to d e t e r m i n e w h e t h e r or not t h e r e is a relationship b e t w e e n the strength of field potential m o d u l a t i o n , as estimated by the M I , and LTP. Rats demonstrating LTP after tetani in S W S h a d significantly larger pretrain M I values for spike height, than did those showing LTP failure or LTD ( P < 0.05, M a n n - W h i t n e y U-test; Fig. 4). By contrast, when these animals were in S A L , LTP was induced even when m o d u l a t i o n was weak. A s regards LTP magnitude, in the R E M
Effect o f tetanization on field potential modulation O u r e x p e r i m e n t a l design p e r m i t t e d us to assess possible effects of high-frequency tetanization of the perforant p a t h w a y on the b e h a v i o r a l m o d u l a t i o n of low-frequency neurotransmission. M I scores obtained before and after tetanization in SWS and S A L are p r e s e n t e d in Table IV. T h e m a i n finding was that the M I scores did not change after tetanization ( P > 0.05, t-test), w h e t h e r LTP occurred o r not. Thus the s t a t e - d e p e n d e n t m o d u l a t i o n of neurotransmission
TABLE III
Magnitude of long-term potentiation induced during different behavioral states Values give % change from baseline + S.E.M. There were no significant differences between groups (t-test independent samples; P > 0.05); n.d., not determined.
SWS
Spike height EPSP slope E-S Spike latency
SAL
REM
Mean
Max
Mean
Max
Mean
Max
58 + 40 23 ___13 54 + 40 -6.0 + 3.0
90 + 46 36 + 23 n.d. -6.1 + 0.5
62 + 49 31 ___15 47 + 28-5.1 + 3.3
87 + 66 41 + 16 n.d. -7.4 + 3.7
95 + 81 24 + 14 81 + 47 -5.9 + 3.3
122 + 98 34 + 17 n.d. -6.9 + 3.8
82
POPULATIONSPIKE
A ]
4t
Post
B
]
. . . .
E
POPULATIONEPSP Post sws SAL
¢ 2
®
T