Traffic Data Collection using Tire Pressure Monitoring System Nemanja Savić1, Marek Junghans1, Miloš Krstić2 1
DLR (German Aerospace Center), Berlin, Germany {nemanja.savic, marek.junghans}@dlr.de 2
IHP, Frankfurt (Oder), Germany
[email protected]
Abstract. In this paper we present initial results in utilization of TPMS (Tire Pressure Monitoring System) for collecting traffic data and deriving traffic information, i.e. travel times. The obtained results show that current detection ratio is less than 5 % and the obtained travel times are in consistency with referent data. The experiment is performed on DLR test track in Berlin. In particular, architecture of TPMS receiver is proposed. Next, the algorithm for reducing data redundancy and for deriving traffic information is introduced. Finally the obtained results are presented. Keywords: Tire pressure monitoring system, traffic data collection, travel time, traffic detection
1 Introduction Traffic and transportation management is of significant importance for ensuring and improving the mobility of the people in our cities. With this respect the most important issues are: efficiency, safety and environmental concerns. The process of collecting data from the traffic is the base for deriving traffic information, further processed to augmented traffic information and finally used for traffic control. However, there is a long-standing interest in developing novel technologies, which are able to provide higher quality traffic data with lower implementation and maintenance costs. Classical technologies applied for data collection are for instance: inductive loops, laser scanners, radars, etc. These technologies are not able to provide identification of the vehicles and thus cannot be used for deriving route based information, e.g. travel times, origin-destination (OD) matrices, routes, route paths, etc. To obtain such spatial information, other measuring principles and technologies are required, e.g. video based ANPR (Automatic Number Plate Recognition), RFID, Bluetooth and WiFi. ANPR and RFID provide direct identification of the vehicles while, on the other hand, Bluetooth and WiFi are used for indirect identification. ANPR systems adopt cameras that automatically detect the number plates of the
vehicles under different viewing angles. Currently, these systems achieve an accuracy of up to 98% [1, 2]. Direct detection technologies usually suffer from privacy concerns and they require specific hardware used only for detection purposes. Indirect detection relies on detecting devices that are not meant to be used for these purposes. These devices are equipped with a wireless communication protocol such as Bluetooth or WiFi which makes their detection and identification possible using a unique identifier, i.e. MAC address. Indirect detection based on Bluetooth and WiFi are described in [3] and [4], respectively. The base for indirect Bluetooth detection is large scale usage of smart phones, tablets, hands-free devices, etc., which can lead to equipment ratios of 20% to 40% [5]. Currently, the DLR is working on a novel approach for the mobile detection of Bluetooth and WiFi devices [6, 7], which combines the classical FCD (floating car data) and FCO (floating car observer) approaches. One of the technologies able to fill the gap between the direct and indirect principles is TPMS (Tire Pressure Monitoring System). We assume TPMS can provide direct detection based on wireless technology with the simplicity typical for indirect approaches. TPMS utilization for traffic data detection was first discussed in [8] and [9]. Until now, no practical results of deriving traffic information using TPMS have been published. In this paper, we will present our initial results in this field. Section 2 gives an overview of TPMS operation. The basic principles of the approach are given in Section 3. In Section 4 we explain the methodology used in our experiment which concerns the following: learning about TPMS sensors by performing reverse engineering, designing a receiver for TPMS signals and finally installing receivers on the gantries at the test track. The processing of the collected data is presented in Section 5. There, we provide a solution solution for the problem of data redundancy. Finally, in Section 6 the results of deriving travel times on a test track are given.
2 Tire Pressure Monitoring System (TPMS) TPMS is an electronic system used for measuring and monitoring air pressure inside pneumatic tires. Although safety concerns were the primary reason for the usage of TPMS, they can also improve the efficiency of fuel consumption and the lifetime of the tire. TPMS became mandatory for all new vehicles as of September 2007, while in the EU, all new models since November 2012 as well as all new vehicles from November 2014 must be equipped with TPMS [10]. The regulations in other countries South Korea, Russia, Indonesia, etc., will also request obligatory usage of TPMS in the future [10]. There are two principles of measuring tire pressure: indirect and direct. Indirect principle, iTPMS, derives pressure value using ABS sensors for angular speed of the wheel. As iTPMS does not perform any wireless activity, it cannot be used for collecting traffic data and thus will be not in the focus here. Direct TPMS, in the following text referred only as TPMS, use the sensors that are measuring absolute pressure and temperature values inside the tires. The operation of TPMS has already been described in [8, 10] and only brief description will be given here. The sensors are installed on the rim, usually inside the tire. The connection
between sensors and ECU (Electronic Controlling Unit) is established via receiving unit, using radio link. Sensors transmit their data periodically. The typical value of the transmission period is about 60s, but it can differ from manufacturer to manufacturer. TPMS intended for usage in the EU uses 434 MHz ISM band, while in the US, it is also allowed to use 315 MHz band. The data sent from sensors to the receiving unit is organized in frames. Every data frame consists of the following fields: preamble, sensor ID, pressure, temperature, status and error correction data. The receiving unit decodes messages sent from the sensors and provides corresponding information to the ECU, which informs the driver about the state of the pressure. The structure of TPMS is shown in Fig. 1.
Fig. 1. Structure of direct TPMS (modified from [10]).
3 Basic principles of traffic detection using TPMS TPMS based traffic data detection relies on receiving TPMS signals externally and using information about sensor ID as an identifier of the vehicles. This idea is described in [8], while the practical results on eavesdropping TPMS is presented in [12]. For deriving traffic information using TPMS we assume sensor ID is unique, and it can be used for vehicles identification. The assumption is based on the fact that sensor ID is 32-bit number, which allows 232 unique values. This value is much bigger than the number of produced vehicles in the in the period of the lifetime of the sensor which is usually reported as ten years. There are several benefits of using TPMS collecting traffic data. First, as stated earlier, TPMS usage will become mandatory for all new vehicles in the EU and many other countries in the near future, which means that no additional in-car hardware will be required. Second, the usage of TPMS is limited only to vehicles, and faulty detection of cyclists and pedestrians is not possible like with Bluetooth detection [13]. Third, weather conditions do not have negative influence on the detection as in ANPR technology. On the other hand there are several limitations of TPMS approach. First, the strength of the radiated signal is constrained by the strict EMC regulations. Second, there is no standard for communication between sensors and the receiving
unit which results in many different realizations of TPMS. The principle of TPMS detection is shown in Fig. 2.
Fig. 2. Traffic data detection using TPMS (modified from [8]).
4 Methodology In order to collect TPMS data from the traffic and use them for deriving traffic information, the following was done: • Analyzing TPMS sensor operation • Designing receiver of TPMS signals • Performing field test setup on the test track • Processing collected data Analyzing operation of TPMS sensors The operation of TPMS sensors is presented in [8]. However, we performed further investigations and gained additional information about various others TPMS sensors. Our investigations are based on reverse engineering of the sensors operation. The procedure consisted of recording raw signals transmitted by the sensors followed by post processing using DSP approach. The raw signal is first demodulated and the bits were extracted. Next, the utilized encoding scheme was determined. Since the ID of the sensor was known, the first step was to find ID field inside the frame. After extracting ID the byte boundaries are set and the rest of the bytes were extracted. The positions of other fields, such as, pressure, temperature and error correction code were extracted using brute force method. As a result the frame formats of seven different sensor types from three most dominant vendors on the market have been obtained. The sensor types are particularly selected for covering a significant number of vehicle models from different car manufacturers.
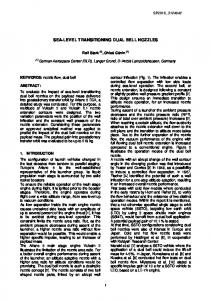
TPMS receiver Based on the analysis of the sensor’s operation, the prototype receiver of TPMS signals was designed. One of the main challenges here was performing simultaneous reception of signals from the different TPMS sensors. Rouf et.al [12] have shown that TPMS signals could be received from a static sensor at the distance of approximately 40 m, but also from the sensor in motion at the speed of 35 km/h. For designing the prototype, the software defined radio approach was chosen, meaning that high frequency radio signal is down converted to baseband in hardware and after digitization sent to general purpose computer, where demodulation, decoding, checking and extracting of the data are accomplished. This approach provides high flexibility and possibility to implement parallel processing chains for different sensor types without multiplication of hardware. For this purpose, USRP device from Ettus Research [14] was used as radio frontend, while the software is based on GNU Radio framework [15]. The block diagram of the receiver is shown in Fig. 3. As can be seen, there are two main processing paths based on modulation type. One processing path is used for sensors which utilize ASK modulation, while the other is used for FSK modulation.
Fig. 3. Structure of the prototype TPMS receiver [own work].
Our receiver is capable of receiving signals from seven different types of TPMS sensors and measured range is around 100 m when directional antenna is used. Upon correct signal reception, receiver ID, sensor ID, sensor type and time stamp are stored in a database for post-processing. Test setup The experiment for collecting TPMS frames from the traffic was conducted on the DLR test track in Berlin, called UTRaLab. The UTRaLab (Urban Traffic Research Laboratory) is located at Ernst-RuskaUfer, Berlin, Germany (Fig. 4). It has a length of about 1 km and is equipped with two gantries that have a distance of 850 m. These gantries provide sensors for overhead detection, e.g. cameras, laser scanners, and sensors for wireless communication
technologies, i.e. Bluetooth, WiFi and TPMS detectors. The loops are placed before and after each intersection to guarantee reliable measurements. Furthermore, the environmental sensors, e.g. visual-range meters, weather stations, ground sensor are also installed. The experiment consists of two prototype receivers placed on two gantries as shown in Fig. 4. In this setup we used directional Yagi antennas with the gain of 9 dBi. The antennas point towards the intersections in order to raise the number of detected sensor, due to the fact that many vehicles are forced to stop there. The intersections are located west of the west-bridge and east of the east-bridge, respectively, as in Fig. 4.
Fig. 4. Experimental setup at DLR test track in Berlin. The red triangles depict the antenna radiation patterns. [16]
TPMS data was collected over the course of three months, from February until May, 2014. Processing of collected TPMS data The data collected at the test track need to be processed in order to derive traffic information, such as for example travel time. The main issue in processing TPMS data is dealing with data redundancy. Namely, the data redundancy exists due to the fact that every vehicle is usually equipped with four TPMS sensors. This implies that the number of detected sensors can be up to four times higher than the actual number of the vehicles. We assume that such redundancy would not introduce a significant error if, for example, only travel times are required. For extracting precise OD and routes information, the tracking of the sensors is not enough, and the tracking of vehicle is required. For this purpose an algorithm able to discover a group of sensors which belong to the same vehicle was designed. This allows us to couple sensor information to the vehicle information and enables vehicle identification. The algorithm is based on calculating probabilities of detecting different sensors of the same type at the same time on the same place.
The procedure of processing the data consists of the following stages: grouping sensors from the same vehicle, assigning the group to a generated virtual vehicle ID, and, finally, deriving traffic information based on the information about detected vehicles. In the following section, the results of our experiment will be presented.
5 Results In our experiment, over the period of three months, around 11000 unique sensors IDs were collected. The main drawback in the evaluating obtained results is inability to estimate the total number of vehicles equipped with TPMS on the test track. As a consequence, we are not able to perform precise estimation of the efficiency of our receiver. The influence of sensor type on detection rate One of the first things we realized was the influence of sensor type on detectability of the sensor. The sensors can differ with respect to various parameters, but it is assumed that most dominant factors with respect to detection probability are: radiated power and message transmission period. Radiated power directly influences detection range, and test reports from different sensor types suggest that they radiate almost the same power. Transmission period specify how often sensors transmit their signal. The probability of signal reception rises with decreasing the value of transmission period. The contribution of every sensor type in the total amount of detected unique sensor IDs is shown in Table 1. Additionally, the available information about the number of models where sensor type was utilized, modulation, transmission period and radiated power is given. For confidentiality, sensor types are given generic names (A-G). Table 1. Amount of detected sensor types.
Sensor type
Number of models [17]
Modulation type
Measured peak power @3m [dbµV/m]
Transmission period [s]
In use since [17]
A B C D E F G
14 7 9 9 29 22 13
FSK FSK FSK FSK FSK ASK ASK
66.8 [17] 55.9 [17] 53.8 [17] 55.3 [17] 39.8 [17] 83.0 [17] N.A.
5 15 30 [17] 54 [17] 54 [17] 60 [17] N.A.
2004 2005 2010 2009 1999 2007 2005
Relative number of detections [%] 47.6 23.9 3.4 3.5 5.8 9.7 6.0
As can be seen from Table 1, sensor type A has the lowest transmission period and this type was 47 % of all detections, which shows very widespread use of this type. The capability of detecting types C and D is added later in the experiment to the
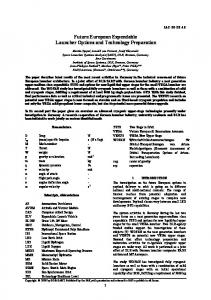
receiver’s chain and therefore the detection percentage is not giving the realistic figure of their application. If we take types A and B for example, they have been both in use since 2006 and they were utilized in 14 and 7 car models, respectively. The number of models implies that there should be twice as much vehicles equipped with type A than with type B. Traffic detection: TPMS vs. inductive loops As mentioned above, test track is equipped with inductive loops which can provide precise information about the number of vehicles in the range of TPMS detectors. Using this information detection ratio can be derived. Detection ratio is defined as the ratio of the number of detected vehicles and total number of vehicles.
Fig. 5. Number of detected vehicles on 10.04.2014 using TPMS (red bars) and inductive loops (blue bars), and detection ratio (black line), averaged over 15 minutes [own work].
The results of single day measurements are shown in Fig. 5. Detections from inductive loops (blue) and TPMS (red) are aggregated over 15 minutes and detection ratio derived (black). As can be seen, the detection ratio is less than 5 %. We assume that this number will gradually rise in the future as the effect of more pervasive use of TPMS in vehicles. However, according to [18, 19], with FCD/XFCD approach, equipment ratio of around 3 % is already enough to ensure good LoS (Level of Service) and traffic breakdown detection 10 minutes time interval. Deriving travel times using TPMS data Travel times are derived by calculating time difference between identification of the vehicle at one detector and re-identification at another detector. At one detector, vehicles are usually detected more than once due to the facts that there are four sensors per vehicle and because sensors can transmit a few frames per session.
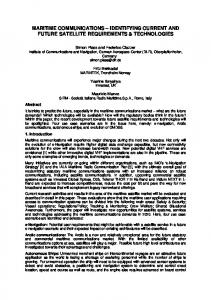
Having previous in mind, in order to minimize error in travel times for vehicles traveling from west to east, the last detection at west detector and the first detection at east detector are considered. The procedure is analogous for travel times from east to west. The obtained values are compared to the reference data. Reference travel times are derived by applying correlation method on inductive loops data. This method is described in [20]. The travel times are shown in Fig. 6. Due to the small sample size, travel times are aggregated in time intervals of 20 minutes and averaged over the period of 3 months.
Fig. 6. Travel times measured with TPMS (solid) and inductive loops (dashed) [own work].
As can be seen from Fig. 6, travel time derived with TPMS is very close to the reference value. Between midnight and 5 a.m. the number of vehicles on the test track is low thus some values from that interval are missing. If we compared derived values, the difference is usually between 5 s and 10 s. The afternoon peak around 4 p.m. is detectable with both technologies.
6 Conclusion and Future Prospects In this paper we presented the first experimental results of collecting traffic data using TPMS and deriving traffic information, i.e. travel times. The experiment is conducted using two TPMS detectors installed on two gantries on DLR test track in Berlin. For the purpose of experiment a prototype receiver of TPMS signals is designed, as well as the algorithm for processing collected data. The results of our first experiment show that current value of detection ratio using TPMS is less than 5 %. In the second experiment, travel times are calculated using TPMS data. The obtained results correspond to the large extent to the reference data. Regarding our future work, we will focus on deeper analysis on sensor types and their impact on detection ratio. Next, the receiver will be optimized in order to improve reception efficiency and sensor types will be added into receiving chain. Additionally, optimal position and antenna type of the receiver will be investigated.
References 1.
2.
3.
4.
5.
6.
7.
8.
9.
10. 11. 12.
13. 14. 15. 16. 17. 18.
19.
20.
Hsieh, C.-T.; Juan, Y.-S.; Hung, K.-M.: Multiple License Plate Detection for Complex Background. In Proceedings of the 19th International Conference on Advanced Information Networking and Applications, Vol. 2, pp. 389–392, 2005. Matas, J.; Zimmermann, K.: Unconstrained License Plate and Text Localization and Recognition. In 8th International IEEE Conference on Intelligent Transportation Systems, pp. 572– 577, Heidelberg, Germany, September 2005. Hoyer, R. and Leitzke C., Verfahrenstechnische Bedingungen für die Reisezeitbestimmung mittels Bluetooth-Technologie, Tagungsband HEUREKA '10, Editor Forschungsgesellschaft für Straßen- und Verkehrswesen, 2010. Luber, A., Junghans, M., Bauer, S., Schulz, J. (2011). On Measuring Traffic With Wi-Fi and Bluetooth. In Proceedings of 18th ITS World Congress, Orlando, Florida, USA, 16.20. October 2011. Spangler, M.; Leonhardt, A.; Busch, F.; Carstensen, C.; Zeh, T. (2010). Deriving travel times in road networks using Bluetooh-based vehicle re-identification: Experiences from Northern Bavaria, FOVUS - Networks for Mobility, ISBN: 978-3-00-031958-7, 2010. Ruppe, S., Junghans, M., Haberjahn, M., Troppenz, C. (2012) Augmenting the Floating Car Data Approach by Dynamic Indirect Traffic Detection. In Transport Research Arena – Europe, Athens, Greece, 2012 Gurczik, G., Junghans, M., Ruppe, S.. (2012). Conceptual Approach for Determining Penetration Rates for Dynamic Indirect Traffic Detection Based on Bluetooth. In Proceedings of the 19th ITS World Congress, Vienna, Austria, 2012. Krstic, Milos and Savic, Nemanja and Kraemer, Rolf and Junghans, Marek (2012) Applying Tire Pressure Monitoring Devices for Traffic Management Purposes. International Symposium on Signals, Systems and Electronics - ISSSE 2012, 03.10.2012 05.10.2012, Potsdam, Deutschland Schulz, Jan and Junghans, Marek (2012). Deployment of Tire Pressure Monitoring Systems for Traffic Monitoring And Safety Purposes. In Proceedings of 18th ITS World Congress, Orlando, Florida, USA, 16.-20. October 2011. Ute Hoppe, Ralf Kessler, Benjamin Müller, Markus Wagner. Reifendruckkontrollsysteme (2013). URL: TPMS mandatory in even more countries (2011), date of access: June 9, 2014. http://www.niradynamics.se/scripts/newsletter.php?id=55 Ishtiaq Roufa, R. M., Mustafaa, H., Travis Taylora, S. O., Xua, W., Gruteserb, M., Trappeb, W., & Seskarb, I. (2010, February). Security and privacy vulnerabilities of in-car wireless networks: A tire pressure monitoring system case study. In 19th USENIX Security Symposium, Washington DC (pp. 11-13). Cragg, Stephen. "BLUETOOTH DETECTION–CHEAP BUT CHALLENGING." (2012) URL: Ettus Research, LLC, date of access: June 9, 2014. www.ettus.com URL: GNURadio. date of access: June 9, 2014. www.gnuradio.org URL: Google. (2014). Google Maps, date of access: June 9, 2014. http://maps.google.de URL: Tecma. date of access: June 2014. http://www.tecma.de/tpms/ Breitenberger, S., Gruber, B., & Neuherz, M. (2004). Extended Floating Car Data-Potenziale fur die Verkehrsinformation und notwendige Durchdringungsraten. Straßenverkehrstechnik, 48(10), 522-531. Gössel, F.: "Informationsentropische, spektrale und statistische Untersuchungen fahrzeuggenerierter Verkehrsdaten unter besonderer Berücksichtigung der Auswertung und Dimensionierung von FCD-Systemen." Ph.D. Thesis, Dresden University of Technology, 2005. Unbehauen, Rolf. Systemtheorie 1: Allgemeine Grundlagen, Signale und lineare Systeme im Zeit-und Frequenzbereich. Mit 148 Aufgaben. Vol. 1. Oldenbourg Verlag, 2002.