Biogeosciences, 11, 5795–5808, 2014 www.biogeosciences.net/11/5795/2014/ doi:10.5194/bg-11-5795-2014 © Author(s) 2014. CC Attribution 3.0 License.
Taxon-specific responses of Southern Ocean diatoms to Fe enrichment revealed by synchrotron radiation FTIR microspectroscopy O. Sackett1,2,3 , L. Armand4 , J. Beardall2 , R. Hill5 , M. Doblin1 , C. Connelly6 , J. Howes1 , B. Stuart7 , P. Ralph1 , and P. Heraud2,3 1 Plant
Functional Biology and Climate Change Cluster (C3), University of Technology, Sydney, New South Wales, Australia 2 School of Biological Sciences, Monash University, Victoria, Australia 3 Centre for Biospectroscopy, School of Chemistry, Monash University, Victoria, Australia 4 Department of Biological Sciences and Climate Futures, Macquarie University, New South Wales, Australia 5 Centre for Marine Bio-Innovation, University of New South Wales, New South Wales, Australia 6 School of Life and Environmental Sciences, Deakin University, Victoria, Australia 7 School of Chemistry, University of Technology, Sydney, New South Wales, Australia Correspondence to: P. Heraud (
[email protected]) Received: 6 May 2014 – Published in Biogeosciences Discuss.: 21 May 2014 Revised: 11 September 2014 – Accepted: 15 September 2014 – Published: 20 October 2014
Abstract. Photosynthesis by marine diatoms contributes substantially to global biogeochemical cycling and ecosystem productivity. It is widely accepted that diatoms are extremely sensitive to changes in Fe availability, with numerous in situ experiments demonstrating rapid growth and increased export of elements (e.g. C, Si and Fe) from surface waters as a result of Fe addition. Less is known about the effects of Fe enrichment on the phenotypes of diatoms, such as associated changes in nutritional value – furthermore, data on taxon-specific responses are almost non-existent. Enhanced supply of nutrient-rich waters along the coast of the subantarctic Kerguelen Island provide a valuable opportunity to examine the responses of phytoplankton to natural Fe enrichment. Here we demonstrate the use of synchrotron radiation Fourier Transform Infrared (SR-FTIR) microspectroscopy to analyse changes in the macromolecular composition of diatoms collected along the coast and plateau of Kerguelen Island, Southern Ocean. SR-FTIR microspectroscopy enabled the analysis of individual diatom cells from mixed communities of field-collected samples, thereby providing insight into in situ taxon-specific responses in relation to changes in Fe availability. Phenotypic responses were taxon-specific in terms of intraspecific variability and changes in proteins,
amino acids, phosphorylated molecules, silicate/silicic acid and carbohydrates. In contrast to some previous studies, silicate/silicic acid levels increased under Fe enrichment, in conjunction with increases in carbohydrate stores. The highly abundant taxon Fragilariopsis kerguelensis displayed a higher level of phenotypic plasticity than Pseudo-nitzschia spp., while analysis of the data pooled across all measured taxa showed different patterns in macromolecular composition compared to those for individual taxon. This study demonstrates that taxon-specific responses to Fe enrichment may not always be accurately reflected by bulk community measurements, highlighting the need for further research into taxon-specific phenotypic responses of phytoplankton to environmental change.
1
Introduction
Growth of diatoms in the global ocean is estimated to contribute ∼ 20 % of the total primary productivity on Earth, thereby supporting substantial marine and terrestrial ecosystems, including fisheries which supply 15 % of the world’s animal protein for human consumption (Armbrust, 2009;
Published by Copernicus Publications on behalf of the European Geosciences Union.
5796
O. Sackett et al.: Taxon-specific responses of Southern Ocean diatoms
Mora et al., 2009; Nelson et al., 1995). As their frustules rain down to the deep ocean, diatoms export substantial quantities of C, Fe and Si from surface waters and determine the nutrient budget of the global ocean (Arrigo, 2005; Ingall et al., 2013; Le Quere et al., 2005). Diatoms are very sensitive to changes in Fe availability and rapidly form expansive blooms when the trace metal becomes available (Marchetti and Cassar, 2009). Fe limitation is known to cause changes in diatom morphology (such as reduced cell size), reduced photosynthetic efficiency, pigment levels and growth rates (Marchetti and Cassar, 2009). The critical role of diatoms in ocean biogeochemistry and ecosystem functioning merits further investigation of their phenotypic responses to environmental change. Naturally Fe-enriched water near the Kerguelen Island supports the largest annual phytoplankton bloom (45 000 km2 ) in the high-nutrient, low-chlorophyll Southern Ocean (Quéguiner et al., 2007). The natural phenomenon of Fe enrichment in this region presents a valuable opportunity to study the effects of Fe perturbations on diatom growth, productivity, community composition, biogeochemistry and carbon export (Blain et al., 2007). Little is currently known about the effects of Fe on the macromolecular composition (i.e. carbohydrates, lipids, proteins and nucleic acids) of diatoms. The macromolecular composition is an important component of the phenotype, determining energy and nutrient fluxes available for higher trophic levels and influencing cellular carbon productivity (Andersen et al., 2004; Kroon and Thoms, 2006; Sackett et al., 2013). Given the importance of diatoms to elemental cycling and marine ecosystem productivity, this study aimed to investigate the macromolecular responses of major groups of diatoms in waters near Kerguelen Island in relation to differences in Fe availability. Further, we demonstrate a novel, microspectroscopy-based approach to phenomics, a discipline that has been flagged as critical to enhancing our ability to untangle the complex interaction of genotype and environment, and allow us to predict phenotypic traits such as species fitness (Houle et al., 2010). Although it is generally accepted that the responses of phytoplankton communities to environmental factors vary between species, to date phenotypic (e.g. macromolecular, elemental and physiological) data from natural populations have been largely limited to bulk community or size fractionated measurements. The lack of taxon-specific macromolecular data relates to the large quantities of biomass generally required for biochemical analyses, difficulty sorting algal cells into taxonomic groupings, and to the time and financial costs associated with available measurement techniques. Recently however, elemental analysis of individual Southern Ocean phytoplankton cells using X-ray Fluorescence Microprobe Analysis has revealed species-specific changes in elemental composition with Fe availability (Twining et al., 2004a, b). Here we used synchrotron radiation Fourier Transform Infrared (SR-FTIR) microspectroscopy to analyse taxon-specific changes in macromolecular composition Biogeosciences, 11, 5795–5808, 2014
with Fe availability in individual diatom cells. SR-FTIR microspectroscopy is a powerful, non-invasive technique generating multivariate data on the total macromolecular composition of cells. The approach is growing in popularity among microbial ecologists and biomedical researchers (Murdock and Wetzel, 2009). The technique provides information on the macromolecular composition and physiological status of biological samples, without the need for lengthy extraction protocols because cells can be analysed non-invasively. The power of the technique relates not only to its high precision, but its ability to simultaneously provide information about the macromolecular composition and phenotypic parameters such as growth rate and phenotypic plasticity (Giordano et al., 2001; Heraud et al., 2007; Jebsen et al., 2012; Marchetti et al., 2010; Sackett et al., 2013). In addition, FTIR microspectroscopy has shown great promise as a tool for semiautomated taxonomic classification of microorganisms down to sub-species level (Domenighini and Giordano, 2009; Giordano et al., 2009; Naumann et al., 1991). Here we present the first published macromolecular data collected from individual phytoplankton cells from the Southern Ocean using SR-FTIR spectroscopy. Cells were analysed in hydrated form directly from sea water plankton haul samples, thereby minimizing artefacts related to sample preparation. The study aimed to measure phytoplankton macromolecular composition of cells of different taxa collected from stations with contrasting Fe levels. The macromolecular composition of individual cells from four dominant groups of phytoplankton (Fragilariopsis kerguelensis, Pseudo-nitzschia spp., Chaetoceros spp. and Eucampia antarctica v. antarctica) at four different sampling stations is compared (Table 1). The first two stations (E-1 and E-5) were sited within a complex recirculation system located in a stationary meander of the Polar Front, characterised by moderate phytoplankton biomass, moderate Fe levels and relatively low productivity and growth rates (S. Blain, I. Obernosterer, B. Quéguiner, T. Trull, this issue). The second two stations (E-4W and TEW-8) received Fe-rich waters from the Kerguelen Island and Plateau, resulting in high phytoplankton biomass, high productivity and growth rates (S. Blain, I. Obernosterer, B. Quéguiner, T. Trull, this issue). Additionally, the spectroscopic data were used to investigate the accuracy of the method for simultaneously classifying cells by taxa.
2 2.1
Materials and methods Sampling
Twenty phytoplankton net stations (Phytonet stations 7 to 27, excluding station 23) were sampled for the purpose of SRFTIR microspectroscopy analysis from October to December 2011 (S. Blain, I. Obernosterer, B. Quéguiner, T. Trull, this issue). A 35 µm meshed phytoplankton net was deployed www.biogeosciences.net/11/5795/2014/
O. Sackett et al.: Taxon-specific responses of Southern Ocean diatoms
5797
Table 1. Description of sampling stations and associated biogeochemical characteristics. Station
Dissolved Fe
Dissolve d Si (µmol L− )
POC (µM)
PBSi (µM)
BSi/POC (mol)
a, b 13C-POC
b Growth
(‰VPDB)
rate (%)
ProductivityEz (mg C m−2 d−1 )
E-1
not determined
∼ 15
0.57
0.36
0.63
+1.63
25
578
E-5
Moderate
∼ 10
0.44
0.28
0.63
+1.46
25
1064
E4-W TEW-8
Higher not determined Trull et al. (2014)
∼ 17 na
1.18 7.1
0.67 1.65
0.57 0.23
+2.83 +4.67
50 75
3287 No data
Closset et al. (2014)
Trull et al. (2014)
Trull et al. (2014)
Trull et al. (2014)
Trull et al. (2014)
Trull et al. (2014)
Jacquet et al. (2014)
Ref.
Notes Complex recirculation system located in a stationary meander of the Polar Front. Time series data. Receiving Plateau waters. Receiving Kerguelen Island waters. Blain et al. (2014a); Trull et al. (2014)
NB: values reported from Trull et al. (2014) are for size fraction 20 µm, which is composed of diatoms and other microalgae. a isotopic indices of growth rate, b increase relative to reference station, Ez euphotic zone, VPDB Vienna Pee Dee Belemnite standard. Abbreviations: Particulate Organic Carbon (POC), Particulate Biogenic Silicate (PBSi).
from the RV Marion Dufresne II to sample the top 100 m of the surface waters. Hauling speed was minimised to around 5 m mn−1 . 100 mL samples were taken from each station immediately after the haul and fixed with formaldehyde (1– 2 % final conc.). Fixed samples were kept at room temperature in the dark until analysis by SR-FTIR microspectroscopy. Comparison of FTIR spectra from fixed samples with those observed before from fresh microalgal samples did not show any pronounced differences. Additional 100 mL samples were preserved with Lugol’s iodine solution and analysed for diatom composition (Armand, unpublished). Taxonomic identification followed modern authority descriptions summarised in Hasle and Syvertsen (1997). 2.2 Microspectroscopy Four taxa were selected for analysis based on their abundance within the samples at each site. These were Fragilariopsis kerguelensis, Eucampia antarctica, Chaetoceros spp. (at stations E-1 and E-4W these were mostly C. decipiens, at TEW-8 these were mostly C. criophilus) and Pseudonitzschia spp. Cells were analysed in hydrated form within 1 µL of sea water pipetted directly onto the measurement substrate. A compression chamber with IR transparent calcium fluoride windows (0.5 mm thick) was used to hold each sample and prevent the sea water from evaporating prior to measurements being taken (Tobin et al., 2010). The use of the wet chamber meant that differences in the refractive index of the hydrated cells and the measurement medium (seawater) were less than would have been the case for dried cells in air resulting in much less light scattering effects on spectra (Bassan et al., 2009). Spectral data were collected on the Infrared Microspectroscopy Beamline (2BM1B) at the Australian Synchrotron, Melbourne, Australia in July 2013. Spectra were acquired over the measurement range 4000– 800 cm−1 with a Vertex 80v FTIR spectrometer (Bruker Optics, Ettlingen, Germany) coupled to an IR microscope (Hyperion 2000, Bruker) fitted with a mercury cadmium telluride detector cooled with liquid nitrogen. The microscope was connected to a computer-controlled microscope stage and www.biogeosciences.net/11/5795/2014/
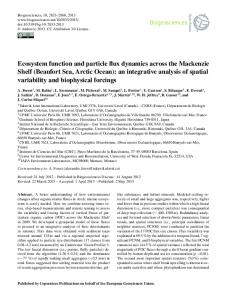
placed in a specially designed box purged with dehumidified air. The measurements were performed in transmission via the mapping mode, using an aperture size of 5 µm × 5 µm with a spectral resolution of 8 cm−1 , with 64 scans co-added. This aperture size, employed for all species, provided spectra that were unambiguously representative of individual cells (not clumps of cells; Fig. 1). The selected aperture size enabled targeting of the cell interior and avoidance of the cell edge which could cause pronounced light scattering. Additionally, maintaining a consistent aperture size avoided variations in signal-to-noise ratio throughout the experiment. Although the small aperture size did not cover the entire interior of the cell, we attempted to overcome heterogeneity across the cell by capturing large numbers of cells (20–50) and varying the measurement position across the cell in a random fashion. Further, a consistent aperture size helps to avoid variation in the signal-to-noise ratio. The number of co-added scans was chosen as a good compromise between achieving spectra with good signal-to-noise ratios and the rapid acquisition of data. Spectra were processed using Happ–Genzel appodization and two levels of zero-filling. Spectral acquisition and instrument control was performed using Opus 6.5 software (Bruker). 2.3
Multivariate modelling
A multivariate modelling approach was selected for data analysis for two reasons. Firstly, spectral data is inherently highly multivariate (containing thousands of variables) and therefore well suited to multivariate analysis. Secondly, the multivariate approach is more robust than univariate methods (such as comparison of peak-height/area ratios) because it detects co-variation across large numbers of variables and is less susceptible to experimental artefacts including baseline effects. SR-FTIR microspectroscopy is a semi-quantitative technique whereby changes in macromolecular absorbance are proportional to changes in the concentrations of those macromolecules. According to the Beer–Lambert law, absorbance is proportional to the path length through the sample and the concentration of light-absorbing molecules, as Biogeosciences, 11, 5795–5808, 2014
5798
O. Sackett et al.: Taxon-specific responses of Southern Ocean diatoms ness, minimise baseline differences and aid visual interpretation of spectra) (Heraud et al., 2005). Secondly, the Multiplicative Scattering Correction (MSC) function was applied to the data set for the purposes of reducing any remaining light scattering and to normalise the data. Data were initially screened for quality using Principal Component Analysis (PCA) to remove obvious outliers, prior to the calculation of average spectra and analysis by Partial Least Squares Discriminant Analysis (PLSDA) (Heraud et al., 2008; Sackett et al., 2013; Wold et al., 2001). Outliers were identified using the Leverage versus Residual Xvariance plots, with a threshold of 5 % set nominally. Models were validated using a set of samples not used to build the PLSDA model (i.e. a test set). The calibration and test sets were chosen by randomly assigning two-thirds and onethird of the samples to each, respectively. The classification accuracy of each model was compared using sensitivity and specificity metrics (Bylesjö et al., 2006).
Figure 1. Visible images of Chaetoceros spp. (a), F. kerguelensis (b) and E. antarctica (c) cells showing the infrared measurement positions (indicated by cross-hairs). The red square around the crosshairs indicates that the aperture size on the infrared microscope was set to 5 × 5 µm.
has been validated for diatoms and other microalgae (Heraud et al., 2007; Jungandreas et al., 2012; Wagner et al., 2010). Given that no independent data were available for the calibration of the SR-FTIR spectral data, we do not report changes in macromolecules in absolute units, however a doubling of absorbance at a particular wavenumber, for example, is indicative of a doubling in concentration of the macromolecules which absorb at those wavenumbers, given adherence to the Beer–Lambert law. The multivariate modelling approach (including pre-processing methods) described below allows for normalisation of differences in sample thickness, hence changes in the absorbance bands at particular wavenumbers indicate proportional changes in the concentration of the macromolecules associated with those wavenumbers (Heraud et al., 2005). SR-FTIR spectral data were exported from the OPUS 6.5 for multivariate analysis using The Unscrambler X v 10.3 (Camo Inc., Oslo, Norway). An initial quality control procedure was performed over the range 3000–950 cm−1 . Spectra with maximum absorbance greater than 0.85 (resulting from relatively thick regions of the sample) were excluded from further analyses. The regions 3050–2800, 1770–1730 and 1560–950 cm−1 were selected for analysis since they contain all the major biological bands, but avoided possible issues related to spurious absorbance values for the amide I band region (1730–1560 cm−1 ) due to the intense absorbance by water in this region (Vaccari et al., 2012). Firstly, data were smoothed (eight points either side) and second-derivative transformed (third-order polynomial) using the Savitzky– Golay function (to account for differences in samples thickBiogeosciences, 11, 5795–5808, 2014
3 3.1
Results Stations E-1 and E-5
Spectra were interpreted based on published literature for band assignments (Table 2). Visual inspection of the average second-derivative spectra showed bands characteristic of microalgal samples, with those in the lower region (1250– 1000 cm−1 ) dominating the spectra (Fig. 2). Differences in the height and position of the peaks indicated that the macromolecular composition varied between taxa. Cell spectra from sites E-1 and E-5 had the strongest absorbance by bands associated with proteins (1540 cm−1 ), lipids (3050– 2800 cm−1 , 1745 cm−1 and 1450 cm−1 ), phosphorylated molecules (∼ 1240 cm−1 ) and carbohydrates (∼ 1150 cm−1 ) compared to stations EW-4 and TEW-8 (Fig. 2a, b). At station E-1 (Fig. 2a), Pseudo-nitzschia spp. showed the highest absorbance by proteins and lipids and E. antarctica the lowest. Also at station E-1, F. kerguelensis cells had the highest absorbance by phosphorylated molecules, followed by E. antarctica, Pseudo-nitzschia spp. then Chaetoceros spp.; at station E-5 (Fig. 2b), Pseudo-nitzschia spp. and F. kerguelensis cells showed the highest absorbance by proteins and lipids, whereas E. antarctica had the lowest. Another notable feature of the cell spectra from station E-5 (Fig. 2c) was the relatively low variability in the region 3050–2800 cm−1 , as indicated by small error bars compared to cell spectra from the other stations. 3.2
Stations E-4W and TEW-8
Cells from stations E-4W and TEW-8 showed spectra with weaker absorbance from bands above 1250 cm−1 compared to those from stations E-1 and E-5 (Fig. 2c, d). As with the other stations, F. kerguelensis cell spectra showed the strongest absorbance by phosphorylated www.biogeosciences.net/11/5795/2014/
O. Sackett et al.: Taxon-specific responses of Southern Ocean diatoms
5799
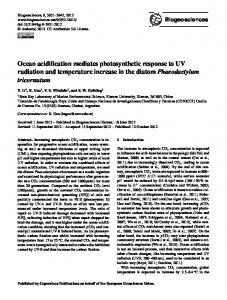
Figure 2. Average second-derivative cell spectra from four common genera: Chaetoceros, Eucampia, Fragilariopsis and Pseudo-nitzschia. Taxonomic abundance varied between stations hence there are no data for Chaetoceros spp. and Eucampia antarctica at station E-4W, or Chaetoceros spp. and Pseudo-nitzschia spp. at station TEW-8. Panels (a–d) show four different stations. Peaks show the macromolecular composition of cells which is dominated by phosphorylated molecules (1240 cm−1 ), carbohydrates (∼ 1150 cm−1 ) and silicate/silicic acid (1080 cm−1 ). Peaks found in the spectral region 3050–2800 cm−1 , ∼ 1735 cm−1 and ∼ 1450 cm−1 indicate the presence of lipids. Additionally, peaks at 1540 and 1515 cm−1 indicate the presence of proteins and the amino acid tyrosine, respectively. Error bars indicate one standard deviation from the mean. Note: the y-axis has been reversed to ease examination of the negative peaks (which are the relevant peaks after second-derivative transformation).
www.biogeosciences.net/11/5795/2014/
Biogeosciences, 11, 5795–5808, 2014
5800
O. Sackett et al.: Taxon-specific responses of Southern Ocean diatoms
Table 2. Band assignments Wavenumber (cm−1 )
a Assignment
Reference (and refs. therein)
1200–900 1080 1150 1230
ν(C–O–C) of polysaccharides, dominated by ring vibrations of carbohydrates ν(Si–O) from the silicate frustule ν(C–O) from carbohydrate moeities νas (P=O) from phosphorylated molecules (includes nucleic acids, phosphorylated proteins and phosphorylated lipids) Phenol group (ring vibration), possibly from Tyrosine νs (COO− ) carboxylate stretching mode, primarily from free amino acids δas (CH3 ) and δas (CH2 ) mainly from lipids and proteins δ(N–H) of amides associated with proteins ν(C=O) of ester functional groups, from lipids and fatty acids ν(C=O) of free fatty acids νs (C–H) from methylene (–CH2 ) groups, primarily from lipids νas (C–H) from methylene (CH2 ) groups, primarily from lipids νas (C–H) from methyl (CH3 ) groups, primarily from proteins ν(C–H) of cis-alkene –HC=CH–, from unsaturated fatty acids
Giordano et al. (2001); Naumann (2000) Giordano et al. (2001) Giordano et al. (2001); Heraud et al. (2007) Giordano et al. (2001)
1516 1400 1450 1540 1735 1708 2850 2920 2960 3015
Naumann (2000); Venyaminov and Kalnin (1990) Fraile et al. (2010) Heraud et al. (2005) Giordano et al. (2001); Heraud et al. (2007) Vongsvivut et al. (2012) Murdock and Wetzel (2009) Vongsvivut et al. (2012) Vongsvivut et al. (2012) Vongsvivut et al. (2012) Vongsvivut et al. (2012)
a g – asymmetric stretch; ν – symmetric stretch; δ – asymmetric deformation (bend); δ – symmetric deformation (bend). as s as s
molecules (∼ 1240 cm−1 ) and the weakest by silicate/silicic acid and carbohydrates (1160–1040 cm−1 ) relative to the other taxa. 3.3
Multivariate modelling and taxonomic classification
PLSDA is a multivariate modelling process enabling the modelling and classification of spectral data sets. In this study, PLSDA served to both validate the visual observations made from the average second-derivative spectra and to assess the power of SR-FTIR microspectroscopy to taxonomically classify cell spectra from the mixed, natural diatom communities. PLSDA scores plots showed distinct clustering of cell spectra by taxonomic grouping at all four sites (Fig. 3). PLSDA results supported observations made from average second-derivative spectra. For example, interpretation of the scores and corresponding loading weights plots showed strong peaks at ∼ 1240 cm−1 , indicating that F. kerguelensis cell spectra had the highest levels of phosphorylated molecules at all four sites. In addition, the PLSDA loading weights plots revealed a consistent anti-correlation between phosphorylated molecules and peaks corresponding to silicate/silicic acid and carbohydrates (bands at ∼ 1240 and 1080 cm−1 had opposite correlation indicated in all four loading weights plots). Classification of cell spectra by taxon using PLSDA demonstrated a high level of accuracy (Table 3), performing at >90 % specificity and sensitivity for all species at the single-cell level. Moreover, cell spectra clustered well by taxonomic group even after pooling the data across the four stations (Fig. 4), indicating that inter-species spectral variability was greater than the environmentally induced spectral variability.
Biogeosciences, 11, 5795–5808, 2014
3.4
Community averages compared to individual taxon
Changes in macromolecular composition for the four taxa pooled were compared to those for F. kerguelensis alone to see how well community average measurements reflected those of the dominant taxa (Fig. 5). Inspection of the average second-derivative spectra (Fig. 5a, d) showed that some trends observed for F. kerguelensis were reflected in the bulk averages; however, there were other notable differences in both peak position and intensity. Protein (1540 cm−1 ) and phosphorylated molecule (∼ 1240 cm−1 ) levels were lowest and silicate/silicic acid levels (∼ 1080 cm−1 ) were highest at site E-4W for both the pooled taxonomic group and for F. kerguelensis. However, stronger clustering occurred in the scores plots for stations E-4W and TEW-8 compared to E1 and E-5 for F. kerguelensis alone than for the pooled taxa (Fig. 5b, e). The loading weights plots (Fig. 5c, f) showed similar trends for both the pooled taxon and F. kerguelensis with regard to trends in protein, phosphorylated molecules, silicate/silicic acid and carbohydrate levels between sites. In spite of this, the contribution of phosphorylated molecules to variation between cell spectra was stronger for F. kerguelensis alone. The PLSDA by station for F. kerguelensis also served to examine the phenotypic plasticity of the species between stations (Fig. 5d–f). The degree to which models can discriminate between cell spectra from different stations is indicative of the magnitude of change in macromolecular composition of those cells (Sackett et al., 2013). Factors 1 and 3 of the score plots from PLSDA models explained 49 % of the variation in the spectral data set, with good clustering by station. Pseudo-nitzschia spp. did not show a similar pattern of clustering and model discrimination accuracy was poor (Fig. 6).
www.biogeosciences.net/11/5795/2014/
O. Sackett et al.: Taxon-specific responses of Southern Ocean diatoms
5801
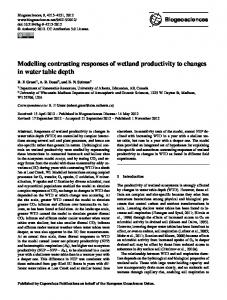
Figure 3. Taxonomic classification by PLSDA results for four common genera: Chaetoceros spp, Eucampia antarctica, Fragilariopsis kerguelensis andPseudo-nitzschia spp. Panels (a–h) show four different stations. Scatter plots on the left-hand side show scores and line plots on the right-hand side show the associated loading weights. The score plots indicate that the cell spectra cluster well by taxonomic grouping at each site. The loading-weight plots indicate that the source of the variation between cell spectra is largely from the lower wavenumber region (∼ 1240–1000 cm−1 ).
www.biogeosciences.net/11/5795/2014/
Biogeosciences, 11, 5795–5808, 2014
5802
O. Sackett et al.: Taxon-specific responses of Southern Ocean diatoms
Table 3. Taxonomic classification summary statistics for PLSDA models. Station
PLSDA model
E-1 E-1 E-1 E-1 E-1 TEW-8 TEW-8 TEW-8 E-4W E-4W E-4W E-5 E-5 E-5 E-5
Chaetoceros Eucampia Fragilariopsis Pseudo-nitzschia Total Eucampia Fragilariopsis Total Fragilariopsis Pseudo-nitzschia Total Eucampia Fragilariopsis Pseudo-nitzschia Total
n (cal)
n (val)
Factors
RMSEP
R square
Sensitivity
Specificity
3 15 48 28 94 3 26 29 34 36 71 13 58 14 85
0 2 35 12 54 2 17 19 15 30 45 7 32 9 48
3 3 3 3 3 4 4 4 1 1 1 5 5 5 5
0.131 0.284 0.256 0.229 – 0.175 0.175 – 0.264 0.264 – 0.251 0.225 0.272 –
0.067 0.088 0.735 0.719 – 0.674 0.674 – 0.713 0.713 – 0.494 0.763 0.470 –
0% 40 % 100 % 92 % 91 % 100 % 100 % 100 % 93 % 100 % 98 % 86 % 100 % 75 % 94 %
100 % 96 % 84 % 100 % 97 % 100 % 100 % 100 % 100 % 93 % 98 % 98 % 93 % 98 % 97 %
This indicated that F. kerguelensis demonstrated a higher level of phenotypic plasticity than did Pseudo-nitzschia spp. 4
Discussion
The taxon-specific analysis of F. kerguelensis cell spectra revealed that stations E-1 and E-5 demonstrated higher levels of intraspecific variability than stations E-4W and TEW8 (Fig. 5e). The sources of variation between cell spectra were multivariate, including most of the major macromolecular bands (proteins, phosphorylated molecules, amino acids, silicate/silicic acid and carbohydrates). Differences in variability were not observed when data were pooled across the four taxa, suggesting that community averages may not necessarily reflect the macromolecular composition of F. kerguelensis, despite its relatively high abundance within the assemblage. Although studies of intraspecific variability in microalgae are rare, higher levels of population variability have been previously reported for laboratory cultured microalgae under nutrient stress using SR-FTIR microspectroscopy (Heraud et al., 2008). Also, in a previous study of the Southern Ocean diatoms Fragilariopsis cylindrus, Chaetoceros simplex and Pseudo-nitzschia subcurvata, higher intraspecific variability was shown, particularly for F. cylindrus, under extreme salinity and temperature conditions (Sackett et al., 2013). Given that dissolved and particulate Fe levels appeared to be decreasing during the time series stations (indicated by a decrease from E-3 to E-5; Bowie et al., 2014), high intraspecific variability in F. kerguelensis could be indicative of a population in transition towards Fe limitation. Thus, the increased intraspecific variability may have been a sign that the population was in transition, relative to the Fe-enriched stations; however, further studies are required with controlled laboratory trials to confirm that the observed macromolecular changes were due solely to the influence of Fe supply. Biogeosciences, 11, 5795–5808, 2014
Based on the SR-FTIR spectra, levels of silicate/silicic acid were higher in F. kerguelensis cells from the Fe-enriched station (E-4W) compared to the moderate Fe station (E-5). This result contradicts some previous studies which have shown an opposite correlation between Fe availability and silicification (Marchetti and Cassar, 2009), but is not unprecedented. During the SOFeX experiment, Twining et al. (2004a) observed a 16 % increase in cellular Si after Fe addition for individual Fragilariopsis spp. cells, and Hoffmann et al. (2007) measured an increased ratio of biogenic silica (BSi) to particulate organic phosphate with bulk measurements of Fe-enriched Southern Ocean diatoms during the EIFEX project. At the Fe-enriched station (E-4W), the growth rate of the bulk population was substantially elevated compared to the moderate Fe station (E-5; Table 1). In their review of silicon metabolism in diatoms, Martin-Jézéquel et al. (2000) reported that the widely accepted inverse relationship between silicification and growth rate does not always hold, particularly when extracellular silicon is not limiting (MartinJézéquel et al., 2000). Thus, it is possible that Fe enrichment, in the presence of adequate ambient Si levels (Table 1), stimulated both high growth rate and high levels of biogenic silica. In conjunction with silicate/silicic acid, absorbance from phosphorylated molecules was also higher in cell spectra from the moderate-Fe station (E-5; Fig. 2a, b). This is interesting because a previous spectroscopic study found that absorbance from phosphorylated molecules was positively correlated with growth rate (Jebsen et al., 2012). Recently however, a proteomics study of acclimation to Felimited conditions in the diatom Thalassiosira pseudonana measured substantial up-regulation of proteins related to the pentose phosphate pathway and to amino acid biosynthesis/degradation pathways, including some specifically related to the amino acid tyrosine (Nunn et al., 2013). That
www.biogeosciences.net/11/5795/2014/
O. Sackett et al.: Taxon-specific responses of Southern Ocean diatoms
5803
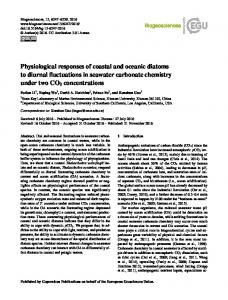
Figure 4. Classification of cell spectra by PLSDA with data pooled across stations. PLSDA score plot (a) shows clustering of cell spectra by taxon. PLSDA loading-weights plot (b) shows spectral bands which drive variation between cell spectra – primarily phosphorylated molecules (1230 cm−1 ), carbohydrates (1150 cm−1 ) and silicate/silicic acid (1080 cm−1 ).
study found proteins related to sucrose metabolism (including photosynthesis, oxidative phosphorylation and carbon fixation) that were unique to Fe-limited cultures and can therefore be considered indicative of Fe limitation. The upregulation of these proteins would be consistent with observations from cell spectra at the moderate Fe station (E-5) of increased absorbance from proteins, tyrosine and phosphorylated molecules relative to the Fe-enriched station (E-4W). BSi to particulate organic carbon (POC) ratios for the 20 µm size fraction of the phytoplankton community (which includes the diatoms F. kerguelensis, Chaetoceros spp. and E. antarctica, plus other species of microalgae) were found to be lower at stations E-4W and TEW-8 (0.57 and 0.23, respec-
www.biogeosciences.net/11/5795/2014/
tively) and higher at stations E-1 and E-5 (0.63 at stations E-5) (Trull et al., this issue). It may seem counter-intuitive that an increase in cellular Si levels could result in a decrease in the BSi / POC ratio; however, looking at the magnitude of difference in BSi and POC between stations shows that BSi increased by a factor of ∼ 4.5, whereas POC increased ∼ 12fold at TEW-8 compared to E-1 (Table 1). Thus, the drop in BSi / POC at the Fe-enriched station could be explained by increases in both the POC and BSi pools, with the increase in POC being ∼ 3 times that of BSi. Although diatoms were the dominant group within the 20 µm size fraction, it should be noted that a decrease in BSi from bulk measurements could have been contributed to by a shift from siliceous diatoms
Biogeosciences, 11, 5795–5808, 2014
5804
O. Sackett et al.: Taxon-specific responses of Southern Ocean diatoms
Figure 5. Variations in macromolecular composition for four taxon pooled (a–c) and separately for F. kerguelensis (d–f). Average secondderivative spectra (a and d) and loading-weight plots (c and f) indicate the source of the variation between the taxonomic groups, including strong bands related to phosphorylated molecules, silicate/silicic acid and carbohydrates (∼ 1240–1000 cm−1 ). Weaker contributions from lipids and proteins are indicated by the presence of bands at 1730 cm−1 and 1540 cm−1 , respectively. Score plots (b and e) show clustering by station and differences in intrapopulation variability.
Biogeosciences, 11, 5795–5808, 2014
www.biogeosciences.net/11/5795/2014/
O. Sackett et al.: Taxon-specific responses of Southern Ocean diatoms
5805
Figure 6. Average second-derivative spectra (a), PLSDA score plot (b) and PLSDA loading-weights plot for Pseudo-nitzschia spp. at stations E-1, E-5 and E-4W. Although the average second-derivative spectra show differences between treatments, intra- and interspecific variability are both high, resulting in weak clustering by station in the score plot. The loading-weights plot shows that variability between cell spectra is largely driven by protein levels (∼ 1540 cm−1 ), carbohydrates (1150 cm−1 ) and silicate/silicic acid (1080 cm−1 ).
to other, non-siliceous groups. Additionally, samples from the Fe-enriched stations were observed to have substantially higher carbon productivity, which could have led to increased concentrations of cellular carbon (Jacquet et al., this issue). If the decrease in BSi / POC was caused primarily by a large increase in cellular C concentrations, calculations of cellular C from cell volume may provide underestimates under Fe enrichment, because cell size is constrained by the frustule (Twining et al., 2004a). Such changes in cellular carbon and Si content are consistent with changes in macromolecular composition observed by SR-FTIR microspectroscopy. The PLSDA loading-weights plot for F. kerguelensis shows that cell spectra from station TEW-8 had the highest absorbance from silicate/silicic acid (∼ 1080 cm−1 ) and carbohydrates (∼ 1040 cm−1 ) among the four stations (Fig. 5f). Southern
www.biogeosciences.net/11/5795/2014/
Ocean diatoms have been observed to accumulate carbohydrates to a maximum in the evening, providing a source of carbon skeletons for protein production over night (van Oijen et al., 2004). Given that station TEW-8 was sampled at 10 pm (whereas the other three stations were sampled between 12:00 and 17:30 LT), it is possible that cellular carbohydrate levels were at a maximum at this time. Although carbohydrates contain a relatively lower proportion of carbon (gC / gDW) compared with lipids and proteins (∼ 0.4, ∼ 0.76 and ∼ 0.53, respectively), it is plausible that a substantial increase in carbohydrate storage levels could cause an increase in cellular carbon (Geider and La Roche, 2011). The pattern of changes in silicate/silicic acid and carbohydrate levels between stations was more complex for the pooled data set than for F. kerguelensis alone, indicating that community average measurements may not always reflect the
Biogeosciences, 11, 5795–5808, 2014
5806
O. Sackett et al.: Taxon-specific responses of Southern Ocean diatoms
composition of the dominant taxa, which can differ widely, and should therefore be interpreted cautiously. This study adds to the growing evidence that SR-FTIR microspectroscopy has great value as a tool for quantifying various traits (e.g. growth rate, nutrient status, nutritional value, taxonomic identification) in phytoplankton and other microorganisms (Heraud et al., 2005, 2007; Jebsen et al., 2012; Ngo-Thi et al., 2003; Sackett et al., 2013). Trait-based approaches are a powerful, relatively untapped resource for improving predictions of phytoplankton community composition and dynamics in response to environmental change (Litchman and Klausmeier, 2008). For example, phenotypic plasticity provides great potential for a species to cope with rapid and prolonged environmental changes (Charmantier et al., 2008). Accurate, taxon-specific models that describe a broad range of phenotypic parameters, referred to here as phenomic models, will enhance our ability to predict the response of the phytoplankton community to future climate scenarios. The power of these multivariate phenomic models depends largely on our ability to collect phenotypic data using high-throughput, robust and inexpensive techniques. Multivariate modelling approaches are recognised as integral tools for the analysis of ecophysiological traits (Litchman and Klausmeier, 2008). However, less attention has been paid to the power of multivariate measurement techniques, such as SR-FTIR microspectroscopy and X-ray Fluorescence Microprobe Analysis, for data collection. Encouraging the use of such multivariate measurement techniques, which can be used to predict multiple traits simultaneously, will dramatically increase the speed of trait data collection for microorganisms. Moreover, the advent of commercially available portable infrared and Raman spectrometers means that spectroscopic measurements can now be made in real time in the field.
in this paper would be limited by access to synchrotron facilities. However, burgeoning new technology in laboratorygrade instruments will soon make it possible to conduct measurements in single microalgal cells without the need for a synchrotron light source. For example, the newest focal plane array detectors have a higher magnification which allows infrared images to approach the spatial resolution possible using single-point mapping with an infrared microscope. Further, the advent of new extremely brilliant laboratory sources of IR light such as the quantum cascade laser are likely to further reduce the need for synchrotron sources in the future (Brandstetter et al., 2010). Taxon-specific data is in great demand from carbon cycle and ecosystem modellers, particularly for the Southern Ocean (Carr et al., 2006), and is necessary for advancing our ability to predict the effect of environmental changes, including climate change, on Earth’s marine and terrestrial ecosystems.
Acknowledgements. We thank Stephane Blain (Chief Scientist) and Bernard Queguiner (Voyage Leader) for inviting and supporting L. Armand’s and O. Sackett’s participation in the KEOPS2 programme. The captain of the RV Marion Dufresne II, Cmd. B. Lassiette, and his crew, and all scientific members of KEOPS2 community are acknowledged. L. Armand’s participation in KEOPS2 was supported by an Australian Antarctic Division grant (#3214). This research was undertaken on the infrared microscopy beamline at the Australian Synchrotron, Victoria, Australia with beamtime awarded on the basis of merit, as part of a peer-reviewed provision process. We thank beamline scientists, Mark Tobin and Keith Bambery, for their assistance with the synchrotron measurements. Edited by: B. Quéguiner
References 5
Conclusions
This study has demonstrated the taxon-specific responses of four dominant diatom taxa in association with natural Fe enrichment. These responses were not entirely reflected by the pooled data which were viewed as analogous to bulk community averages. Fragilariopsis kerguelensis showed distinct phenotypic differences (i.e. plasticity) at stations E-1 and E5 compared to stations E-4W and TEW-8, whereas Pseudonitzschia spp. did not (Figs. 5 and 6). Understanding differences between taxa is important for improving our ability to predict phytoplankton community composition and dynamics in response to environmental change (Arrigo, 2005). The current lack of taxon-specific data is related to methodological challenges that limit in situ studies to bulk-community measurements. Methods which permit the analysis of individual cells, such as SR-FTIR microspectroscopy, present a pathway for the collection of taxon-specific data to fill this gap. It is likely that the broad use of the approach outlined Biogeosciences, 11, 5795–5808, 2014
Andersen, T., Elser, J. J., and Hessen, D. O.: Stoichiometry and population dynamics, Ecol. Lett., 7, 884–900, 2004. Armbrust, E. V.: The life of diatoms in the world’s oceans, Nature, 459, 185–192, 2009. Arrigo, K. R.: Marine microorganisms and global nutrient cycles, Nature, 437, 349–355, 2005. Bassan, P., Byrne, H., Bonnier, F., Lee, J., Dumas, P., and Gardner, P.: Resonant Mie scattering in infrared spectroscopy of biological materials - understanding the “dispersion artefact,” Analyst, 134, 1586–1593, 2009. Blain, S., Obernosterer, I., Quéguiner, B., and Trull, T. W.: The natural iron fertilization experiment KEOPS 2 (KErguelen Ocean and Plateau compared Study 2): An overview, Biogeosciences, (KEOPS2 Special Issue), 2014a. Blain, S., Oriol, L., Capparos, J., Guéneuguès, A., and Obernosterer, I.: Distributions and stoichiometry of dissolved nitrogen and phosphorus in the iron fertilized region near Kerguelen (Southern Ocean), Biogeosciences, (KEOPS2 Special Issue), 2014b. Blain, S., Quéguiner, B., Armand, L., Belviso, S., Bombled, B., Bopp, L., Bowie, A., Brunet, C., Brussaard, C., Carlotti, F.,
www.biogeosciences.net/11/5795/2014/
O. Sackett et al.: Taxon-specific responses of Southern Ocean diatoms Christaki, U., Corbière, A., Durand, I., Ebersbach, F., Fuda, J.L., Garcia, N., Gerringa, L., Griffiths, B., Guigue, C., Guillerm, C., Jacquet, S., Jeandel, C., Laan, P., Lefèvre, D., Lo Monaco, C., Malits, A., Mosseri, J., Obernosterer, I., Park, Y.-H., Picheral, M., Pondaven, P., Remenyi, T., Sandroni, V., Sarthou, G., Savoye, N., Scouarnec, L., Souhaut, M., Thuiller, D., Timmermans, K., Trull, T., Uitz, J., van Beek, P., Veldhuis, M., Vincent, D., Viollier, E., Vong, L., and Wagener, T.: Effect of natural iron fertilization on carbon sequestration in the Southern Ocean, Nature, 446, 1070– 1074, 2007. Bowie, A. R., Merwe, P. Van Der, Trull, T., Fourquez, M., Blain, S., Chever, F., and Townsend, A.: Iron budgets for three distinct biogeochemical sites around the Kerguelen plateau (Southern Ocean) during the natural fertilization experiment KEOPS-2, Biogeosciences, (KEOPS2 Special Issue), 2014. Brandstetter, M., Genner, A., Anic, K., and Lendl, B.: Tunable external cavity quantum cascade laser for the simultaneous determination of glucose and lactate in aqueous phase., Analyst, 135, 3260–5, 2010. Bylesjö, M., Rantalainen, M., Cloarec, O., Nicholson, J. K., Holmes, E., and Trygg, J.: OPLS discriminant analysis: combining the strengths of PLSDA and SIMCA classification, J. Chemom., 20, 341–351, 2006. Carr, M.-E., Friedrichs, M. A. M., Schmeltz, M., Noguchi Aita, M., Antoine, D., Arrigo, K. R., Asanuma, I., Aumont, O., Barber, R., Behrenfeld, M., Bidigare, R., Buitenhuis, E. T., Campbell, J., Ciotti, A., Dierssen, H., Dowell, M., Dunne, J., Esaias, W., Gentili, B., Gregg, W., Groom, S., Hoepffner, N., Ishizaka, J., Kameda, T., Le Quéré, C., Lohrenz, S., Marra, J., Mélin, F., Moore, K., Morel, A., Reddy, T. E., Ryan, J., Scardi, M., Smyth, T., Turpie, K., Tilstone, G., Waters, K., and Yamanaka, Y.: A comparison of global estimates of marine primary production from ocean color, Deep Sea Res. Part II Top. Stud. Oceanogr., 53, 741–770, 2006. Charmantier, A., McCleery, R. H., Cole, L. R., Perrins, C., Kruuk, L. E. B., and Sheldon, B. C.: Adaptive phenotypic plasticity in response to climate change in a wild bird population., Science, 320, 800–803, 2008. Closset, I., Lasbleiz, M., Leblanc, K., Quéguiner, B., Cavagna, a.-J., Elskens, M., Navez, J., and Cardinal, D.: Seasonal evolution of net and regenerated silica production around a natural Fe-fertilized area in the Southern Ocean estimated from Si isotopic approaches, Biogeosciences Discuss., 11, 6329–6381, doi:10.5194/bgd-11-6329-2014, 2014. Domenighini, A. and Giordano, M.: Fourier Transform Infrared Spectroscopy of microalgae as a novel tool for biodiversity studies, species identification, and the asssessment of water quality, J. Phycol., 45, 522–531, 2009. Fraile, J., García, J., Mayoral, J., and Pires, E.: Heterogenization on Inorganic Supports: Methods and Applications, in: Heterogenized Homogeneous Catalysts for Fine Chemicals Production SE, edited by: Barbaro, P. and Liguori, F., Springer Netherlands., 33, 65–121, 2010. Geider, R. J. and La Roche, J.: Redfield revisited: variability of C : N : P in marine microalgae and its biochemical basis, Eur. J. Phycol., 37, 37–41, 2011. Giordano, M., Kansiz, M., Heraud, P., Beardall, J., Wood, B., and McNaughton, D.: Fourier transform infrared spectroscopy as a novel tool to investigate changes in intracellular macromolecular
www.biogeosciences.net/11/5795/2014/
5807
pools in the marine microalga Chaetoceros muellerii (Bacillariophyceae), J. Phycol., 37, 271–279, 2001. Giordano, M., Ratti, S., and Domenighini, A.: Spectroscopic classification of 14 different microalga species: first steps towards spectroscopic measurement of phytoplankton biodiversity, Plant Ecol. Divers., 2, 155–164, 2009. Hasle, G. R. and Syvertsen, E. E.: Marine Diatoms, in: Identifying marine phytoplankton, vol. 39, edited by: Tomas, C. R., Academic Press, New York, 5–361, 1997. Heraud, P., Wood, B. R., Tobin, M. J., Beardall, J., and McNaughton, D.: Mapping of nutrient-induced biochemical changes in living algal cells using synchrotron infrared microspectroscopy., FEMS Microbiol. Lett., 249, 219–25, 2005. Heraud, P., Wood, B., Beardall, J., and McNaughton, D.: Probing the influence of the environment on microalgae using infrared and raman spectroscopy, in: New Approaches in Biomedical Spectroscopy, edited by: Kneipp, K., Aroca, R., Kneipp, H., and Wentrup-Byrne, E., American Chemical Society, Washington, DC, ETATS-UNIS (1974) (Revue), 963, 85–106, 2007. Heraud, P., Stojkovic, S., Beardall, J., McNaughton, D., and Wood, B. R.: Intercolonial variability in macromolecular composition in P-starved and P-replete Scenedesmus populations revealed by infrared microscopy, J. Phycol., 44, 1335–1339, 2008. Hoffmann, L. J., Peeken, I., and Lochte, K.: Effects of iron on the elemental stoichiometry during EIFEX and in the diatoms Fragilariopsis kerguelensis and Chaetoceros dichaeta, Biogeosciences, 4, 569–579, doi:10.5194/bg-4-569-2007, 2007. Houle, D., Govindaraju, D. R., and Omholt, S.: Phenomics: the next challenge., Nat. Rev. Genet., 11, 855–66, 2010. Ingall, E. D., Diaz, J. M., Longo, A. F., Oakes, M., Finney, L., Vogt, S., Lai, B., Yager, P. L., Twining, B. S., and Brandes, J. A.: Role of biogenic silica in the removal of iron from the Antarctic seas, Nat. Commun., 4, 1981, doi:10.1038/ncomms2981, 2013. Jacquet, S. H. M., Dehairs, F., Cavagna, A. J., and Planchon, F.: Variability of mesopelagic organic carbon mineralization efficiency in the naturally ion-fertilized Kerguelen area, Biogeosciences, (KEOPS2 Special Issue), 2014. Jebsen, C., Norici, A., Wagner, H., Palmucci, M., Giordano, M., and Wilhelm, C.: FTIR spectra of algal species can be used as physiological fingerprints to assess their actual growth potential, Physiol. Plant., 4, 4146, doi:10.1111/j.1399-3054.2012.01636.x, 2012. Jungandreas, A., Wagner, H., and Wilhelm, C.: Simultaneous measurement of the silicon content and physiological parameters by FTIR spectroscopy in diatoms with siliceous cell walls., Plant Cell Physiol., 53, 2153–2162, 2012. Kroon, B. M. A. and Thoms, S.: From electron to biomass: a mechanistic model to describe phytoplankton photosynthesis and steady-state growth rates, J. Phycol., 42, 593–609, 2006. Le Quere, C., Harrison, S. P., Colin Prentice, I., Buitenhuis, E. T., Aumont, O., Bopp, L., Claustre, H., Cotrim Da Cunha, L., Geider, R., and Giraud, X.: Ecosystem dynamics based on plankton functional types for global ocean biogeochemistry models, Glob. Chang. Biol., 11, 2016–2040, 2005. Litchman, E. and Klausmeier, C. A.: Trait-Based Community Ecology of Phytoplankton, Annu. Rev. Ecol. Evol. Syst., 39, 615– 639, 2008. Marchetti, A. and Cassar, N.: Diatom elemental and morphological changes in response to iron limitation: a brief review with po-
Biogeosciences, 11, 5795–5808, 2014
5808
O. Sackett et al.: Taxon-specific responses of Southern Ocean diatoms
tential paleoceanographic applications, Geobiology, 7, 419–31, 2009. Marchetti, A., Varela, D. E., Lance, V. P., Johnson, Z., Palmucci, M., Giordano, M., and Armbrust, E. V.: Iron and silicic acid effects on phytoplankton productivity, diversity, and chemical composition in the central equatorial Pacific Ocean, Limnol. Oceanogr., 55, 11–29, 2010. Martin-Jézéquel, V., Copernic, P. N., Plouzane, F., and Brzezinski, M. A.: Review of silicon metabolism in diatoms: implications for growth, J. Phycol., 840=, 821–840, 2000. Mora, C., Myers, R. A., Coll, M., Libralato, S., Pitcher, T. J., Sumaila, R. U., Zeller, D., Watson, R., Gaston, K. J., and Worm, B.: Management Effectiveness of the World’s Marine Fisheries, PLoS Biol, 7, e1000131, doi:10.1371/journal.pbio.1000131, 2009. Murdock, J. N. and Wetzel, D. L.: FT-IR Microspectroscopy Enhances Biological and Ecological Analysis of Algae, Appl. Spectrosc. Rev., 44, 335–361, 2009. Naumann, D.: Infrared Spectroscopy in Microbiology, in Encyclopedia of Analytical Chemistry, edited by: R. A. Meyers, 102– 131, 2000. Naumann, D., Helm, D., and Labischinski, H.: Microbiological characterisations by FT-IR spectroscopy, Nature, 351, 81–82, 1991. Nelson, D. M., Tréguer, P., Brzezinski, M. A., Leynaert, A., and Quéguiner, B.: Production and dissolution of biogenic silica in the ocean: Revised global estimates, comparison with regional data and relationship to biogenic sedimentation, Global Biogeochem. Cy., 9, 359–372, 1995. Ngo-Thi, N., Kirschner, C., and Naumann, D.: Characterization and identification of microorganisms by FT-IR microspectrometry, J. Mol. Struct., 661, 371–380, 2003. Nunn, B. L., Faux, J. F., Hippmann, A. a, Maldonado, M. T., Harvey, H. R., Goodlett, D. R., Boyd, P. W., and Strzepek, R. F.: Diatom proteomics reveals unique acclimation strategies to mitigate fe limitation., PLoS One, 8, e75653, doi:10.1371/journal.pone.0075653, 2013. Quéguiner, B., Blain, S., and Trull, T.: High primary production and vertical export of carbon over the Kerguelen Plateau as a consequence of natural iron fertilization in a high-nutrient, low-chlorophyll environment, in The Kerguelen Plateau: marine ecosystem and fisheries, Proceedings of the 1st international Science Symposium on the Kerguelen Plateau, Société Française d’Ichtyologie, edited by: Duhamel, G. and Welsford, D., 167– 172, 2007.
Biogeosciences, 11, 5795–5808, 2014
Sackett, O., Petrou, K., Reedy, B., Grazia, A. De, Hill, R., Doblin, M., Beardall, J., Ralph, P., and Heraud, P.: Phenotypic plasticity of Southern Ocean diatoms: key to success in the sea ice habitat?, PLoS One, 8, e81185, doi:10.1371/journal.pone.0081185, 2013. Tobin, M. J., Puskar, L., Barber, R. L., Harvey, E. C., Heraud, P., Wood, B. R., Bambery, K. R., Dillon, C. T., and Munro, K. L.: FTIR spectroscopy of single live cells in aqueous media by synchrotron IR microscopy using microfabricated sample holders, Vib. Spectrosc., 53, 34–38, 2010. Trull, T., Davies, D., Dehairs, F., and Passmore, A.: Phytolankton size and compositions variations in naturally iron fertilised Southern Ocean waters: evidence for differing propensities for carbon export in waters downstream versus over the Kerguelen plateau, Biogeosciences, (KEOPS2 Special Issue), 2014. Twining, B. S., Baines, S. B., and Fisher, N. S.: Element stoichiometries of individual plankton cells collected during the Southern Ocean Iron Experiment (SOFeX), Limnol. Oceanogr., 49, 2115– 2128, 2004a. Twining, B. S., Baines, S. B., Fisher, N. S., and Landry, M. R.: Cellular iron contents of plankton during the Southern Ocean Iron Experiment (SOFeX), Deep. Res. Part I-Oceanographic Res. Pap., 51, 1827–1850, 2004b. Vaccari, L., Birada, G., Grenci, G., Pacor, S., and Businaro, L.: Synchrotron radiation infrared microspectroscopy of single living cells in microfluidic devices: advantages, disadvantages and future perspectives, J. Phys. Conf. Ser., 359, 012007, doi:10.1088/1742-6596/359/1/012007, 2012. Van Oijen, T., van Leeuwe, M. A., Granum, E., Weissing, F. J., Bellerby, R. G. J., Gieskes, W. W. C., and de Baar, H. J. W.: Light rather than iron controls photosynthate production and allocation in Southern Ocean phytoplankton populations during austral autumn, J. Plankton Res., 26, 885–900, 2004. Venyaminov, S. Y. and Kalnin, N. N.: Quantitative IR spectrophotometry of peptide compounds in water (H2 O) solutions, I. Spectral parameters of amino acid residue absorption bands, Biopolymers, 30, 1243–57, 1990. Vongsvivut, J., Heraud, P., Zhang, W., Kralovec, J. a, McNaughton, D., and Barrow, C. J.: Quantitative determination of fatty acid compositions in micro-encapsulated fish-oil supplements using Fourier transform infrared (FTIR) spectroscopy, Food Chem., 135, 603–609, 2012. Wagner, H., Liu, Z., Langner, U., Stehfest, K., and Wilhelm, C.: The use of FTIR spectroscopy to assess quantitative changes in the biochemical composition of microalgae, J. Biophotonics, 3, 557–66, 2010. Wold, S., Sjöström, M., and Eriksson, L.: PLS-regression: a basic tool of chemometrics, Chemom. Intell. Lab. Syst., 58, 109–130, 2001.
www.biogeosciences.net/11/5795/2014/