Townsville and the Daintrce River. Estimates were prcpared .... was determined by adjusting the productiye area for small areas of rock, road and stream bufrers. A netting ...... painting a conLinuous ring around the tree. 5. All areas should be ...
NO. 47
T E C H N I C APLA P E R
N CALCULATION OF TIMBER YIELDS FROM NORTH QUEENSLANDRAINFORESTS BY R. A. PRESTONAND J. K. VANCLAY
ISSN 0155-9664
CALCULATION OF TIMBER YIELDS FROM NORTH QUEENSLANDRAINFORESTS BY R. A. PRESTONAND J. K. VANCLAY
PREFACE This paper has been prepared in the interests of community discussion of recent proposals for World Heritage Listing of the wet tropics of north Queensland. It presents the results of studies carried out in 1985, which provided the basis for sawmill allocations for the period 1 October 1986 to 30 September 1991. Consequently, the paper does not discuss in detail the subsequent reduction of the allowable cut for Zone 2 (Innisfail-Tully) from 14000 toL2320 cubic metres per year, in response to damage from Cyclone Winifred. Details of this reduction are reported in Preston (1987).
ABSTRACT Calculation of timber yields from north Queenslandrainforests indicate that the long term average yield is in the vicinity of 63 000 cubic metres per year, and that an allowable cut of 60000 cubic metres per year should apply for the period 1986-1991. These calculations aPply to the 158 000 hectares of Crown land managed for timber production between Townsville and the Daintrce River. Estimates were prcpared using cutting cycle analysis, and incorporated a number of innovations made possible by advances in computing technology. These included simulating the growth of individual plots rather than of stratum averages,and the use of a dynamic growth model which accomodated stand dcnsity, composition and site quality.
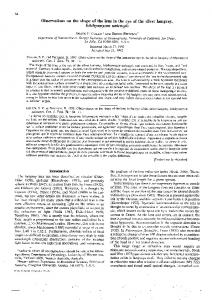
INTRODUCTION The tropical rainforests of north Queensland are one of Australia's most valuable natural resources- They are highly valued for their conservation significance and ecological diversity, and sustain a harvest of valuable cabinet, vcneer and structural timbers The study area includes all coastal and hinterland tropical rainforest between Townsville and the Daintree River. This region is divided into five allocation zones (Figure 1) which form the basis for regulation of timber supplies. This study appraisesthe allowable cut of rainforest timber from the state forests, timber reserves, and other Crown lands in each allocation zon'e for the pcriod 1 Octobcr 1986 to 30 Scptember 1991. Yields will be reviewed prior to 1991 in accordancewith Departmental policy to review the allowable cut in all native forests every fivc years.
OVERVIEW
OF YIELD
REGULATION
The process of yield regulation comprises three major stages. The long term avcrage yieldn is first calculated to give a sound pcrspectivc of the future resource position. This prlvides the basis for determination of thc allowable cut, which is set for a five year period ior each allocation zone. Within each zone, allocations of timber are ofrered to sawmilling firms entitled to crown supplies,so that they sum to the allowable cut. Calculation of the long term averageyield entails several basic operations: o the area of forest capable of producing timber is determined. Forest subject to spccial management (e.g. scientific areas16,bufrer stripsa along creeks) and inaccessible or unproductivc forest is excluded. o a detailed inventory of the cxisting forest is prepared by measuring temporary plots and recording the species,size and merchantability of each tree within ihe plot.
22,16,4 Sce glossary for description of tcrms idcntificd by supencript ngmbers.
-2-
"!(tl l
bl t'l
-
!ri
-l-
l
tl ql
-
l
| '-*
I STUDYAREA I lscale I
a b t . 1 : 3o o o o o o
I
"r,0" I -.\
b
CAIRNS
Mareeba
@
Athert
a
@
Ravenshoe a
i-
o ,ri. R a i n fo re s t State Forests S tu d y Are a
---@
Allocation Zones
__l_,*
@
N I
190
t
\ \. i
.
II
n
t.ll::Tlfl'
Figure 1. Lccation of the study area
- 3-
o the future condition (number, size and merchantability of trees) of each inventory plot is predicted by simulating the growth (diameter increment, mortality and recruitmentls) of the forest over time. o at selected intervals, a timber harvest is simulated to indicate which stems would be removed in logging, and to predict mortality to the residual standls arising from felling and snigging damage. o the anticipated harvest volume is then calculated using volume equations2l. o the growth and harvesting of each inventory plot is simulated through several cutting cyclesT to ensure the continuity of future timber harvests. This procedure provides an estimate of the timber yield which can be sustained under the specified management regime and assumed economic conditions. Timber harvesting can be sustained at any level not exceeding this yield.
CALCULATION OF TIMBER YIELDS Area Estimates Area estimatesare an essentialingredient of the resource forecast, and due account must be taken of unproductive land such as rock outcrops, stream buffers, and other areas which cannot be logged. To facilitate the preparation of area estimates, a computerized area information system was commencedin 1978, and was used in the present calculation. It was based on the New South Wales FORINS System (Hoschke and Squire L978), and records management information at each 1000 metre Australian Map Grid (AMG) intersection within the study region. Although this provides relatively "coarse" information (in that the best estimate attainable is to the nearest 100 hectares), it is an efEcient mechanism for dealing with large amounts of data over extensive areas of forest. This system was used to calculate the area utilized for timber production within the study area (Table t), and within each allocation zone (Table 2). Data were drawn primarily from timber managementmaps and included tenure, allocation zorre, management intention and logging history. These maps were prepared by field staff during the period 1978 to 1980 using historical timber salesrecords dating back to the mid 1950's, and have been regularly updated. Where no records were available, estimates of accessibility and productivity were prepared from interpretation of 1 : 25 000 scale aerial photographs. The gross productive areal (or mapped area) of rainforest was determined by multiplying the number of sample points in each allocation zone believed to be availablc, accessibleand productive, by 100 hectaresper point. The productive areal was calculated from the gross productive area by applying a correction factor to adjust for inaccessibleor unproductive rainforest misclassifiedas accessibleand productive on managementmaps. This factor was determinedfrom inventory by calculating the proportion of plots located on contiguous areas of inaccessiblerainforest, and was found to be 0.839 for areas logged before L970, and 0.960 for areas logged since Lg7O. The difference reflects the improved accuracy of information arising from more intensive managementin recent years. A check was also made to determine if any land outside the gross productive area had been misclassified(i.e. actually productive). About 98 percent was classified correctly, and about two percent was marginal. Misinterpretation of inaccessibleand unproductive land was therefore assumedto be negligible, and no attempt was made to establish inventory plots in these areas.
I I
1
- 4 -
1
:
I
Trblc 1. Rdnlorcrt
tcnurc -
Towusvlllc lo lhlntrec
Rlvcr.
Arcr (hr) Subtotel
Tenurc rnd mrnegenent
Subtotel
Totd
Pcrccnt
Areas where logging is excluded 1. Special management areas 2. Inaccessible and rurproductive forest and bufrer strips
54000
9
227000
39
Produstivc area
281000
48
158000
27
Statc forcsts, tirnbcr reserveg and other crown lands
439000
75
National park
105000
18
42WO
7
Frechold
586000
Total
TeHc 2. Arcr ol relnlorcrt
Allocrtlon
1. 2 3. 4. 5.
zonc
Ingham- Ravenshoc Innisfail - Tully Tablelards C-airns- Kuranda Windsor- Lcwis
Totat all zoncs
by rllocrtlon
zonc.
Productlve erer (hr)
52500 31900 27 600 24300 2l7W
158000
100
- 5 -
The nett productive areal (or efrective area) was used as the basis for yield calculations, and was determined by adjusting the productiye area for small areas of rock, road and stream bufrers. A netting factor of 0.956 was estimated from inventory data by calculating the proportion of stems on each plot which were assessedas inaccessibleor unavailable. At any given time the loggable areal of rainforest is less than thc nett productive area. This occurs because areas currently considered uneconomic to log may be logged at a later date. To take account of this in yield calculations, any inventory plot (and its associated nett productive area) that would not produce a minimum yield of five cubic metres per hectare at the midpoint of a cutting cycle was excluded from logging in that cycle, but would remain eligible to be logged in subsequent cycles. This procedure reflects current resource and operating conditions, and generally ensures a viable yield of. 12 cubic metres per hectare of gross productive area. An estimate of the loggable area may therefore be obtained by multiplying the nett productive area by the proportion of inventory plots yielding more than five cubic metres per hectare at the timc of (simulated) logging. During simulation, about 10 percent of the nett productive area was only logged every alternate cutting cycle. In the Department's 1981 allowablc cut calculation, thc loggable area was used as the basis for calculations, and was defined as the area able to be logged in each of thc next three cutting cycles. This was calculated as 0.91 of thc nett productive area, and derived from the observation that tr7 out of 181 inventory plots then available were considered unproductive or loggable only within 100 years. Inventory Inventory data collected during the period 1978 to 1985 were used in the current calculation. Temporary plots were establishcd at prcdetermined 1000 mctre AMG intersections, selected from the area information systcm using stratified random sampling with logging history as the primary stratum. As most logging of accessibleand prodortir" virginle rainforest will be completed in thc near future, "tl inventory plots in virgin stands were excluded from these calculations. Thrce difrerent types of plot were used over this period (Table 3). Trblc 3. Plot tyFc end nmpllng
lntcnrlty.
Plotr pcr rllocrtlon Yeer
1978-81 1983 1984 1985
Totals
Plot typc
Point sarnplc Point sample Fircd erca Fircd/point
1
2
3
4
zonct
s
p
t
Totet
o
t
r
34 15 98 t9 5 t7r 4 4 0 0 0 0 4 / i 2 1 1 5 8 2 6 t 4 E 4 1 0 4 2 4 0 2 0
109
34
10E 49
t plots in virgin stard$excluded
t9
319
6 -
During the period 1-9lg to 1983, clusters of ten point samplesl4 were employed, in which an optical wedgel3 with a basal area factor3 (BAF) of 10 square metres per hectare was used, and all stems exceeding three centimetres diameter (at breast height or above buttress, over bark) w€re measured. During 1984, fixed area plots were favoured. All stems exceeding 30 cm diameter were sampled on a half hectare plot, and stems exceeding 20 cm diameter were sampled on a 0.725 ha sub-sample. During 1985, a small number of plots were established using a new approach. These plots sampled all stems exceeding 40 cm diameter over one hectare, and used four point samples (BAF 2.3 sq m/ha) to sample stems 3 to 40 cm diameter. The species, diameter, merchantability all plots.
and visual thinning2o was recorded for,each tree on
There is no compelling statistical advantage in the use of any of these plot types in preference to the others for description of the current stand or to provide forecasts. For quantifying the existing stand, there is some advantage in having a large heterogeneous plot studies, a small Conversely, for simulation to minimize between-plot variation. homogeneous plot is more appropriate. In practice, cost factors and the preference of field staff are of greater consequence. Growth Model An integral part of yield forecasting is growth prediction. Growth models for plantations and for monospecific forests have become sophisticated and highly accurate. Rainforests comprise hundreds of species, posing a much more difficult challenge. Notwithstanding this, a dynamic growth model for rainforests has been developed and was used in the present study. The model is described by Vanclay (1987) and the data upon which it is based is summarized in Queensland Department of Forestry (1983). The growth model has functions for diameter increment, tree mortality, and recruitment of new trees into the stand. Each of these functions takes into account the site quality, the soil parent material, the stand composition and density, and the size of the individual trees. Site quality, expressed as good or poor, is determined objectively by assessing soil parent material, presence of indicator specieslr , cstimated residual volume after visual thinning, and average log length (Vanclay, in press). The model recognises several soil parent materials: acid volcanic, basic volcanic, coarse granite, Tully granite, sedimentarymetamorphic and alluvial-colluvial. In general, coarse-grained granite-derived soils support the most productive forests. It is impractical to develop individual functions for each of the several hundred tree species represented in north Queensland rainforests. Accordingly, commercials species were grouped into four growth groupslT according to their growth habit: o large fast growing; o large slow growing; o (comparatively) small fast growing; and o small slow growing.
7-
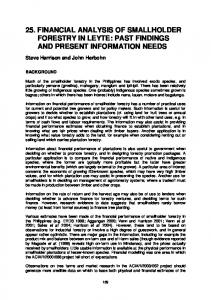
Practical necessity required the use of a single group for all non-commercial specics. This grouping has ecological significance, with gap opportunists contained in thc large fast group, pioneer speciesin the small fast group, and shadc tolerant spccies in the slow groups. The model does not retain the species idcntity of each trce, but cmploys species groups formed from trees having membership of the same growth and harvesting groups17,and using thc same volume equation. The identity of the inventory data (as distinct from predicted recruitment) is also retained. This cnables the flagging of yicld forccasts which include predicted recruitment. The growth functions cmployed in the model were fitted to thc data using linear rcgrcssion to ensure that estimatcs are unbiased. Because diamcter increment data wers sparse for large trees, the functions were constrained to be asymptotic to subjectively determined maximum diameters (Figure 2). Because the 1984 data sampled only stems exceeding 20 cm diameter, rccruitment was predicted at 2O cm, diametcr. However, whcre stems smaller than 20 cm werc measured, these data were utilized, and the rccruitment function was activated only when obscrved small stems exceeded 20 cm diameter. Stems smallcr than 10 cm diameter were ignored, as with point samples (cspecially with BAF 10 sq m/ha), thesc reprcsent very largc numbers of stems per hectare, and may convcy an unrcalistic impression of stand composition. Harvestlng Model Prior to logging, trees thought capable of producing a merchantablel2 log arc marked for removal in accordance with Departmcntal guidelines (Appendix 1). When felled, some stems reveal defects not evident when the trec was standing. Depcnding on the amount of this defect, the log may be classified as compulsory6 or optional. Only compulsory timber is debited to the sawmill allocation. Essential components of the harvesting model are the logging rule, which indicates stems to be removed; an allowance to predict the compulsory proportion of the logged stems, and a damage function, which predicts mortality arising from felling and snigging damagc to the residual stand. To simulatc harvesting, species wcre placed into nine harvcsting groups 17, based on the treemarking groups defined in Appendix 1 and on merchantability (Table 4). Two diameters may determine whether a tree is selected for harvesting. Trees smaller than thc cutting diametere -"y bc removed only if they exceed 40 cm diameter and can be expected to die prior to the next logging. Stems abovc thc cutting diametcr and up to the retention diameter9 will generally bc removcd unless thcy have exceptional form or vigour, or are required as a seed tree. Stcms exceeding the retention diameter must bc markcd for logging. Tablc 4 also shows that the current (1986) treemarking rules are intermcdiatc to logging rules A and B, but most closely resemble rule A. Thc logging rule describes thsse treemarking guidelincs as a series of simple lincar relationships which predict the perccntagc of stems harvested (Figure 3). Two difierent logging rules werc evaluated. Logging Rulc A reflccts removals under thc 1985 trcemarking guideline$ Logging Rule B incorporates a reduced retention intervale. The logging rules were prepared from visual thinning assessmentson the 1985 inventory plots. Thesc data werc used in prcfcrence to other alternatiyes, as the 1985 inventory plots were large (1 ha) and werc expressly established by expcrienced field stafr in stands logged before 1970.
----l i
I
7 t I
o
CO
qt o)
6
o g.
tr
o sf
F{
d TA q,
C{
6a