Jan 14, 2014 - B. Petrie, J.W. Loder and J. Lazier. Physical ... St John's, Newfoundland A1C 5X1 .... 122 / B. Pétrie, J.W. Loder, S. Akenhead and J. Lazier. 56°.
Downloaded by [Fisheries and Oceans Canada] at 07:40 14 January 2014
Temperature and Salinity Variability on the Eastern Newfoundland Shelf: The Residual Field B. Petrie, J.W. Loder and J. Lazier Physical and Chemical Sciences Department of Fisheries and Oceans Bedford Institute of Oceanography, P.O. Box 1006 Dartmouth, Nova Scotia B2Y 4A2 and S. Akenhead* Science Branch Department of Fisheries and Oceans Northwest Atlantic Fisheries Centre, P.O. Box 5667 St John's, Newfoundland A1C 5X1
[Original manuscript received 20 November 1990; in revised form 15 July 1991]
ABSTRACT Time series of temperature, salinity and ice area from the Newfoundland and Labrador Shelves during 1951-86 are examined to determine the temporal and spatial scales of variability outside of the annual band. Significant interannual (periods of 1.818 a) variability of temperature (root-mean-square amplitude 0.5°C) and salinity ( 0.1) is found at all depths and, for depths greater than about 100 m, is exceeded or matched only by the annual component. Vertical scales of the low-frequency variability for the depth range 0-75 m are estimated to be twice as large for salinity (60 m) as for temperature (30 m); whereas, for the depth range of 75-175 m, they are the same (90 m) and exceed the scales for the 0-75 m interval. The dominance of low-frequency energy and the size of the vertical scales at depths 100 m suggest that the irregular-temporal and widely spaced vertical sampling of the hydrographic time series would not affect a study of interannual variability in this region. The analysis also suggests that the subsurface low-frequency variability is correlated over horizontal distances of about 1000 km, though the time series are too short to establish statistical confidence. RÉSUMÉ On examine des séries chronologiques de données de température, de salinité et d'englacement pour les plates-formes de Terre-Neuve et du Labrador, portant sur la période 1951-1986, dans le but de déterminer les échelles temporelles et spatiales de variabilité hors de la bande annuelle. Une importante variabilité interannuelle (périodes de 1,8 à 18 a) des températures (amplitude moyenne quadratique 0,5°C) et de la salinité ( 0,1) est *Present affiliation: Borstad Associates Ltd., 100-9865 West Saanich Road, Sidney, B.C., V8L 3S1.
ATMOSPHERE-OCEAN 30 (1) 1992, 120-139 0705-5900/92/0000-0120$01.25/0 © Canadian Meteorological and Océanographie Society
Temperature and Salinity Variability on the Eastern Newfoundland Shelf / 121
Downloaded by [Fisheries and Oceans Canada] at 07:40 14 January 2014
observée à toutes les profondeurs; pour les profondeurs de plus d'environ 100 m, elle n 'est dépassée ou égalée que par la composante annuelle. On estime que les échelles verticales de variabilité aux basses fréquences, pour la fourchette de profondeurs 0-75 m, sont deux fois plus grandes pour la salinité (60 m) que pour la température (30 m), tandis que pour la fourchette de pronfondeurs 75-175 m, elles sont égales (90 m) et dépassent les échelles déterminées pour les profondeurs 0-75 m. La prédominance d'une énergie de basse fréquence et la grandeur des échelles verticales à des profondeurs 100 m indiquent que l'échantillonnage temporel irrégulier à grands intevalles de la série chronologique de données hydrographiques n 'influerait pas sur une étude de la variabilité interannuelle dans cette région. L'analyse révèle également que la variabilité aux basses fréquences sous la surface est corrélée sur des distances horizonatales de 1000 km environ, même si les séries chronologiques sont trop courtes pour établir une confiance statistique.
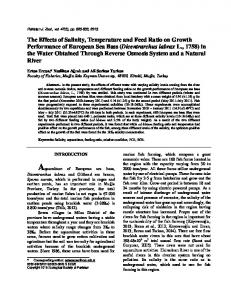
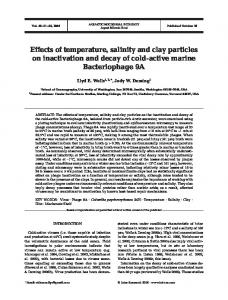
1 Introduction Standard océanographie sections and stations on the eastern Newfoundland and Labrador shelves (Fig. 1) have been occupied since about 1950, for the purposes of monitoring year-to-year variations of the ocean climate and determining environmental influences on the coastal fisheries. Templeman and Flemming (1956) observed interannual variations of the extent of the subsurface layer of cold (T < 0°C) water in the Bonavista section and maintained that these variations determined the location of the long line fishery. They proposed that the volume and temperature of this cold intermediate layer (CIL) was determined by the severity of the local winter and by the strength of the Labrador Current. Templeman (1975) concluded that the Newfoundland Shelf temperatures were lower and that the area of the CIL was greater in 1972 and 1973 than in any of the previous 20 years. Lear et al. (1986) quantitatively examined the hypothesis (Lear and Green, 1984) that the proportion of cod migrating inshore in late June and early July depended directly on the temperature and inversely on the thickness of the CIL. The average temperature from 100 to 150 m at Sta. 27 in June and July was used as an environmental index and was assumed to represent the conditions over the eastern Newfoundland and Labrador shelves, extending from Hamilton Bank to the Grand Bank. Thompson et al. (1988) investigated the spatial and temporal scales of sea surface temperature (SST) anomalies for the shelf-slope region from the Labrador Sea to the Mid Atlantic Bight. They found that the first two empirical orthogonal modes had horizontal scales 0(1000 km) and could account for 44% of the total variance. Both modes had low-frequency peaks between 1 and 2 a and, in addition, mode 1 showed increased variance at 8 a. However, although the first two modes accounted for nearly 60% of the variability on the Grand Banks, they only accounted for 2% of the variability on the Labrador Shelf, indicating that the SST of the two areas were not coupled. On the other hand, Myers et al. (1990), by examining the annual anomalies of ice cover, freshwater runoff and salinity data, argued convincingly that the ice-melt on the Labrador Shelf was primarily responsible for the interannual variability of
122 / B. Pétrie, J.W. Loder, S. Akenhead and J. Lazier 56°
48°
52°
44°
LABRADOR SEA 56°
Downloaded by [Fisheries and Oceans Canada] at 07:40 14 January 2014
56° :
52° 62°
48°
44°
56°
52°
48°
44°
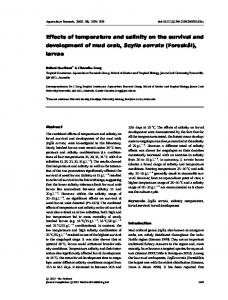
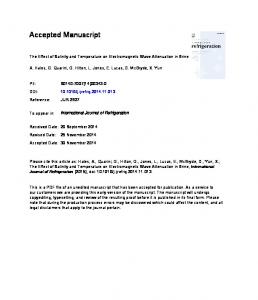
Fig. I Map of the study region with the locations of data sources indicated.
salinity at Sta. 27. Their work indicates that the oceanography of the two areas is strongly coupled. Part of the motivation for our work stems from fisheries studies that require environmental time series that measure interannual variability and represent a large area. Moreover, there is a need to investigate subsurface as well as surface observations. In this paper, we examine the temporal and spatial scales of variability of the temperature and salinity fields on the eastern Newfoundland Shelf. The focus
Temperature and Salinity Variability on the Eastern Newfoundland Shelf / 123
Downloaded by [Fisheries and Oceans Canada] at 07:40 14 January 2014
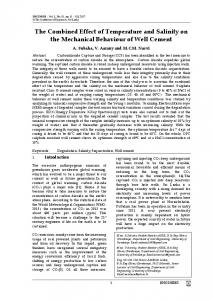
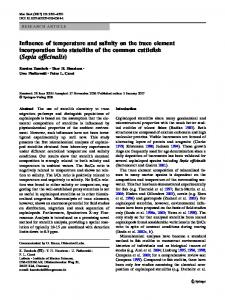
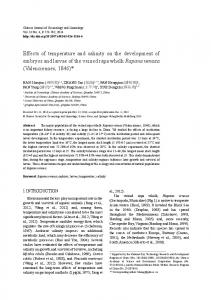
is generally on temporal scales longer than 1 year, the annual and semi-annual cycles having been dealt with previously (Pétrie et al., 1990). In Section 2 the data and analysis techniques are described. The 36-year time series of temperature and salinity from Sta. 27 are used in Section 3 to determine the temporal and vertical scales of variability, and the distribution of temperature and salinity variance in several frequency bands as a function of depth. In Section 4, other datasets are related to the Sta. 27 observations in order to quantify the horizontal extent of the residual temperature fields. The major findings are summarized in Section 5. 2 Data and analysis techniques The temporal spans of the datasets are shown in Fig. 2. The longest series, which is from Sta. 27 and covers about 36 years, has been sampled irregularly at an average rate of twice a month. Temperature and salinity observations have been taken at standard depths of 0, 10, 20, 30, 50, 75, 100, 125, 150 and 175 m, though the 10-, 20- and 125-m levels were not sampled until 1959. The 175-m data series has numerous gaps. The shortest dataset (Anderson, 1986) is from 3 current-meter moorings located in Avalon Channel for up to 10 months in 1980-81 and consists of observations of temperature and salinity at nominal depths of 30, 50, 75, 100 and 130 m. Other time series include annual hydrographie sections (see, e.g. Pétrie et al., 1988) normally occupied in early August across Hamilton Bank, the northeast Newfoundland shelf (White Bay and Bonavista sections) and the northern Grand Bank (47°N); temperature observations from a current meter moored at 180 m on Hamilton Bank from 1978 to 1986; temperature data from a thermograph at 9 m in Stock Cove from 1968 to 1986; SST data from ships of opportunity for areas of the Atlantic Coast as defined by Thompson et al. (1988); and the areal extent of the ice south of 55°N (Peterson and Prinsenberg, 1990). Harmonic analysis was used to determine the amplitude and phase of the 12(annual), 6- (semi-annual), 4- and 3-month cycles of the irregularly spaced time series of temperature and salinity from Sta. 27 (Pétrie et al., 1990). These components were removed from the observations to create time series of T and S anomalies, which were interpolated to yield equally spaced (30.4375 d = 365.25 d/12) monthly means (Myers et al., 1988). The current-meter data from Avalon Channel were available as an hourly time series. The hydrographie observations from Hamilton Bank, White Bay, Bonavista and 47°N were objectively mapped (Akenhead, 1986) onto a grid, different for each section, and the area of water with T »s 0°C, our definition of the CIL, was determined. The overall mean and the yearly anomalies for each section were then calculated. Monthly averages were calculated from the available current-meter data from Hamilton Bank, the temperature data from Stock Cove, the SST observations and the ice-cover time series from the shelf. Long-term means were subtracted from the time series giving monthly anomalies. The datasets are thus a mixture of hourly, monthly and yearly time series. Standard techniques such as spectral, correlation and empirical orthogonal function analyses were used to investigate the relationships among the time series. Our estimates of certain parameters and functions such as the vertical scales and lagged
124 / B. Pétrie, J.W. Loder, S. Akenhead and J. Lazier 1950
1960
1970
1980
1990
VARIABLES
1. HAMILTON BANK SECTION 2. WHITE BAY SECTION 3. BONAVISTA SECTION 4. 47°N
SECTION
5. HAMILTON BANK MOORING 6. STOCK COVE MOORING
Downloaded by [Fisheries and Oceans Canada] at 07:40 14 January 2014
7. AVALON CHANNEL MOORING 8. STATION 27 T-S STD DEPTHS 9. SHIPS T DATA 10. ICE COVER Fig. 2 Time spans of the datasets used in this paper.
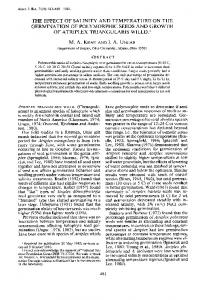
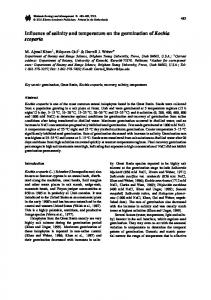
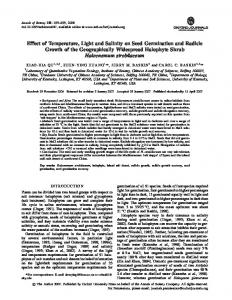
autocorrelations are based on all of the data without regard to season and may be regarded as average values. However, where appropriate, we note whether derived quantities have a seasonal dependence but leave a full discussion to another paper. 3 Station 27: Vertical and temporal structure a Anomalies In addition to time series at discrete depths (Pétrie et al., 1988), T and S anomalies (Fig. 3) have been averaged over two intervals: 0-20 m, which is taken here as the surface layer, and 75-150 m, which is the layer where the annual average T is < 0°C and corresponds to our definition of the CIL. Temperature fluctuations in the shallower layer are as large as ±2.5°C and have a standard deviation of 0.82°C. Salinity varies by up to ±1.0 and has a standard deviation of 0.26. In the deeper layer, the T and 5 fluctuations, up to ±1.25°C and ±0.5, and standard deviations, 0.37°C and 0.13, are about half those in the shallower layer. Variability with time-scales from several months to many years is apparent in all of the time series. The lower frequency variations are more easily seen (Fig. 4) after the data have been subjected to a 13-month running mean filter. Considerable variance remains with the standard deviations for T and 5 in the 0-20 m (75-150 m) layer of 0.41°C (O.25°C) and 0.16 (0.07), respectively. Warm and cold anomalies of up to several years duration are evident in both layers. For example, the warm period of the late 1960s is followed by a cool period in the early 1970s and a warming trend into the early 1980s. The salinity time series have similar features with increased salinity in the late 1960s, fresher conditions in the early 1970s and a trend towards higher salinities until the early 1980s. Myers et al. (1990) attributed these salinity changes at Sta. 27 to the interannual variability of ice melt on the Labrador Shelf. Analysis of data (Lazier, 1980) for the period 1964-1973 from 0 to 1500 m in the Labrador
Temperature and Salinity Variability on the Eastern Newfoundland Shelf /125 Sea shows a similar pattern. Thus, the variations of the T and S anomalies at Sta. 27 appear to be widespread.
Downloaded by [Fisheries and Oceans Canada] at 07:40 14 January 2014
b Correlations Zero lag correlations (r) for the T and S anomaly time series are listed in Table 1 and shown in Fig. 5. Though r does vary as a function of lag, the zero lag value generally is, or is not significantly different from, the largest. The correlations decrease with increasing vertical separation for both T and S, though the rate of decrease is greater for the former at least for the upper half of the water column. Similar results were found by Myers et al. (1988) who presented the lagged correlations of the February and June T and 5 as a function of depth relative to the 0-m observations. A leastsquares fit of the function r — e~kAz, where the correlation is 1 for a separation, Az, of 0 m, and where k~l is the e-folding scale, is used to quantify the vertical structure. For the 0-75 m layer, the e-folding scales are 28 and 56 m for T and S, respectively. For the 75-175 m layer, the corresponding scales are 87 and 93 m. These results indicate that vertical scales are larger for the lower half of the water column. Correlations between T and S at the same depth are generally low - the most significant correlation was —0.48 at 50 m. The vertical scales of the temperature anomalies do show a strong seasonality. In February, the lowest correlation (0.76) is between the 0- and 150-m time series indicating that the vertical scale exceeds the water depth. On the other hand, August correlations decrease somewhat more rapidly than those in Fig. 5. Salinity correlations do not show a strong seasonality. Correlations of the August anomalies are more scattered and decrease with separation slightly faster than those for February do. The overall results for salinity (Fig. 5) give a reasonable representation of the year-round conditions. All of the T and S anomaly time series were significantly autocorrelated, thus making the number of independent measurements less than the number of observations. The effective numbers of degrees of freedom (Bayley and Hammersley, 1946) were calculated from the interpolated time series and are shown in Table 2. Comparison of the autocorrelation functions based on the interpolated data and on the raw data (combined in bins of multiples of 15 ± 7.5 d) indicated that the number of degrees of freedom may be slightly underestimated and therefore conservative. The number of degrees of freedom (Table 2) decreases for depths > 100 for T indicating that low-frequency energy is more dominant in deeper waters. The behaviour is different for S where the lowest number of degrees of freedom are for the upper 20 and lower 50 m, implying that low-frequency variance is more dominant near the surface and the bottom than at mid-depth, where there is proportionately more high-frequency variance. c Spectra Spectra of the T and S anomalies from the eastern Newfoundland Shelf are shown as variance-conserving plots (Figs 6a and b) for four depths. The low-frequency (periods from 100 to 3300 d) spectral estimates were computed from the Sta. 27 anomaly time series (recall that harmonics corresponding to 12, 6, 4 and 3
Downloaded by [Fisheries and Oceans Canada] at 07:40 14 January 2014
STA 27 INTEGRATED MONTHLY RESIDUALS
(0-20 M)
(75-150 M)
o
LU