Page i
Project no.: 271495 Project acronym: ECO-BASE Project title: Establishing CO2 enhanced oil recovery Business advantages in South Eastern Europe
Collaborative Project under the ERA-NET ACT programme
Start date of project: 2017-08-01 Duration: 3 years
D1.1 Status of CCS and CCU in South Eastern Europe Revision: 1
Organisation name of lead contractor for this deliverable: TNO
Copyright © ECO-BASE Consortium 2017-2020
Page ii
PU PP RE CO
Project co-funded by the European Commission within the Seventh Framework Programme Dissemination Level Public X Restricted to other programme participants (including the Commission Services) Restricted to a group specified by the consortium (including the Commission Services) Confidential , only for members of the consortium (including the Commission Services)
Deliverable number:
D1.1.1
Deliverable name:
Status of CCS and CCU in South Eastern Europe
Work package:
WP 1.1 Inventory of source and sink capacities
Lead contractor:
TNO Status of deliverable
Action
By
Date
Submitted (Author(s))
Andreea Burlacu, Anders Nermoen, Caglar Cinayuc, Filip Neele
November 2017
Verified (WP-leader)
Filip Neele
November 2017
Approved (SP-leader) Author(s) Name
Organisation
E-mail
Filip Neele
TNO
[email protected]
Caglar Sinayuc
METU-PAL
[email protected]
Anders Nermoen
IRIS
[email protected]
Andreea Burlacu
CO2 CLUB
[email protected]
Page iii
Public abstract The ECO-BASE project, funded under the ERA-NET ACT programme, aims to develop prospective revenue streams and business models for CO2-EOR in South-Eastern Europe (SEE), thereby supporting large-scale CCUS deployment in the region. The project is carried out locally in three SEE countries: Turkey, Romania and Greece with support from TNO, the Netherlands and IRIS, Norway. The objective of the project is to support deployment of CCUS by screening the available data, developing CCUS roadmaps and exploring for potential CO2-EOR pilots in the SEE area. The project team will assess the whole revenue stream and focus on optimization of the CO2-EOR combined with permanent CO2 storage (Enhanced Oil Recovery with Storage) as a single, undividable process. This report prepares provides a starting point for these activities, by presenting an overview of the status of CCS, in a wide context, in Romania, Turkey and Greece. The impacts of the findings presented in this report for the ERA-NET ACT ECO-BASE report are several. Several recent reports are available that present potential scenarios for the development of CCS in Romania and Greece. These will be used as starting points, updated where possible and extended with more detail on the aspect of CO2-EOR and CCS. However, data on the subsurface are not readily available in Romania or Turkey. This will impact the level of modelling that can be done to arrive at a reliable estimate of the feasibility of CO2-EOR (CO2 utilisation) and of its potential in supporting the development of CCS (CO 2 storage). There is potential in supporting the inclusion of CCS in national policies of Turkey and Greece, by providing a description of the potential of CO 2-EOR in developing a CCS industry. Neither country has included CCS in its climate-related policies yet.
Public introduction (*) The ECO-BASE project, funded under the ERA-NET ACT programme, aims to develop prospective revenue streams and business models for CO2-EOR in South-Eastern Europe (SEE), thereby supporting large-scale CCUS deployment in the region. The project is carried out locally in three SEE countries: Turkey, Romania and Greece with support from TNO, the Netherlands and IRIS, Norway. The objective of the project is to support deployment of CCUS by screening the available data, developing CCUS roadmaps and exploring for potential CO2-EOR pilots in the SEE area. The project team will assess the whole revenue stream and focus on optimization of the CO 2-EOR combined with permanent CO2 storage (Enhanced Oil Recovery with Storage) as a single, undividable process. This report prepares provides a starting point for these activities, by presenting an overview of the status of CCS, in a wide context, in Romania, Turkey and Greece. The impacts of the findings presented in this report for the ERA-NET ACT ECO-BASE report are several. Several recent reports are available that present potential scenarios for the development of CCS in Romania and Greece. These will be used as starting points, updated where possible and extended with more detail on the aspect of CO2-EOR and CCS. However, data on the subsurface are not readily available in Romania or Turkey. This will impact the level of modelling that can be done to arrive at a reliable estimate of the feasibility of CO2-EOR (CO2 utilisation) and of its potential in supporting the development of CCS (CO 2 storage). There is potential in supporting the inclusion of CCS in national policies of Turkey and Greece, by providing a description of the potential of CO 2-EOR in developing a CCS industry. Neither country has included CCS in its climate-related policies yet.
Page 1
TABLE OF CONTENTS Page
1
INTRODUCTION .........................................................................................................2 1.1 Reading guide ...................................................................................................2
2
CURRENT STATUS OF CCS IN EUROPE ............................................................3
3
TURKEY ........................................................................................................................5 3.1 Introduction ........................................................................................................5 3.2 Status of CCS ....................................................................................................6 3.2.1 National policy .......................................................................................6 3.2.2 Regulatory issues..................................................................................7 3.2.3 CCS and CCUS Projects .....................................................................7 3.2.4 Emission ...............................................................................................11 3.2.5 Data and databases............................................................................14 3.2.6 Studies ..................................................................................................15 3.2.7 Public awareness ................................................................................18 3.3 Conclusion .......................................................................................................18
4
ROMANIA ...................................................................................................................19 4.1 Introduction ......................................................................................................19 4.1 Status of CCS ..................................................................................................22 4.1.1 National policy .....................................................................................24 4.1.2 Regulatory issues................................................................................30 4.1.3 Projects .................................................................................................31 4.1.4 Emission ...............................................................................................36 4.1.5 Data, databases ..................................................................................37 4.1.6 Studies ..................................................................................................37 4.1.7 Roadmap for CCS in Romania .........................................................39 4.1.8 Public awareness ................................................................................42 4.2 Conclusion .......................................................................................................42
5
GREECE .....................................................................................................................43 5.1 Introduction ......................................................................................................43 5.2 Status of CCS ..................................................................................................45 5.2.1 National policy .....................................................................................45 5.2.2 Regulatory issues................................................................................46 5.2.3 Regulatory barriers .............................................................................47 5.2.4 Projects .................................................................................................48 5.2.5 R&D projects ........................................................................................49 5.2.6 Emission ...............................................................................................50 5.2.7 Data, databases ..................................................................................63 5.2.8 Scoping studies for CCS ....................................................................64 5.2.9 Public awareness ................................................................................66 5.3 Conclusion .......................................................................................................67
6
DISCUSSION .............................................................................................................68
7
BIBLIOGRAPHY ........................................................................................................69
D
Copyright © ECO-BASE Consortium 2017-2020
Page 2
1
INTRODUCTION
The Paris Agreement calls for greenhouse gas emission pathways consistent with keeping the increase in the global average temperature to well below 2°C above pre-industrial levels and pursuing efforts to limit the increase to 1.5 °C. Storing CO2 is an essential part of reaching this target and commercial utilization of CO2 is one of the mechanisms to create a business case for the storage process. At the moment CO2-EOR is the only utilization scenario capable of continuously utilizing significant volumes of carbon dioxide, creating a revenue stream and allowing smooth transition into permanent storage and deployment of large scale CCUS. ECO-BASE aims to develop prospective revenue streams and business models for CO 2-EOR in South-Eastern Europe (SEE) and therefore to support large-scale CCUS deployment in the region. The project is carried out locally in three SEE countries: Turkey, Romania and Greece with support from TNO, the Netherlands and IRIS, Norway. The objective of the project is to support deployment of CCUS by screening the available data, developing CCUS roadmaps and exploring for potential CO2-EOR pilots in the SEE area. The project team will assess the whole revenue stream and focus on optimization of the CO 2-EOR combined with permanent CO2 storage (Enhanced Oil Recovery with Storage) as a single, undividable process. ECO-BASE will access this potential through a number of activities: • For Romania, Turkey and Greece, create an inventory of CO 2 sources (potential capture projects) and sinks (potential sites for geological storage and for CO 2 utilization through enhanced oil production with permanent storage); • Perform case studies as a reference for country-wide EOR potential assessment, identify and prepare solid business cases and CCUS revenue streams; • Set up country-based roadmaps for CCS, with a key accelerator role for CO 2-EOR; • Organize knowledge transfer workshops for local CCS stakeholders. This document prepares for the first activities, by presenting an overview of the status of CCS, in a wide context, in Romania, Turkey and Greece. 1.1
Reading guide Section 2 provides a description of current CCUS activities in Europe, focusing on North-West Europe; these activities will be guiding the ECO-BASE project. An overview of Turkey, Romania and Greece is given in Sections 3, 4 and 5, respectively, to provide background information on current emission levels, industrial activities, as well as on current understanding of the role of CCS in future energy systems and in reaching emission reduction targets. Section 6, finally, summarises the main conclusions and provides an outlook on the implications for ECO-BASE.
D
Copyright © ECO-BASE Consortium 2017-2020
Page 3
2
CURRENT STATUS OF CCS IN EUROPE
Carbon capture and storage (CCS) has a high potential of reducing CO2 emissions. In Europe, it is currently a slow-moving technology, although its potential is recognized at both the Commission level and at the Member State level. About a decade ago, the EC launched its EEPR programme, with the aim to develop full-chain CCS demonstration projects1. Unfortunately, in July 2017 the last remaining project announced its cancellation 2. At present, the only CO2 storage projects in operation in Europe are the Sleipner and Snøhvit projects in Norway. Nevertheless, CCS remains to be regarded as an essential element of the mix of technologies that will be needed to reach the emission reduction targets set out in the Kyoto Protocol. New initiatives are being developed in Norway (the Norwegian CCS Initiative 3), in the UK4 and The Netherlands. Storage potential has been mapped at varying levels of detail in the North Sea (e.g., Norway5, the United Kingdom 6, The Netherlands7) and the potential for CO2 enhanced oil recovery has been the subject of research for several decades. A recent example of the latter is a Joint Industry Project led by SCCCS8. As far as CO2 transport and storage is concerned, activities have been ongoing for the past decade that investigate the potential for economies of scale by developing networks that provide transport and storage service to industrialized regions within countries, as well as for on a larger scale; see, for example, (Element Energy, 2010) (Neele, et al., 2013). In 2009, an EU-wide database of CO2 storage options was set up, containing information on storage options including depleted fields, saline formation and unminable coal seams (Vangkilde-Pedersen, et al., 2009). This database was updated (Poulsen, et al., 2015) and is currently being converted to a public and online available database by JRC. A number of EU Member States is currently organized in a working group that has developed an Implementation Plan for CCS and CCU, for the targets set out in the SET-Plan9. The targets and activities agreed on in the plan include setting up a European Storage database and Atlas, developing demonstration projects and defining national CCS and CCU roadmaps. The plans set out in the Implementation Plan can benefit from the CO2 transport Projects of Common Interest (PCIs) that have recently been approved by the EC and that are now eligible for funding through the Connecting Europe Facilitiy (CEF) 10. These PCIs aim to connect industrial regions, such as Rotterdam (The Netherlands) and Teesside (UK) to offshore storage capacity, supporting national roadmaps.
1
See, for example, http://ec.europa.eu/energy/eepr/projects/files/carbon-capture-and-storage/ccs-eeprsummary_en.pdf. 2 See https://www.portofrotterdam.com/en/news-and-press-releases/road-project-to-be-cancelled-ccs-tocontinue. 3 https://www.regjeringen.no/contentassets/3652c303169e46e7815617adab685710/gassnovas-pre-feasibilitystudy.pdf. 4 https://www.gov.uk/government/news/government-reaffirms-commitment-to-lead-the-world-in-cost-effectiveclean-growth. 5 See http://www.npd.no/en/Topics/Storage-and-use-of-CO2/. 6 Online CO2 storage atlas is available at http://www.co2stored.co.uk/home/index. 7 http://hub.globalccsinstitute.com/sites/default/files/publications/101121/transport-storage-economics-ccsnetworks-netherlands.pdf 8 http://www.sccs.org.uk/expertise/reports/co2eor-joint-industry-project. 9 http://ec.europa.eu/energy/en/topics/technology-and-innovation/strategic-energy-technology-plan. 10 See, for information and more detail, https://ec.europa.eu/energy/en/consultations/consultation-list-proposedprojects-common-interest-cross-border-carbon-dioxide.
D
Copyright © ECO-BASE Consortium 2017-2020
Page 4
The present report supports the development of CCS roadmaps in SE Europe, by pulling together available data and reports, which will serve as the starting point for further work towards national CCS and CO2-EOR roadmaps in the countries involved, Turkey, Romania and Greece. Further on in the ECO-BASE project, ongoing activities in NW Europe will be used as guideline, such as the PCIs and the development of national CCS roadmaps.
D
Copyright © ECO-BASE Consortium 2017-2020
Page 5
3
TURKEY
3.1
Introduction Turkey as an OECD member country was listed among the developed countries in the Annex-I and Annex-II of the United Nations Framework Convention on Climate Change (UNFCCC) (United Nations, 1992), when it was accepted in 1992. During the seventh session of the Conference of the Parties (United Nations, 2002) in Marrakech Morocco, Turkey was excluded from the Annex-II list, but remained in the Annex-I. Turkey has joined the UNFCCC as a party in 24 May 2004. Following the 5386 numbered legislation accepted in the Turkish National Assembly in 5 February 2009 and Cabinet Decision in 13 May 2009, Turkey became a part of the Kyoto Protocol. However, as Turkey was not a part of UNFCCC at the signing of the Protocol, it was not included in the Annex-B of the Protocol where the emission targets are set. Therefore, Turkey has no emission limitation or reduction obligations in the first (2008-2012) or second (2012-2020) commitment periods. Based on the Higher Planning Council approved “National Climate Change Strategy for Turkey” document (T.R. Ministry of Environment and Urbanization, 2010) a National Climate Change Action Plan (T.R. Ministry of Environment and Urbanization, 2012) has been prepared by the coordination of the Ministry of Environment and Urbanization. The strategy is defined as follows: “Turkey’s national vision within the scope of “climate change” is to become a country fully integrating climate change-related objectives into its development policies, disseminating energy efficiency, increasing the use of clean and renewable energy resources, actively participating in the efforts for tackling climate change within its “special circumstances”, and providing its citizens with a high quality of life and welfare with low-carbon intensity.” The purposes and objectives of the action plan are divided into different sectors, such as energy, building, industry, transportation, waste, agriculture, land use and forestry. The aims for the adaptation to climate change are also explained separately. Reductions of greenhouse gas emissions are targeted in vegetal and animal production, new settlements and industrial processes. In the building sector, 10% less emission comparing to existing settlements is aimed. However, in other sectors there is no set value for the emission limitation. Increasing the sequestration of carbon in forestry by 15% of the 2007 value, using clean coal technologies, increasing the energy efficiency, and increasing share of renewable energy are among the mitigation plans. Climate Change Strategy 2010 – 2023 document (T.R. Ministry of Environment and Urbanization, 2010) sets the aim for greenhouse gas emissions from electricity generation. They are envisaged to be 7% less than what they would have been in the Reference Scenario by 2020. In 2007, First National Communication of Turkey on Climate Change report (T.R. Ministry of Environment and Forestry, 2007) was prepared by the Ministry of Environment and Forestry (changed to Ministry of Environment and Urbanization). The energy sector with a share of 76.7% is the largest GHG emitting sector. The GHG emission has reached to 296.6 Tg (296.6 Mt) CO2 eq (excluding land-use change and forestry, LUCF) at 2004. Waste disposal and industry sectors follow with shares of 9.3% and 8.9% respectively (see Figure 1). On 25 May 2015, Turkish Statistical Institute released Turkey’s total greenhouse emission and emission per capita values (Türkiye İstatistik Kurumu, 2015). Total GHG emission for 2013 is given as 459,1 Mt (459,1 Tg) CO2 eq. The main share of GHG comes from energy sector as 67.8%. Industrial processes, agriculture sector, and waste follow with shares of 15.7%, 10.8%, and 5.7%, respectively. Although the energy sector keeps the main share, its share decreases due to the shift from coal to natural gas in electricity production and residential use and introduction of alternative sources.
D
Copyright © ECO-BASE Consortium 2017-2020
Page 6
Türkiye İst at ist ik Kurumu, Seragazı Emisyon Envant eri, 20 13
13 /0 9 /2
Metaveri
Analitik Çerçeve, Kapsam, Tanımlar ve Sın Verinin kapsamı
Figure 1. Sectoral GHG and Removals between 1990 and 2004 (T.R. Ministry of Environment and Forestry, 2007) Hesaplama Kuralları
Seragazı Emisyon Envanteri, 2013 Temel Veri Kaynaklarının Niteligi toToplam the National Communication report (T.R. Ministry of Environment and Forestry, seragazı emisyonu 2013 yılında 459,1 Mt CO2 eşdeğeri olarak hesaplandı Derleme uygulamaları 2007), Saat: 10:00 CO2 accounts 81.6% of the greenhouse gases. Methane has a share of 15.6%. N 2O and Envanter sonuçlarına göre, 2013 yılında toplam seragazı emisyonu CO olarak 459,1 ton 2 eşdeğeri F gases follows with 1.9% and 1.0% shares. It is reported that Turkey had a milyon 3.3 tonne CO2 Revizyonlar (Mt) olarak hesaplandı. 2013 yılı emisyonlarında CO2 eşdeğeri olarak en büyük payı %67,8 ile enerji emissions per capita in 2003. Turkish Statistical Institute released data (Türkiye İstatistik kaynaklı emisyonlar alırken, bunu sırasıyla %15,7 ile endüstriyel işlemler ve ürün kullanımı, %10,8 ile tarımsal faaliyetler ve %5,7 atıkcapita takip etti. CO2 emissions was 6.04 tonne per capita in 2013 Kurumu, 2015) shows that the ile per (see Diger konular Figure 2). The emission values for the period of 1990 and 2003 are calculated using IPCC Kişi başı seragazı emisyonları arttı Dipnotlar Guide (IPCC, 2006). The emission inventory contains the CO2, CH4, N2O, and F-gases, as well CO2 eşdeğeri olarak 2013 toplam seragazı emisyonu 1990 yılına göre %110,4 artış gösterdi. 1990 as indirect emission sources of yılı NO x, non-methane volatile organic compounds, CO and SO 2 yılında kişi başı CO2 eşdeğer emisyonu 3,96 ton/kişi olarak hesaplanırken, bu değer 2013 yılında 6,04 emissions from energy sector, industrial applications and product usage, agricultural activities, ton/kişi olarak hesaplandı. and waste. Sayı: 18744
According 25 Mayıs 2015
Figure 2. CO2 CO emissions per capita 1990 – 2013 (Türkiye İstatistik Kurumu, 2015) emisyonlarındaki en büyük payı enerji kaynaklı emisyonlar olu şturdu 2
3.2 3.2.1
CO2 emisyonlarının 2013 yılında %82,2’si enerjiden, %17,6’sı endüstriyel işlemler ve ürün kullanımından, %0,2’si tarımsal faaliyetler ve atıktan kaynaklandı.
Toplam Status of CCS
CH4 emisyonlarının %46,5’i tarımsal faaliyetlerden kaynaklandı National policy The targets set the National Change Action Plan (T.R. Environment and CH4 by emisyonlarının %46,5’iClimate tarımsal faaliyetlerden, %36,7’si atıktan, %16,8’i Ministry ise enerji ileofendüstriyel Urbanization,işlemler 2012) specific to emission ve ürün kullanımından kaynaklandı.of greenhouse gases can be listed as follows: • Building: N2O emisyonlarındaki en büyük payı tarımsal faaliyetler oluşturdu o OBJECTIVE B3.1. Reduce greenhouse gas emissions in new settlements by at N2O emisyonlarının %79,4’ü tarımsal faaliyetlerden, %8,4’ü enerjiden, %7,9’u atıktan, %4,3’ü ise least 10% per settlement in comparison to existing settlements (which are endüstriyel işlemler ve ürün kullanımından kaynaklandı. selected as pilot and the greenhouse gas emissions of which are identified until 2015) until 2023. AÇIKLAMALAR
D
Ulusal seragazı emisyonları, 2015 yılına kadar 1996 Hükümetlerarası İklim Değişikliği Paneli (IPCC) Rehberleri kullanılarak hesaplanırken, 2015 yılında 2006 IPCC Rehberlerine göre 1990-2013 dönemi Copyright ECO-BASE Consortium emisyonları hesaplanmış ve 1990-2012 dönemi verileri revize edilmiştir. ©Emisyon envanteri, enerji, endüstriyel işlemler ve ürün kullanımı, tarımsal faaliyetler ve atıktan kaynaklanan, doğrudan seragazları olan karbondioksit (CO2), metan (CH4), diazotmonoksit (N2O) ve F-gazları ile dolaylı seragazları azotoksitler (NOx), metan dışı uçucu organik bileşikler (NMVOC), karbonmonoksit (CO) ve kükürtdioksit (SO2) emisyonlarını kapsamaktadır.
2017-2020
Page 7
•
•
•
Transportation: o OBJECTIVE U2.1. Limiting emission increase rate of individual vehicles in intracity transport. o OBJECTIVE U5.1. Building a well-organized, reliable and sustainable information infrastructure with transport and travel data including GHG emission data, until the end of 2016. Industry: o OBJECTIVE S1.1. Making legal arrangements for energy efficiency and limitation of greenhouse gas emissions. o OBJECTIVE S1.2. Limiting GHG emissions originating from energy usage (including electrical energy share) in the industry sector. o OBJECTIVE S2.1. Developing the financial and technical infrastructure for limitation of GHG emissions. o OBJECTIVE S2.2. Develop and use new technologies for limitation of GHG emissions in the industry sector until 2023. o OBJECTIVE S3.1. Building the information infrastructure for limitation of GHG emissions in the industry sector until 2015 Agriculture: o OBJECTIVE T2.1. Identify the potential GHG emissions limitation in agriculture sector o OBJECTIVE T2.2. Decrease the increase rate of GHG emissions originating from vegetal and animal production.
There are no direct references found for CCS in national policy documents, such as Climate Change Strategy 2010 – 2023 (T.R. Ministry of Environment and Urbanization, 2010), National Climate Change Action Plan (T.R. Ministry of Environment and Urbanization, 2012) or Turkey’s National Climate Change Adaptation Strategy and Action Plan (T.R. Ministry of Environment and Urbanization, 2012). However, supporting clean technology research and development in the context of renewable energy sources is set as an action plan. The only mention of CCS is in the Ministry of Energy and Natural Resources, Directorate of Renewable Energy web page to give information about the concept (Yenilenebilir Enerji Genel Müdürlüğü, 2012). 3.2.2
Regulatory issues There is no law that regulates CCS. The usage of the subsurface is regulated by General Directorate of Petroleum Affairs according to the Turkish Petroleum Law number 6491 accepted on 30 May 2013. Mainly, the law regulates the exploration, development and production of petroleum sources. The law states that CO2 that is produced from the petroleum fields could be used for enhanced oil recovery purposes. In order to use a petroleum field as a storage medium, it should be depleted completely, and the consent of the Directorate should be obtained. If a field could be used technically as a storage medium, for other energy activities and at the same time for petroleum production, it is allowed. Otherwise the Ministry would choose the usage purpose. As a state corporation, Turkish Petroleum has the rights and duties to perform all petroleum related activities such as exploration, drilling, production, transportation, storage and refining. There is no regulatory barrier that directly prevents the usage of the subsurface for CO2 storage purposes.
3.2.3
CCS and CCUS Projects There are no CCS projects performed so far in Turkey. There are several CO 2 capturing and purification facilities from geothermal sources and underground natural sites that provide CO2
D
Copyright © ECO-BASE Consortium 2017-2020
Page 8
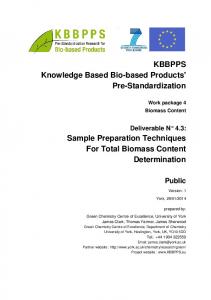
for the food industry. On the other hand, there are several enhanced oil recovery (EOR) projects done by the Turkish Petroleum Corporation (TP). Batı Raman CO2-EOR Project The first large-scale commercial CO2-EOR project in Turkey was started by Turkish Petroleum in 1986. The Batı Raman EOR project can be considered as one of the major immiscible CO 2EOR projects in the World. The project is still active and since 1986, TPAO has been injecting approximately 1 million tonnes/year of CO2 into the Garzan carbonates in the Batı Raman Field to improve the oil production rate and increase the ultimate recovery. The Batı Raman Field, with approximately 1,850 MM STB (300 million Sm 3) of initial oil in place (OOIP) is the largest oil field in Turkey. The Batı Raman Field was discovered in 1961 in Southeastern Turkey (Figure 3). The producing formation is Garzan limestone, a heterogeneous carbonate. The reservoir fluid is heavy crude oil with 9.7-15.1 API gravity and 450 to 1000 cp viscosity at reservoir conditions (Sahin, Kalfa, & Celebioglu, 2010). The initial reserve of the field was estimated to be 1.85·109 STB. Primary recovery driven by natural depletion was less than 2% of OOIP between 1961 and 1986. Only 32 MM STB (5 million Sm 3) of oil was produced prior to CO2 injection. As a result of low primary recovery and rapid decline in reservoir pressure, a suitable EOR method was needed.
Figure 3. Location of the Batı Raman Field (Issever, Pamir, & Tirek, 1993)
In 1986, the immiscible CO2 flooding project was commenced. The availability of an existing nearby natural CO2 field, Dodan gas field made the immiscible CO2 application more feasible. The Dodan gas field is approximately 89 km away from the Batı Raman Field and has a total gas reserve of 383 Bscf estimated (Sahin, Kalfa, & Celebioglu, 2010). Gas composition in the field includes predominantly CO2, H2S and trace gases of N2 and hydrocarbons. H2S content is in the range of 3500 ppm. CO2 was transferred to the Batı Raman Field by high pressure carbon steel pipeline. The natural CO2 used for the injection is treated in absorption and dehydration units to remove H 2S and water to approximately 90% purity. It was then compressed to 1750 psi (121 bar) and transported by pipeline to the injection site. At the injection site the CO 2 is further dehydrated and recompressed to 1350 psi prior to combining with the CO2 separated from the produced oil.
D
Copyright © ECO-BASE Consortium 2017-2020
Page 9
Between 1986 and 2012, 263 billion of standard cubic feet (7.5 billion Sm 3) of gas have been produced and pumped into the Batı Raman field. This amount is nearly 70% of the estimated original CO2 in place in the source field. The CO2 project started with a huff-and-puff application (injection-soak-production cycle for each well) later converted to a traditional injection-production scheme in 1986 and extended to the whole field. After experiences obtained during the huff-and-puff application, it was decided that a gas drive application would be more beneficial, and the process was converted a gas drive. After 2 years of gas drive application, between the years 1988 and 1993, the gas injection was deployed throughout the field. In 1991, recycle compressors were installed and some of the produced CO2 was started to be recycled. 115.8 Bscf of CO2 was re-injected to the reservoir (Sahin, Kalfa, & Celebioglu, 2010). Between the years 1987-2012, 187 infill and step-out wells were drilled and daily oil production reached a peak of 14,000 STB in May 1992, which was 1,500 STB before the CO 2 injection application started. By the end of December 2011, the recovered cumulative production was 106.3 million barrels with additional oil obtained from CO2 injection (70.4 million barrels). The cumulative CO2 injection to the Batı Raman Field was 352.88 Bscf and the cumulative CO2 production was 252.9 Bscf. The heterogeneities and the unfavourable mobility ratios between CO 2 and the heavy oil cause inefficient sweep of the fractured carbonate reservoir. A pilot project, applying a fractureplugging gel has been performed in three wells in July 2002 (Karaoguz, Topguder, Lane, Kalfa, & Celebioglu, 2007). At the end of 2011, there were 240 production wells and 67 injection wells. Under CO 2 injection daily oil production grew to 7,000 STB/day (1,110 Sm 3/day) in 2012. The recovery of the field reached 6% the same year. The production was 7,000 STB/D and daily injection rate is 30-40 MMscf/D. The Batı Raman Field’s production and injection history is shown in Figure 4 (Sahin, Kalfa, & Celebioglu, 2010).
D
Copyright © ECO-BASE Consortium 2017-2020
Page 10
Figure 4. Production and Injection History of the Batı Raman Field (source: (Sahin, Kalfa, & Celebioglu, 2010).
Batı Kozluca CO2-EOR project Batı Kozluca Project is a CO2 injection project carried out by Turkish Petroleum Corporation (TP), which started with an evaluation study to screen applicable EOR methods in 2000. Batı Kozluca Field, located in Southeastern Turkey, was discovered in 1985. The heavy oil carbonate reservoir with 12.6 API was developed with 41 wells. In between 2003 to 2007, continuous immiscible CO2 injection was performed full field. The CO2 was supplied from a nearby natural CO2 source in the Camurlu Field. At the start of the project, primary recovery was about 3%, it reached above 4% after 5 years of injection (Sahin, Kalfa, & Celebioglu, 2010). In 2007, water alternating gas injection was started due to high gas oil ratios and low sweep efficiencies. The project increased the oil recovery from 5% to almost 7% and daily oil production increased by a 100% (Bender & Yilmaz, Full Field Simulation and Optimization Study of Mature IWAG Injection in a Heavy-Oil Carbonate Reservoir, 2014). Camurlu Field Pilot Project The Camurlu field has 380 MM STB of heavy oil (10-12 API) in place. Location of Camurlu Field is shown in Figure 5 (Bardon, Karaoguz, & Tholance, 1986). The oil zone in the field is underlain by the Mus formation, which contains CO2-rich natural gas. A pilot project was developed by injecting CO2-rich gas from the underlying reservoir in the field. CO2 in the Mus formation is a source for Camurlu and Ikıztepe field pilot tests and Batı Kozluca Field full field CO2 injection project. Although a huff & puff CO2 application was carried out, desired amounts of gas could not be injected in the planned time since the surface facilities were inadequate. As a result, project was not continued (Sahin, Kalfa, & Celebioglu, 2010).
D
Copyright © ECO-BASE Consortium 2017-2020
Page 11
Figure 5. Location of Camurlu Field (Bardon, Karaoguz, & Tholance, 1986)
Ikizdere Field Pilot Project Another pilot application has been performed in Ikiztepe field (Figure 6), where extremely low primary recovery of only 0.07% of the original oil in place due to low gravity and high viscosity oil causing high water cuts. The field contains 127 MMSTB original oil in place of 10-12 API. In 1987, a CO2-EOR pilot test carried out by Japan National Oil Corp and Turkish Petroleum in association with JEORA showed an improvement in oil viscosity (Sahin, Kalfa, & Celebioglu, 2010). By three cycles of CO2 huff & puff, 6.86 MMSCF gas was injected and 921 bbls of oil was recovered (Ishii, Sarma, Ono, & Issever, 1997). It is concluded that high solubility of CO2 in the reservoir oil was the dominant factor affecting recovery.
Figure 6. Location of Ikizdere Field (Ishii, Sarma, Ono, & Issever, 1997)
3.2.4
Emission According to Turkish Statistical Institute, the total CO2 emissions in Turkey were 383.4 million tonnes in 2015 (Türkiye İstatistik Kurumu, 2017). Energy industry had the highest contribution to CO2 emissions with a ratio of 86.1%. Industrial processes and product use had the second place with a ratio of 13.7%, followed by agricultural and waste disposal operations (0.2%). Energy production, manufacturing industries and construction, and transportation are the main sources of CO2 emissions in the energy industry. In industrial processes and product use, the following are the main sources of CO2 emission: mineral products, chemical industry, metal production, and non-energy products from fuels and solvent use. Urea applications compose the agricultural CO2 emissions and open burning of waste composes the waste disposal CO 2 emissions. Table 1 shows the CO2 emissions by industries and volumes.
D
Copyright © ECO-BASE Consortium 2017-2020
Page 12
Table 1
CO2 Emissions in 2015 (Türkiye İstatistik Kurumu, 2017).
Energy Industry
Industrial Processes Product Use
Agriculture Waste Disposal TOTAL
Energy Production
and
135.8 million-tonnes
Manufacturing Industries 57.4 million-tonnes and Construction Transportation 74.3 million-tonnes Other Sectors 62.7 million-tonnes Total 330.2 million-tonnes (86.1%) Mineral products 37.7 million-tonnes Chemical industry 2.7 million-tonnes Metal production 11.6 million-tonnes Non-energy Products from 0.3 million-tonnes Fuels and Solvent Use Total 52.3 million-tonnes (13.7%) Urea Applications 0.8 million-tonnes Total 0.8 million-tonnes (0.21%) Open Burning of Waste 0.5 million-tonnes Total 0.5 million-tonnes (0.00013%) 383.4 million-tonnes of CO2
Most of the energy production in Turkey is provided from fossil sources such as coal, natural gas, and oil. In 2016, 32.1% of the total electricity production of Turkey was obtained from natural gas, and 33.9% from coal (T.R. Ministry of Energy and Natural Resources, tarih yok). So, it is straightforward to say that regions having more fossil fuelled power plants will contribute more to the CO2 emission. The map in Figure 7 shows the locations of natural gas and coal combustion power plants. It is clearly seen that those plants are mainly located in west and north-west regions of Turkey. In these regions, the CO2 emissions are higher than the rest of the country.
D
Copyright © ECO-BASE Consortium 2017-2020
Page 13
Figure 7. Locations of Combustion Power Plants (Aslanoğlu & Köksal, 2012).
In addition to energy production plants, some other industrial facilities such as cement factories, steel processing factories, and refineries produce significant amounts of CO2. Figure 8 and Figure 9 show the locations of these factories. Again, west and north-west regions of Turkey have the higher number of those factories since those regions are more developed and more crowded compared to rest of the country.
Figure 8. Locations of Cement Factories (Türkiye Çimento Müstahsilleri Birliği, tarih yok).
D
Copyright © ECO-BASE Consortium 2017-2020
Page 14
Figure 9. Locations of Steel Factories (Türkiye Çelik Üreticileri Derneği, 2016).
3.2.5
Data and databases The permits of a field that will be used for petroleum or natural gas exploration and production is given by the General Directorate of Petroleum Affairs (PIGM) in Turkey. The mining related underground usage licenses are given by the General Directorate of Mining Affairs (MIGM). The General Directorate of Mineral Research and Exploration (MTA) aims to explore the surface or underground for available natural resources other than petroleum. On the other hand, another state corporation Turkish Petroleum Corporation’s (TP) purpose is to explore and produce petroleum and natural gas resources available in Turkey. The license holders, either state corporation or private company, are bound to give the data related with their exploration, drilling, and production to the PIGM or MIGM. Some geological or geophysical data and maps, even some shallow underground data could be obtained from MIGM through the Turkish Earth Sciences Information and Core Bank (TUVEK). However, most CCS related data is obtained by petroleum related studies by either TP or other private companies in Turkey. The data gathered by those parties are available from by PIGM after the fifth year of operating license for a fee determined by the PIGM. These data includes well logs, core and cuttings data, coordinate information, gravity, and seismic data where available. There is no CCS database constructed for Turkey so far. The only study related with CCS is done for the General Directorate of Energy Affairs and coordinated by Middle East Technical University (METU) – Petroleum Research Center (PAL) (Okandan E. , et al., 2009). The findings of the study were presented at the International Conference on Greenhouse Gas Technologies (GHGT)-10 and a paper has been published (Okandan E. , et al., 2011). The possible storage sites are shown as given in Figure 10. The possible storage sites include abandoned or mature oil and gas fields, deep aquifers, soda mine salt caverns, coal bed methane (CBM) sites and natural CO2 fields. It was concluded that the most reliable storage options are the depleted gas and oil fields and natural CO2 sites. The Dodan field, a natural CO2 site with a 7 billion Sm3 capacity, could be an effective storage medium.
D
Copyright © ECO-BASE Consortium 2017-2020
Page 15
Figure 10. Possible geological storage sites for CO2 in Turkey (Okandan E. , ve diğerleri, 2011).
3.2.6
Studies A project entitled as “Assessment of CO2 Emissions from Industrial Facilities, Geological Storage Options and Storage Modeling of an Oil Field” was carried out with the support of The Scientific and Technological Research Council of Turkey (TUBITAK) in the years 2007-2009 (Okandan E. , ve diğerleri, 2009). The project was carried out by METU-PAL and Turkish Petroleum Corporation for the Ministry of Energy and Natural Sources. In the project, possible geologic sites for CO2 storage were evaluated and CO2 emissions from thermal power plants with capacities larger than 500 MWe, cement factories, steel industry, sugar factories and refineries in Turkey were calculated. In the emission calculations, IPCC methodology (IPCC, 2006) was used. The aim of the project included identifying potential geological formations available for CO2 storage and determining their storage capacity. Modeling the selected possible storage sites numerically and geologically and making an economic analysis were also the objectives of the project. During the project, oil and gas fields and deep saline aquifers in Turkey, Dodan Natural CO 2 field and Mersin Soda Industry salt caverns were investigated and suitability for storage for each was considered. Data about producing oil and natural gas reservoirs were confidential, as a result, only the fields licensed to Turkish Petroleum Corporation were studied and specified as confidential. Most of the oil fields in Turkey are located in the South East Region and natural gas fields are in the Thrace Basin Region. For this project the target was to look into oil fields in the Southeastern part of the country close to a power plant or cement factory. Considering the properties of the fields and coupling of sources and sinks resulted in a decision to use the emissions from a cement factory which is about 130 km from the selected oil field, Caylarbasi. The cement factory does not have capture facilities yet, but during modeling it was assumed that CO2 is available at the factory site. Technical and economical evaluations were realized for storage in Caylarbasi oil field in the Adiyaman region. Simulation studies of injection in the Caylarbasi oil field with additional wells to be drilled and injection were developed to be carried out for 20 years. According to the results of the modeling study, enhanced oil recovery effect of CO2 lasted 8 years and 2 million barrels of oil would be produced and the remaining 12 years were modelled as CO2 storage, which showed 220 million Sm3 of CO2 could be stored. Other possible storage sites were deep saline aquifers, which were encountered in Thrace Basin region, Central Anatolia and South Eastern Turkey. However, their capacity can be estimated if additional data becomes available from new wells to be drilled.
D
Copyright © ECO-BASE Consortium 2017-2020
Page 16
There are many graduate studies on storage options and capacities. In the study entitled as “Experimental and numerical investigation of carbon dioxide sequestration in deep saline aquifers”, computerized tomography (CT) results monitoring laboratory experiments were used to characterize relevant chemical reactions associated with injection and storage of CO 2 in carbonate formations (Izgec, 2005). In the study, porosity changes along the core plugs and the corresponding permeability changes were reported for varying CO 2 injection rates, temperature and salt concentrations. The experiments were modeled using a multi-phase, non-isothermal commercial simulator, where solution and deposition of calcite were considered by the means of chemical reactions and it was concluded that solubility and hydrodynamic storage of CO 2 is larger compared to mineral trapping. In the study of Basbug (Basbug, 2005), a simulation study was carried out regarding CO2 sequestration in a deep saline aquifer using the compositional numerical model (GEM) of the CMG software. The ability of the selected aquifer to accept and retain the large quantities of injected CO2 at supercritical state for long periods of time (200 years) was studied. In a singlewell aquifer model, the effects of parameters such as vertical to horizontal permeability ratio, aquifer pressure, injection rate, and salinity on the sequestration process were examined and the sensitivity analyses were performed. Ozgur (Ozgur, 2006) studied analytical and numerical modeling of CO2 sequestration in deep saline aquifers having different properties with diffusion and convection mechanisms. It is stated that in diffusion process, the dissolution of CO2 in aquifer increased with porosity increase; however, in convection dominant process dissolution of CO 2 in aquifer decreased with porosity increase. The increase in permeability accelerated the dissolution of CO2 in aquifer significantly, which was due to increasing velocity. In the study entitled “Simulating oil recovery during CO2 sequestration into a mature oil reservoir”, an oil field having a carbonate formation from Southeast Turkey was studied and considered as a candidate for enhanced oil recovery and CO 2 sequestration. Conducting CMG/STARS simulation runs, it was concluded that oil recovery that is about 23% of OOIP in 2006 for field K, reached 43% of OOIP by injecting CO2 after defining production and injection scenarios (Pamukcu, 2006). In the study of Sınayuç, subsurface storage of CO2 in coal reservoirs and enhanced coal bed methane recovery (ECBM) from Amasra coalbed in Zonguldak coal basin are considered (Sinayuc, 2007). In the study, effects of adsorption, cleat spacing, compressibility, density, permeability, permeability anisotropy, porosity and water saturation parameters were examined in enhanced coalbed methane recovery by the simulation runs. It was found that cumulative methane production was enhanced with the injection of carbon dioxide (ECBM) approximately 23% of that of CBM recovery. It was also found that injected carbon dioxide amount of 5192 tonnes/year in base case was capable to sequester only 0.3% of the yearly carbon dioxide emission of Zonguldak Catalagzi Power Plant nearby. In one of the master studies entitled as “Development of a predictive model for carbon dioxide sequestration in deep saline carbonate aquifers”, a predictive model was created to estimate the CO2 storage capacity of the deep saline carbonate aquifers using published literature data (Anbar, 2009). To cover all possibilities, Latin Hypercube Space Filling Design was used to construct 100 simulation cases and CMG STARS was used for simulation runs. By using a least squares method, a linear correlation was found to calculate CO2 storage capacity of the deep saline carbonate aquifers with a correlation coefficient 0.81 by using variables found from literature and simulation results. Dalkhaa studied cap rock integrity in CO2 storage and identified the geochemical reactions of the dissolved CO2 in the synthetic formation water with the rock minerals of the Sayındere cap rock by laboratory experiments. It is concluded from the mineralogical investigation and fluid
D
Copyright © ECO-BASE Consortium 2017-2020
Page 17
chemistry analysis of the experiments that calcite was dissolved from the cap rock core as a result of CO2-water-rock interaction (Dalkhaa, 2010). Another study on CO2 storage is entitled as “Chemical alteration of oil well cement with basalt additive during carbon storage application” (Jadid, 2011). In the study, chemical reactions of the dissolved CO2 in the synthetic formation water with the plugs of well cement and effects of basalt content were investigated experimentally. It is concluded that basalt as an additive to well cement can be beneficial in CO2 storage wells. Another study on CO2 storage is entitled as “Geochemical characterization of geothermal systems in Turkey as natural analogues for geological storage of CO 2” (Elidemir, 2014). This thesis is concerned with the geothermal systems of Turkey as natural analogues for CO 2 storage sites and the evaluation of their geochemical characteristics in terms of possible hydrogeochemical processes involved in CO2 storage. The results lead to the recognition of three different groups of geothermal systems with respect to the dominant trapping mechanisms: mineral trapping, solubility trapping. Bender (Bender, Optimization of CO2 EOR and storage design under uncertainity, 2016) studied flue gas injection in a heavy oil carbonate reservoir where CO 2-EOR had been applied. Effect of methane and CO2 were also studied and compared with flue gas injection. A compositional simulation model was developed. Storage capacity of the oil field as well as the contribution of raw flue gas injection, CO2 injection and natural gas injection to oil recovery were studied. Effect of injected gas type, gas solubility and operating parameters on storage and recovery were investigated. Results showed that pure CO 2 injection leads to higher oil recovery and CO2 storage, if injection continued for at least 25 years. In the study of Ors (Ors, 2012), carbon dioxide storage in hydrate form is investigated and Black Sea conditions are considered. The interaction of CO 2 and CH4 hydrate and the sealing efficiency of CH4 hydrate are studied experimentally. As a result of this study, it is concluded that methane hydrate stability region in the Black Sea sediments can be considered for the disposal of CO2. In the context of the TUBITAK KAMAG Project carried out in between 2007-2009, technical and economic feasibility of transport and storage of CO2 from a cement factory which is about 130 km from the selected storage field, Caylarbasi was considered (Okandan E. , ve diğerleri, 2009). The transportation phase was designed accepting that captured CO 2 would be available at the factory site and two alternatives, pipeline transport and transport by tanker were evaluated. In Caylarbasi field investment for the drilling of new producing wells and CO2 injection wells were considered as well as compressors and the CO2 recycling unit. Investment and operating costs for tanker transport and pipeline transport were calculated. Tanker transport were considered to be feasible because of the small amount of CO2 to be handled and the duration of the project. The economic analysis at 10% discount rate showed that at 100$ / barrel of oil value, it was found that it would be possible to produce for 6 years for the scenario of the project study. For the following years, incentives are necessary to cover injection costs so that project will continue up to 20 years. In the study of Gultekin (Gultekin, 2010), the feasibility of a potential CCS project where the source of CO2 is Afsin Elbistan Thermal Power Plant was conducted. CCS project was considered to be applied to Caylarbasi mature oil field, Midyat saline aquifer and Dodan CO 2 gas field. Disposing of CO2 from the source of Afsin Elbistan Thermal Power Plant was analyzed by pipeline and tanker and it is concluded that transportation by pipeline is more economical compared to tanker transportation. It is further found that the number of boosting pump stations, the length of the pipeline and CO2 mass flow rate are the issues that alter the economical aspect in the pipeline transportation.
D
Copyright © ECO-BASE Consortium 2017-2020
Page 18
The study done by Sahin et al. (Sahin, Kalfa, & Celebioglu, 2010) proposes to use CO2 captured from the industrial facilities located in Turkey to the neigbouring countries, such as Syria and Iraq for enhanced oil recovery purposes. 3.2.7
Public awareness A study has been carried out to understand the public awareness on climate change by the Ministry of Environment and Urbanization (T.C. Çevre ve Şehircilik Bakanlığı, 2012). The study is sponsored by a project called “Supporting the Preparatory Activities for the Second National Declaration Related with UNFCCC”. According to the survey study, 39.5% of the participants respond to the “What is Climate Change?” question as “change of season”. Nearly 75% of the participants have little or very little idea about the mitigation methods against the climate change. Carbon capture and storage is not mentioned in the study. In order to increase the awareness of the public, a CO2 Capture and Storage Regional Awareness-Raising Workshop have been organized by METU-PAL in June 2012 in Ankara (Okandan & Hladik, CGS-Europe, 2012). Besides, an educational brochure named as ‘What does geological storage of CO 2 really mean?’ is translated to Turkish in the context of same project named as Pan-European coordination action on CO2 Geological Storage (Saftic, Stead, & Kurelec, 2012).
3.3
Conclusion CCS concept in Turkey is not yet well understood and not taken into consideration in any national policy document. Therefore, there is no law regulating the usage of underground for the CO2 storage reasons. Although CO2-EOR is a well-known process applied by the state petroleum company since 1986, the only aim has been the increase of the petroleum recovery.
D
Copyright © ECO-BASE Consortium 2017-2020
Page 19
4
ROMANIA
4.1
Introduction Romania ratified the UNFCCC in 1994 and the Kyoto Protocol in 2001. Through these ratifications, Romania committed to a reduction in greenhouse gas emissions by 8% over the reference year 1989 for the period 2008-2012 and by 20% the 1990 reference year for the period 2013-2020 (Ministry of Environment, Water and Forests, Greenhouse Gas Inventory 1989 - 2014 National Report. (Romania's Greenhouse Gas Inventory 1989-2014 v.1), 2016). At the same time, Romania has the duty to develop and update the National Inventory of GHGs, which includes direct anthropogenic emissions (CO2, CH4, N2O, HFC, PFC, SF6, NF3) and indirect (NOx, CO, NMVOC and SO2). The latest version of this inventory is for the 1989-2014 period and it represents the 23rd edition. Compared with the reference year 1989, a significant reduction in greenhouse gases is recorded in 2011 (Figure 11), a gradual reduction with the transition to a market economy, the commissioning of the first Cernavoda reactor (1996) and the emergence of the economic crisis (Ministry of Environment, Water and Forests, Greenhouse Gas Inventory 1989 - 2014 National Report. (Romania's Greenhouse Gas Inventory 1989-2014 v.1), 2016). The evolution of GHG emissions has been and is in close correlation with the evolution of the energy sector, which is the largest GHG emission producer (Energy Ministry, 2016). Currently, GHG emissions in the energy sector are 300 gCO2 / KWh (Ministry of Environment, Water and Forests, Greenhouse Gas Inventory 1989 - 2014 National Report. (Romania's Greenhouse Gas Inventory 1989-2014 v.1), 2016).
Figure 11. Evolution of GHG emissions in the period 1989-2011 (Ministry of Environment, Water and Forests, Greenhouse Gas Inventory 1989 - 2014 National Report. (Romania's Greenhouse Gas Inventory 1989-2014 v.1), 2016).
D
Copyright © ECO-BASE Consortium 2017-2020
Page 20
The most important greenhouse gas is carbon dioxide, with a contribution of 67 % to total GHG emissions in Romania in 2014 (Ministry of Environment, Waters and Forests, 2016). CO 2 emissions in Romania fell from 209 Mt in 1989 to 73 Mt in 2014 due to a reduction in activity in the fossil fuel power sector (Ministry of Environment, Water and Forests, Greenhouse Gas Inventory 1989 - 2014 National Report. (Romania's Greenhouse Gas Inventory 1989-2014 v.1), 2016). Regarding the distribution of CO2 emissions (excluding forests and land use) by economic sectors, the highest emissions from 2011 (70% of total emissions) were recorded in energy production activities (Figure 12).
Figure 12. The distribution of CO2 emissions by economic sectors in 2011.
Reducing greenhouse gas emissions strategies in Romania At national level, Romania is determined to comply with its emission reduction commitments by applying the GES Emissions Trading Scheme (EU ETS), which regulates emissions from stationary industrial plants and by adopting emission reduction measures in all economic sectors. Romania's energy strategy for the period 2016-2030-2050 has as strategic objectives the increase of energy security, the development of competitiveness on the energy markets, the obtaining of cleaner energy with fewer emissions, the modernization of the energy management system and the consumer protection (Ministry of Energy, 2016). According to Romania's energy strategy, the reduction of GHG emissions in the energy sector, is intended to be made by the transition from fossil fuels to GHG-free technologies (renewable and nuclear) with a mid-stage replacement of coal with natural gas and adoption of unpolluted technologies, of which CCS (Ministry of Energy, 2016) is mentioned. It is specified in this strategy that CCS technology can help to keep the coal in the national energy mix. Also, to achieve emission reduction targets. All new coal-fired power plants will need to be equipped with CCS by 2035. The National Climate Change Strategy 2013-2020 (Ministry of Environment, Water and Forests, Romania's National Climate Change Strategy 2013 – 2020, 2012) presents measures to reduce GHG emissions for each economic sector, focusing on the electric and thermal energy generation sector. Several emission targets have been formulated for this sector, including encouraging the capitalization of renewable energy sources, increasing energy efficiency but also capturing and storing carbon as a solution to reduce GHGs (Ministry of Environment, Water and Forests, Romania's National Climate Change Strategy 2013 – 2020, 2012).
D
Copyright © ECO-BASE Consortium 2017-2020
Page 21
Romania's energy production Romania has a diversified energy mix, largely based on the local primary reserves (crude oil, natural gas, coal, uranium, renewable energies). According to the National Strategy energy of these resources, coal (especially lignite) is "a pillar of national energy security" (Ministry of Energy, 2016), showing a large contribution (over z quarter) in power generation. From the evolution of electric capacity in recent years ( Figure 13), there is a minor decrease of the contribution of coal in national energy mix, combined with an increase in the contribution of renewables (especially wind and solar power), but the trend is clear: storage of CO2 captured from coal fired power plant as an important source of energy production.
nuclear, coal, hydro, hydrocarbons, wind, solar, biogas, biomass, others (waste, geothermal) Figure 13. The evolution of the electric power installed during 2010-2015, according to the current licenses (ANRE, 2016).
In 2015, the total electricity production delivered in networks was 59.97 TWh (ANRE, 2016). From the analysis of the energy mix corresponding to 2015, it is observed that the role of coal is still maintained, although today most of the energy is obtained by hydroelectricity (Figure 14).
D
Copyright © ECO-BASE Consortium 2017-2020
Page 22
Figure 14. Structure by type of energy sources (energy mix) according to energy producers' reports for 2015 (ANRE, 2016).
According to ANRE's annual report, in 2015 there was an increase in energy produced and delivered from conventional sources compared to 2014, namely 18% for gas supplied and 2% for coal-based energy. A higher increase than in 2014 was recorded for renewable energy, 56% for photovoltaic power, 14% for energy delivered from wind power plants, and 12% for energy delivered from power plants based on biomass. The largest electricity producers in 2015, which produced over 68% of the total electricity delivered and consumed (ANRE, 2016), were Hidroelectrica (hydropower) with 27.11%, CE Oltenia (source thermoelectric) with 23.35% and Nuclearelectrica (nuclear source) with 18.27%. 4.1
Status of CCS The aspects related to greenhouse gas (GHG) emissions and climate change are considered as an important concern for Romania. The history of the CCS project started about 10 years ago, by actions taken both at companies level and at Governmental level. The first action was the affiliation of GeoEcoMar to ENeRG in 2001. From this point the specialists from GeoEcoMar began to constantly participate to international workshops, conferences and seminars with CCS topic. In 2004, GeoEcoMar accessed the first R&D project on CCS from FP6 with the acronym CASTOR in which the specialist of the institute made a first evaluation on the CO2 geological storage possibilities in Romania. 2006 marked the beginning of other two CCS R&D projects having GeoEcoMar as Romanian partner, EU GeoCapacity (2006-209) and CO2 Net East (2006-2010). Within EuGeoCapacity, GeoEcoMar made an evaluation of the CO2 storage capacity of Romania, contributing also to the first European database with CO2 sources and sinks. CO2 Net East main objective was to disseminate CCS knowledge within Eastern Europe.
D
Copyright © ECO-BASE Consortium 2017-2020
Page 23
Starting with 2007, GeoEcoMar had a representative in ZEP Governmental Group and founded the CO2 Club Association. Together with CO2 Club and other partners, GeoEcoMar organized 2 workshops “Promoting CCS in Romania”. Apart from these workshops, GeoEcoMar conducted other CCS dissemination activities, such as the translation into Romanian language of CCS brochures and animations, oral presentations and posters to prestigious conferences with CCS topic. GeoEcoMar interests in CCS public acceptance concretized in the participation to FENCO ERA project “Impact of communication” aiming at evaluating the degree of public CCS knowledge and acceptance in Romania. Starting with 2008, ISPE also has a representative in ZEP Advisory Council. In 2007, ISPE performed a research study regarding clean coal technologies for coal power plant for the Ministry of Economy, Trade and Business Environment (METBE) as beneficiary. The “Energy – Climate change” package released by EC on January 2008 was followed by several actions at Governmental level. So, the “Action Plan for preparing Romania for the “Energy-Climate Change” EU legislative package implementation” was co-initiated by METBE – Ministry of Economy, Trade and Business Environment, MEF – Ministry of Environment and Forests, MPF – Ministry of Public Finance, MERYS – Ministry of Education, Research, Youth and Sports, signed by the Prime Minister and released on July 2009. The Romanian Government provided the analysis on the impact of the „Energy-Climate Change” EC legislative package over the national industrial activities competitiveness. The analysis was performed by ISPE. From the beginning this action benefited of a great opportunity - the support from Global CCS Institute – Australia. An “Action Plan for implementing a Demo Project regarding the Carbon Capture and Storage in Romania” was initiated by METBE and signed by the Prime Minister, being released on February 2010. National selection of CCS demo project A national selection for CCS projects proposals was initiated by METBE, addressed to the all major CO2 generators in Romania. To this aim, the process started by METBE on 2010, the 1st of April concerning the submittal to nine companies generating significant CO 2 emissions (power plants, metallurgical plants, refineries and cement plants) of a request to provide information on or to express the intention to achieve a CCS demonstrative project. Only three companies responded to METBE initiative as follows: • CE Craiova to build a new unit of 500 MW at one of its power plant SE Isalnita and have a CCS demo project, too • CE Turceni to retrofit the Unit no. 6 of 330 MW and wants to implement a CCS demo project • HOLCIM, a cement plant, to participate only to the knowledge sharing process On 2010, the 10th of May, at the head-office of the METBE, a meeting was held for the national selection of the project representing Romania’s proposal for CCS demonstrative project. In the prioritization process the two projects for power units were taken into consideration. Knowing the necessity of a complex analysis, on the basis of different category criteria (emission level, transport distance, efficiency, costs, etc), ELECTRA multi-criteria analysis method was used. The advantages of this method are: • Lack of restriction regarding the criterion number and nature; • Simplicity; • Taking into account both positive and negative aspects. For prioritization five primary criteria were used, each including a number of sub-criteria. Prioritization criteria and sub-criteria are presented in Table 2.
D
Copyright © ECO-BASE Consortium 2017-2020
Page 24
Table 2
Prioritization criteria and sub-criteria.
Prioritization criteria Location
A
Prioritization sub-criteria
B C
CO2 stored quantity Threshold value achievement from Directive 31/2009/CE
D
Technical features of CCS demonstration project
E
Economic features of CCS demonstration project
A1. CO2 emissions level in location area (at county level) A2. CO2 transport distance to storage site A3. Preliminary investigations of geological storage sites B1. CO2 quantity (stored) C1. Installation capacity (higher than threshold condition of 250 MWe for electricity, respective 500 kt CO2/year for industrial installations C2. CO2 reducing efficiency D1. New/existing plant under ETS D2. Operational life of CO2 source D3. Plant efficiency before CCS D4. Year of CCS plant commissioning D5. Ways of CO2 transport D6. CO2 storage types E1. Total investment of CCS activities (capture, transport, storage) E2. Beneficiary investment rate of CCS installation E3. Unit cost = Investment / CO2 reduced quantity
In determining the nominal importance percentage for primary criteria were taken into account the importance of those criteria, related to the number of analyzed sub-criteria (Table 3). Table 3 Nominal importance percentages for primary criteria.
Prioritization criteria A
Location
Importance percentage 20%
B
CO2 stored quantity
20%
Very important role, include 1 criterion
C
Threshold value achievement from Directive 31/2009/CE Technical features of CCS demonstration project Economic features of CCS demonstration project
10%
Medium role, include 2 criterion
25%
Important role , include 6 criterion
25%
Very important role, include 3 criterion
D E
Comments Important role, include 3 criterion.
On the basis of information supplied by the two candidate projects operators, and available additional information, each sub-criterion was noted. Based on this national selection, a CCS Demo Project was decided to be developed in Romania, at the Turceni Power Plant. The CCS Demo Project is a Governmental project, benefiting also from GCCSI - Australia support. 4.1.1
National policy The Romanian Government established the strategic scope for the energy sector. The target consist of meeting both the current and the medium and long term energy demand, for the lowest
D
Copyright © ECO-BASE Consortium 2017-2020
Page 25
possible price, adequate to a modern market economy and to a civilized living standard, under quality and safety in supply conditions, in observance of the sustainable development principles. Romanian Energy Strategy for the period 2007 - 2020 has the following objectives: Energy security, by: • Lower dependence of imported energy through the use of national resources of lignite and hard coal, hydropower and wind power; • Import diversification of resources and the use of both nuclear fuel and natural gas; Sustainable development through: • Energy efficiency using modern technologies in the year 2015; • Promotion of electricity in hydroelectric and wind power; • Promotion of electricity and heat production in cogeneration plants using high efficiency technologies for natural gas; • Rehabilitation of transmission and distribution system correlated to buildings rehabilitation actions for reducing energy losses and the development of new intelligent buildings; • Reducing negative environmental impacts by promoting modern technologies with zero emissions. Competitiveness: • Development of markets for electricity, natural gas, uranium, green certificates, certification of greenhouse gas emissions; • Continuing restructuring the electricity and natural gas sectors; • Continuing restructuring coal sector to increase profitability and access to capital markets. The government’s most recent strategy in the sector highlights the need for enhancing the security of supply, utilization of locally available primary resources and enhancing the use of renewable energy. Reforms regarding the electricity market allowed a 100% opening of this market, both for industrial and for domestic users. Transport profile Romania has a national transportation system (infrastructure, transport equipment, etc.) largely at the same level with the average standards of conventional transport systems in Europe from the point of view of both the functional structure and services rendered. A strategic framework for sustainable transport policy in Romania has aligned European policy defined in the White Paper of transport11. In the transport sector, Romania holds a key position at the eastern border of the EU as a transit area both on the east-west direction (link to Asia via the Black Sea) and north-south (from the Baltic Sea to the Mediterranean Sea). Three of the TEN-T priority axes cross Romania. According to data from NIS at 31 December 2011 public roads totaled 83,703 km out of which 16,690 km (19.9%) were national roads, 35,374 km (42.3%) were county roads and 31,639 km (37.4%) were village roads. In 2012, Romania had only 504 km of highway; the road network is in very poor condition only 25,791 kilometers (32%) were upgraded by the end of 2011 and 34,963 km (41.8%) are still gravel and earth covered roads (see Figure 15). Status of road infrastructure and low density of public roads of 33.3 km per 100 km 2 in 2009 compared to the EU 25 average of 101.1 km to 100 km 2 in 2003 lead to enhanced distance,
11
Sustainable transport strategy for the period 2007÷2013 and 2020, 2030 approved by OMT no. 508/2008; 35. Intermodal transport strategy in Romania, May 2011 – draft.
D
Copyright © ECO-BASE Consortium 2017-2020
Page 26
traveling time and excessive fuel consumption, with harmful effects on the environment. In 2012, the European road length was 6188 km.
Source: Ministry of Environment and Forests National Environmental Protection Agency National report on the state of environment in 2011, Bucharest 2012 Figure 15. Roads map of Romania
Industry Romanian industry was severely affected by the transition from planned economy to market economy and the loss of existing market within Comecon. In the period 1990 - 2005 actions of restructuring and privatization of industrial enterprises were carried out. Undertakings that hadn't any market or couldn't handle economic competition had ceased their business. After 2008 due to the global economic crisis, some undertakings had ceased their business because of marketplace lack (metallurgical enterprises, heavy machinery businesses, etc.). After 1989, the Romanian economy experienced a structural adjustment. Thus, in 2000 the industry, agriculture and constructions have contributed by 46.43% to the formation of Gross Value Added against 67.8% which was the contribution thereof in 1990. We remark a relatively continuous course of increase of contribution of the services sector as against the other economic branches until the 2005 year. In Table 4 the evolution of the GVA per activities sectors in the 2000 – 2011 period is presented. It is noted that in the economic-development period of 2000 - 2007 the industry and agriculture sectors reduced their contribution to Gross value added as against the construction and services sectors. This direction is not kept in the crisis period. Taking into account the macroeconomic structures of the EU countries, which suffered a long restructuring process, we can conclude that, after the crisis, the direction of decrease of industry and agriculture contribution and GVA formation will be kept, but in lower measure.
D
Copyright © ECO-BASE Consortium 2017-2020
Page 27
Table 4 Contribution of different activities to GPD growth within 2000-2010 [%].
Indicator
2000
2005
2010
2011
TOTAL GVA out of which: Industry Agriculture Constructions Services
100 29.02 12.06 5.35 53.57
100 28.10 9.52 7.39 54.99
100 31.85 6.4 10.24 51.51
100 33.02 7.48 9.76 49.74
The main sectors of the Romanian economy are: industry, energy, construction, agriculture, tourism, communications (internet, mobile and landline phone), commerce, trade and public sector. Romania's main industries are: textiles and footwear, metallurgy, light machinery and assembly of machinery, mining, wood processing, building materials, chemical, food and oil extraction and refining. Pharmaceutical industry, heavy machinery and household appliances have a steady annual growth. Currently, the car industry is very wide and oriented towards the market. Romania's economic power is focused primarily on the production of goods by small and medium enterprises, in industries such as precision machinery, motor vehicles, chemicals, pharmaceuticals, household appliances and clothing. The evolution of Romania different industrial branched depends on the economic development of entire country and the area policies adopted within EU, as well as on the socio-economic context at world level. In Table 5 the evolution of the industrial contribution to GVA formation during 2000 - 2010 is presented and one should mention that the procession industry has the main share (approx. 80%). Important contributors to the GVA formation are the food industry, the industry of beverages and tobacco products (approx. 20%), industry of transportation (approx. 11%), energy industry (approx. 13%), and metallurgy industry (approx. 8%).
D
Copyright © ECO-BASE Consortium 2017-2020
Page 28
Table 5 Evolution of the contribution of different industrial branched to GVA formation
Indicator TOTAL GVA, of which: Extractive industry Manufacturing industry Food industry, industry of beverages and tobacco products Manufacture of textiles, clothes and leather goods Manufacture of wood and of the paper and polygraph goods Manufacture of coke oven products Manufacture of chemical substances and products Manufacture of basic pharmaceutical products Manufacture of rubber and plastic products and of other nonmetallic mineral products Metallurgical and metal products industry Manufacture of computers and electronic and optical products Manufacture of electric equipment Manufacture of machinery and equipment n.e.c. Transportation means industry Other industrial activities n.e.c. Generation and supply of electricity heating, gas, warm water and air conditioning Distribution of water, salubrity, management of waste and decontamination activities
2000 100% 7.98 80.68 24.57
2005 100% 5.28 85.39 24.35
2008 100% 4.38 85.41 23.17
2009 100% 4.90 82.2 22.10
2010 100% 5.84 76.17 19.48
8.15 9.44
9.10 7.01
7.30 6.36
6.40 6.30
7.46 5.44
3.78 6.08 0.00
5.00 6.24 0.00
3.98 2.53 0.83
2.87 2.07 1.19
1.11 1.13 0.19
0.00
3.81
8.18
7.11
3.41
7.48 12.26
7.42 5.59
8.57 3.21
6.55 3.59
8.04 5.75
0.00 0.00 4.21 4.73
0.00 4.32 8.46 4.09
3.56 3.07 10.57 4.09
3.42 3.06 13.62 3.93
3.73 3.00 11.23 6.20
10.00
8.52
8.21
10.16
13.06
1.35
0.81
2.00
2.71
4.92
Waste Waste management is one of Romania’s current issues. The integrated approach in waste management concerns waste collection, transport, treatment, capitalization and disposal activities and it includes the construction of waste disposal subsystems, together with measures on the prevention of their generation and recycling, in accordance with the hierarchy of principles: preventing waste generation and the negative impact thereof, waste recovery through recycling, reuse and the safe disposal of waste, when recovery is no longer possible. The responsibility for the waste management activities shall fall with the generators thereof, in accordance with the “polluter pays” principle, or, as appropriate, with the producers, in accordance with the “producer responsibility” principle. Each type of waste generated on the country’s territory shall be formally classified into one of the following categories: • Municipal waste; • Industrial waste; • Waste generated from medical activities. Municipal waste represents the totality of waste generated in the urban and rural environment by households, institutions, commercial units, businesses (household waste and similar), street waste collected from public spaces, streets, parks, green areas, building-demolition waste generated in households and collected by sanitation operators and sludge from the purification of municipal wastewater.
D
Copyright © ECO-BASE Consortium 2017-2020
Page 29
Table 6 presents the evolution of the amount of municipal waste generated during 20062010. Table 6 The amount of municipal waste generated during 2006-2010
2006 8,866.42 2,057.58 6,808.84 5,362.44 972.05 474.35
Total municipal waste generated, out of which: 1. waste generated and uncollected (estimated)* 2. municipal waste collected, out of which: - Domestic and biodegradable waste - From municipal services - Construction-demolition (including other types of waste)
2007 8,895.19 1,973.53 6,921.66 5,243.18 944.76 733.72
2008 9,251.00 1,879.83 7,371.17 5,669.12 889.23 812.82
2009 8,440.00 1,501.29 6,938.71 5,283.35 981.42 673.94
2010 7,073.42 1,250.10 5,823.31 4,572.06 753.75 497.51
Source: Ministry of Environment and Forests National Environmental Protection Agency – National report on the state of environment in 2011, Bucharest 2012 * The amount of waste generated and uncollected (generated by population that is not serviced by sanitation services) adds to the amount of municipal waste collected, in the table above. The amount of waste generated and uncollected was calculated depending on generation indexes established in PRGD, namely: 0.9 kg/location/day in the urban area and 0.4 kg/location/day in the rural area (Source: Medius database 2010).
Municipal waste management entails their collection, transportation, capitalization and disposal, including monitoring the storage facilities after closure. The responsibility for managing municipal waste belongs to the local public authorities who, directly or by concession of the sanitation service to an authorized service provider must insure the collection, selective collection, transportation, treatment, capitalization and final disposal of the waste. In Romania, storage represents the main municipal waste disposal option. Out of the total generated municipal waste, over 95% was stored in 2011. Following an assessment of waste storage facilities, in 2012, an inventory of 79 operating storage facilities, 49 non-conforming facilities and 30 facilities conforming to the directive’s storage requirements has resulted. The evolution of the storage facilitates’ in Romania is presented in Table 7. Table 7 Number of Storage Facilities in Romania in the year 2012
Facilities – year
2006
2007
2008
2009
2010
2011
2012
Conforming facilities
20
20
20
26
27
30
30
Nonconforming depth storage facilities
90
92
87
87
40
70
49
Nonconforming surface storage facilities
130
109
96
14
35
Source: National Environmental Protection Agency
Agriculture Agriculture is an important sector in the Romanian economy contributing during 2005 - 2011 with 7 – 10 % of GDP, depending on the year and climatic conditions. Although agriculture was collectivized by the government in 1949, a land reform program instituted in 1991 returned more than 80 per cent of the country's agricultural land to nearly 5.5 million small farmers. Romania had in 2011 a total agricultural surface of 14591 thousand ha of which 9,352 thousand ha surface was available for agriculture. Pastures and hayfields have also held important weights (22.5% respectively 10.7%). Vineyards and orchards, including nurseries accounted for the remaining 2.7% of agricultural surface. The Romanian agricultural surface decreased slightly from year to year. Transfer of land to forestry and building sector was the main cause of reducing agricultural area in the past 20 years. Land area was reduced through its inclusion in urban areas was met in areas with higher productivity while in less-favoured areas the forests took place to agricultural land.
D
Copyright © ECO-BASE Consortium 2017-2020
Page 30
4.1.2
Regulatory issues In 2005, the EU implemented a scheme for GHG emission allowances trading (EU ETS) aimed at achieving its Kyoto Protocol targets. The EU ETS represented the first mechanism for promoting the reduction of GHG emissions in a cost effective and economically efficient manner. The CCS Directive, as part of the EU Energy and Climate Change Package, reinforces the strong commitment at EU level to reduce GHG emissions (30% by 2020 and 60-80% by 2050), subject to the conclusion of an international agreement. Directive 2009/31/EC of European Parliament and of the Council of 23 April 2009 on the geological storage of carbon dioxide and amending Council Directive 85/337/EEC, European Parliament and Council Directives 2000/60/EC, 2001/80/EC, 2004/35/EC, 2006/12/EC, 2008/1/EC and Regulation (EC) nr. 1013/2006 was published in the Official Journal of the European Union L series no.140 dated 05 June 2009 end was due for transposition into national law by 25 June 2011. The European Commission issued on 31 March 2011 four guidance documents in order to assure a coherent implementation of the CCS Directive at the EU level. The European Commission invited representatives from each Member State to participate in the process of drafting the documents mentioned above. Romania had a team formed by experts from the Ministry of Environment and Forest and NAMR, as the future competent authority responsible for the implementation of the CCS Directive. The Romanian team was supported by the inter-ministerial Working Group experts, each time a point of view was needed. A Ministerial working group for transposition of Directive CCS was set up by Order MEF no. 323 of 03/10/2010 : MEF, NEPA, NEG, METBE, NAMR, NRAE, MI, DEA and as appropriate, to clarify technical issues, representatives of the Institute for Studies and Power Engineering, National Institute for Research - Development of Marine Geology and Geoecology and University of Bucharest - Faculty of Geology and Geophysics. The WG developed a draft GEO document. Transposition The Governmental Emergency Ordinance (GEO) no. 64 on the geological storage of carbon dioxide, which represents the transposition of the EU CCS Directive into Romanian national legislation, was published in the Official Gazette of Romania no. 461 on 30 June 2011. GEO no. 64/ 2011 specifies the relevant competent authorities responsible for fulfilling the obligations under the CCS directive. It empowered, the National Agency for Mineral Resources to undertake: Selection of storage sites (areas at the national level which may be selected for storage sites and assessment of the available storage capacity). Granting/ updating/withdrawing exploration permits and storage permits. Checking compliance with legal requirements during the operation, closure and post closure periods. Reporting and notification to the European Commission. Establishing and maintaining a register of granted storage permits. Third party access to storage sites (specific procedures will be developed). Specific procedures for CO2 storage activity. Approval of the transfer of responsibility. Checking the operator’s financial contribution. According to GEO No. 64/2011, the National Agency for Mineral Resources has to issue secondary legislation for implementation: Adoption of specific procedures for issuing exploration permits;
D
Copyright © ECO-BASE Consortium 2017-2020
Page 31
-
Adoption of specific procedures for issuing storage permits.
These procedures are to be endorsed by the Ministry of Environment and Forests. GEO no. 64/ 2011 also amends a number of other pieces of national legislation, in order to establish requirements on capture and transport operation and to remove existing barriers to the geological storage of CO2. 4.1.3
Projects Getica The Getica CCS Demo Project is a Governmental demonstrative project, officially supported by the Prime Minister and coordinated by the Ministry of Economy, Trade and Business Environment - METBE and supported by Global CCS Institute. The Getica CCS Demo Project is an integrated CCS project, comprising the full chain: capture, transport and storage of CO 2. The activity for implementing a CCS project in Romania has started based on the NER300 financing opportunity, and also based on other important considerations, notably: CO2 storage potential in Romania; more than 150 years of history in the oil and gas industry; great share of fossil fuels in electricity generation; target to reduce the CO2 emissions. From the beginning this action benefited from the support from the Global CCS Institute – Australia. The Feasibility Study has been performed by a technical consortium including Romanian and foreign companies, as follows: ISPE – Romania: project management and CO2 transport development (the later with support from INTETECH Consultancy – UK) Alstom Carbon Capture – Germany: CCP technology integration GeoEcoMar – Romania: CO2 geological storage, technology consultant Schlumberger Carbon Services – France: CO2 geological storage technology. Moreover, a detailed risk analysis, needed for the NER300 Application was performed with the support of OXAND-France. The project had to be implemented and operated by a new Project Company (PC), set up especially for this scope. The shareholders of the company were three existing companies, owned by the Romanian state as majority shareholder, with large experience in power generation field and oil & gas field (transport and storage): CE Turceni SA - electricity generation company SNTGN Transgaz SA - natural gas transportation company SNGN Romgaz SA - natural gas extraction/storage company Each of the companies covering one aspect of the project based on their expertise, namely CO 2 capture, transport and storage. The project was selected following a national ranking process for CCS projects proposals, initiated by METBE, addressed to the all great CO2 generators in Romania. The project was co-ordinated by an Inter-Ministerial Steering Committee established by METBE Order no 1508/2010 which includes representatives of METBE, MEF, MPF, NAMR, NASR, CE Turceni, SNTGN Transgaz, SNGN Romgaz. Regarding the CO2 capture plant, two technologies were compared, technically and economically: Chilled Ammonia Process (CAP) and the Advanced Amine Process (AAP), as they are the technologies furthest in development and closest to commercialization.
D
Copyright © ECO-BASE Consortium 2017-2020
Page 32
For the specific operating condition of Unit no. 6 the CO 2 Carbon Capture Plant based upon the absorption of the CO2 from the flue gases, using Alstom’s Chilled Ammonia Process (CAP) was selected. The CCP interfaces directly with various systems of the Turceni Power Plant. If the project was to be operational at that time , would have had a CO 2 capture rate of more than 85% from the flue gases flow. The CO2 transportation was to be performed by onshore pipeline. Dense phase CO 2 has been selected for long distance transportation, as being the most cost effective solution. A 40 km long pipeline is considered to transport the CO2 from the CCP to the injection area. The pipeline route has been determined considering specific constraints. The location of the storage site would have been chosen from two storage zones that have been investigated: Zone no. 5 and Zone no. 1 (from 11 zones initially assessed). During the Feasibility Study, available data was collected and interpreted. The preliminary results consist in seven CO2 potential sites, that were more deep analysed and two storage sites (Zone no. 1 and Zone no. 5) were selected. Based on the available data, Zone no. 5 appears to be the most suitable storage site and its related CO2 transport pipeline route is to be developed for this option. As a backup, Zone no. 1 could still be a possible storage site following an assessment based on further investigation. Preliminary performance and risk assessments have been conducted on both selected zones during Phase 1 (Feasibility Study) and this will serve as the base on which the characterization program for these two zones will be built and developed in the next phase of the project. Both potential areas are quite extensive and the main part of them is situated within a distance of 50 km from the Turceni Power Plant. The three Companies involved (CE Turceni, SNTGN Transgaz and SNGN Romgaz), sustained by METBE have been created and developed a Communication and Knowledge Sharing Strategy to: Implement successfully the CCS technology in Romania; Meet all stakeholders’ targets; Overcome social barriers, thus avoiding costs and schedule overruns; Accelerate the deployment of large scale CCS projects in the EU and worldwide. The learning, communication and knowledge sharing process with reference to the CCS technology started in Romania in 2001. Starting with 2010 there were events, communication and knowledge sharing activities in order to promote Getica CCS Demo Project at local, national, European and international level. The Project implementation would have contributed to maintain operational the power plants running on local lignite, which contributes to the security of supply, not only in Romania, but also in the region and Europe. It creates the possibility of extension of the CCS technology for all the power producers in the region (over 4,000 MW) on local lignite and other major CO2 emitters of industry (metallurgical, refinery, chemical, cement, etc). There is potential to develop the CCS transport & storage infrastructure for the industrial CO2 emitters in the region, at country and cross-border levels. The Bellona Foundation, a recognised technology and solution-oriented international environmental organization, has started at that time, the works on a CCS Roadmap in Romania, which proves the importance of CCS development in the country. Project location The project location was in Gorj county, in South West Development Region, Romania. The South West Development Region comprises five counties: Dolj, Olt, Valcea, Mehedinti and Gorj.
D
Copyright © ECO-BASE Consortium 2017-2020
Page 33
Figure 16. Project location
The Getica CCS Demo Project had to be implemented in the Turceni Power Plant, a base load power plant , one of the strategic electricity suppliers to Romanian National Power System. Turceni PP and the adjacent lignite mines are part of SC Complexul Energetic Turceni SA, a state owned company. The underground pipeline route from the CO 2 Capture Plant (CCP) and the onshore saline aquifer storage site are situated also in the South West Development Region. Feasibility Study consortium The Feasibility Study was performed by a technical consortium including: ISPE – Romania: project management and CO2 transport development (the later with support from INTETECH Consultancy – UK) Alstom Carbon Capture – Germany: CCP integration GeoEcoMar – Romania: CO2 geological storage Schlumberger Carbon Services – France: CO2 geological storage. Turnu - CO2 sequestration combined with EOR The project aims to assess the viability of CO2 separation during gas production and subsequent re-injection into the reservoir in order to increase oil and gas production while reducing the GHG emissions. The project focuses on the reservoir study, as well as on the pre-feasibility study of surface facilities.
D
Copyright © ECO-BASE Consortium 2017-2020
Page 34
Figure 17. Location of Turnu Field
D
Copyright © ECO-BASE Consortium 2017-2020
Page 35
Figure 18. Turnu Field – Reservoir Data
Reservoir properties include: • 662 wells, 359 producing; • CO2 up to 42%; • 850-1,100 meters depth; • 25 bar reservoir pressure; • 34,000 m3/d gas production; • 1,5 Bm3 already produced; • 2,7 Bm3 remaining gas reserves. Project Definition and Development Scenarios • Develop mixed gas caps in Turnu East (Blocks I/II) and Turnu South (Block III) simultaneously via existing wells plus up to 190 new wells • Separate CO2 phase on surface via new facilities and re-inject in Turnu South oil reservoir to enhance recovery • Total daily gas extraction estimated at a plateau rate of 350,000 m 3 will drain remaining reserves in ~ 10 years. • Up to 150,000 m3/d of CO2 will be re-injected in deeper reservoirs • Estimated investment of 47 million Euro and operating costs of 5 million Euro per annum.
D
Copyright © ECO-BASE Consortium 2017-2020
Page 36
Nucleu Project The Nucleu Project is a research project (from the Core Program) and is dedicated to assessing storage capabilities in Romania. 4.1.4
Emission In 2011, GHG emissions from the Energy industries have decreased by 50.75%, 36,621.9 Gg CO2 equiv compared to 74,355.62 Gg CO2 equiv in 1989 (base year) as a result of transition to a market-based economy, which led to a sharp drop in electricity production demand from power plants.
Figure 19. Energy sub-sectors emission/ removals trend for the period 1989-2011
GHG emissions from the Manufacturing Industries and Construction have decreased by 77.51 %, from 70,076.86 Gg CO2 equiv in 1989 (base year) to 15,761.24 Gg CO2 equiv due to the decrease of several productions levels. Transport sub-sectors have registered an increment of 92.47% of GHG emissions, 14,577.72 Gg CO2 equiv compared to 7,574.06 Gg CO2 equiv in 1989, base year. GHG emissions from the Other Sectors sub-sectors have decreased by 29.07 %, from 14,384.51 Gg CO2 equiv in 1989, base year to 10,203.15 Gg CO2 equiv while those from Other subsectors have decreased by 72.37%. GHG emissions from the Fugitive Emissions from Fuels sub-sectors have decreased by 63.19 %, 23,233.65 Gg CO2 equiv compared to 8,552.966 Gg CO2 equiv in 1989, base year. See also Figure 19. Shares of GHG emission categories within the Energy sector, in 2011 are presented in Figure 20.
D
Copyright © ECO-BASE Consortium 2017-2020
Page 37
Figure 20. Shares of GHG emission categories within the Energy sector, in 2011
4.1.5
Data, databases The data are owned by the state, represented by NAMR; public data are in the EUGeocapacity and CO2Stop databases.
4.1.6
Studies The theoretical geological storage capacity of CO2 in Romania was estimated in 2006 by the GeoEcoMar team, within the framework of the FP6 EUGeocapacity project, coordinated by GEUS. For geological storage of CO2, feasible solutions for storage of deep salt aquifers and depleted hydrocarbon deposits were considered. Figure 21 shows the location of the proposed storage solutions.
D
Copyright © ECO-BASE Consortium 2017-2020
Page 38
Figure 21. Localization of CO2 storage solutions (blue and brown brown coalfields) and major CO2emissions in Romania (Sava , Anghel, & Dudu, CO2 Storage Possibilities in Romania, Side Event - Prospects and challenges for CCS implementation in the new EU members States and candidate countries, 2009).
The theoretical storage capacity of CO2 in deep salt aquifers was estimated at 18.6 Gt CO2 (Sava, Andrei, & Heredea, CO2 Emissions and Geological Storage Possibilities in Romania, 2006) (Sava, Georgescu, & Scrădeanu, 2007) (Sava , Anghel, & Dudu, CO2 Storage Possibilities in Romania, Side Event - Prospects and challenges for CCS implementation in the new EU members States and candidate countries, 2009), sedimentation basins that hold the regional salines aquifers being divided into four major regions: the Mosaic Platform and the Advantage of the Southern Carpathians, the Moldavian Platform and the Oriental Carpathians Advantage, the Transylvanian Basin and the Panonic Basin (Sava , Anghel, & Dudu, CO2 Storage Possibilities in Romania, Side Event - Prospects and challenges for CCS implementation in the new EU members States and candidate countries, 2009). The assessment of CO2 storage capacity in hydrocarbon deposits was based on oil and gas reserves in each region, assuming that in most decades most hydrocarbons will be exploited and most fields will be depleted (Sava, Andrei, & Heredea, CO2 Emissions and Geological Storage Possibilities in Romania, 2006). In this way, the theoretical storage capacity of CO 2 in Romania's hydrocarbon deposits was estimated at 4 Gt CO2 (Sava, Andrei, & Heredea, CO2 Emissions and Geological Storage Possibilities in Romania, 2006) (Sava, Georgescu, & Scrădeanu, 2007) (Sava , Anghel, & Dudu, CO2 Storage Possibilities in Romania, Side Event - Prospects and challenges for CCS implementation in the new EU members States and candidate countries, 2009). For this estimate, a calculation formula based on production data was used, with a volumetric factor of 1.5 for oil and 0.005 for gas, and a CO2 density under tank conditions of 500 kg/m3 (Sava, Andrei, & Heredea, CO2 Emissions and Geological Storage Possibilities in Romania, 2006).
D
Copyright © ECO-BASE Consortium 2017-2020
Page 39
The rising cost of CO2 emissions permits is expected to be the driving factor in decarbonising the electricity sector, providing the major incentive for the application of CCS. In order to capture the possible impacts on the Romanian power sector, some quantitative model of those future policies is required. A very simple representative model is adopted, based on the ETS, with slow linear growth of €2 per year in the EUA price, reaching €50/tonne in 2030 and to €90/tonne in 2050. Such a model represents a conservative future EU climate policy, which imposes a slow and steady reduction in the ETS cap through 2050. This choice falls toward the medium range of European Commission EUA price forecasts, becoming increasingly conservative as we move towards mid-century. The future will almost certainly bring changes in the CO2 price and the introduction of other climate policy mechanisms unforeseen in this simple model. However, it can serve as an indicator of the possible magnitude of future EU policy impacts on energy production in Romania. 4.1.7
Roadmap for CCS in Romania The Roadmap for CCS in Romania was prepared by the Bellona Foundation in 2012 and has a 2050 year horizon. Within this roadmap, two possible scenarios of evolution of the Romanian energy sector where CCS were also introduced. These scenarios start from a few hypotheses (Erena, et al., 2012): • Romania intends to put into operation two new reactors at the Cernavoda nuclear power plant by 2022 and two new nuclear power plants between 2030 and 2035; • Lignite reserves will only be available for several decades, which is why the new coalfired power plants will use imported lignite; • The only CCS facility to be implemented and operated by 2020 is the demonstration of the Getica CCS national project; • The deployment of CCS on a large scale will be achieved after 2020, being applied to all new energy groups / blocks installed in existing plants or completely new power plants, and capture technology used to be pre-combustion; • The GHG emission allowance price will register a linear increase, reaching 90 € / tonne in 2050. The two energy scenarios built for the road map are the Romanian energy policy scenario (ROEP) and the High Carbon Substitution Rate (HCC) scenario (Erena, et al., 2012). The ROEP scenario (Figure 22) is based on existing energy policies and strategies at the 2012 level, includes the commissioning of proposed nuclear units and an energy mix dominated by nuclear, hydro and renewable energy (especially wind).
D
Copyright © ECO-BASE Consortium 2017-2020
Page 40
Figure 22. Evolution of the ROEP + CCS scenario (after (Erena, et al., 2012)).
The HCS scenario (Figure 23) is the scenario where two new nuclear units are replaced by two imported coal power plants. This CCS-free scenario implies twice as high emissions as in the ROEP scenario without CCS and with € 2.5 billion emission per year costs. If CCS is implemented in newly built power plants and in a retrofitted (GETICA CCS) power plant, CO2 emissions are reduced by 87% in 2050 compared to the CCS scenario, and the savings generated by non-
D
Copyright © ECO-BASE Consortium 2017-2020
Page 41
procurement of emission allowances will reach 1 , € 7 billion in 2050 after covering the costs of CCS.
Figure 23. Evolution of HCS + CCS scenario (after Erena et al., 2012)
Another recommendation in the Roadmap would be the implementation of CO 2-EOR in Romania to speed up the implementation of CCS technology by providing a revenue stream for the state and oil operators (Erena, et al., 2012).
D
Copyright © ECO-BASE Consortium 2017-2020
Page 42
4.1.8
Public awareness According to a study that was conducted in six European countries, more than half of the Romanian population have never heard of CCS. However the majority of people would support the use of CCS as part of a strategy to address global warming, but in all cases it is clear that support is generally weak, built on a low base of awareness. Initial perceptions of CCS can be expected to be strongly influenced by new information because they are reported by people who have very little knowledge about the technology. In order to successfully implement CCS technology in Romania it will be essential to have a CCS Knowledge Sharing and Communication Strategy implemented from the start-up of the CCS Demo Project (FS, FEED, EPC, Commissioning, O&M, Monitoring, Closure and Post-Closure). Effective communication strategies are an essential part of managing the risks of CCS, as well as communicating what risks are acceptable. In Romania the CCS knowledge sharing and communication strategy and permitting process time lines must be synchronized. Social and environmental risks prior to the formal permitting process shall be addressed, allowing relevant risks to be actively managed as the project moves through its conceptual stage, reducing time delays and costs over runs. Key stakeholders and local community representatives have to be part of the communication strategy all the way through the future CCS Demo Project development stages. In line with what is mentioned in Section 3.2.7, an educational brochure named as ‘What does geological storage of CO2 really mean?’ was also translated to Romanian (Saftic, Stead, & Kurelec, 2012) 12.
4.2
Conclusion Romania has a unique potential to become CO2 negative by not only generating CO2 neutral electricity from biomass but in fact absorbing already emitted CO 2 from the atmosphere. This is the conclusion of a report, "Our future is carbon negative – A CCS Roadmap for Romania", published by Bellona Foundation, an environmental NGO which supports CCS. The report models the Romanian electricity system until 2050 by considering current energy plans, with more or less CCS added. By modelling electricity prices as a function of the costs of CCS and abated CO2 emissions, it shows that using CCS is not only an environmentally favourable option but also an economic one. The large availability of sustainable biomass in Romania gives the country the unique potential for CO2 negative electricity. To allow the country to harness this potential, the report lays out recommendations for policy makers and investors.
12
D
See also http://www.co2geonet.com/resources/#1392.
Copyright © ECO-BASE Consortium 2017-2020
Page 43
5
GREECE
5.1
Introduction Greece with a population of 11.4 million inhabitants and a land area of 132.000 square kilometers is situated on the Balkan peninsula at the crossroads of Europe, Asia and Africa. It shares borders with Albania (north-west), the Former Yugoslav Republic of Macedonia (FYROM) (north), Bulgaria (north) and Turkey (north east). Greece, in total, emit 13 around 64.6 Mt CO2 equivalents (from here on termed ‘eq.’) of green-house gases annually from fuel combustion which corresponds to an emission of 6.04 toe CO 2 eq. per capita, ranking the country at 46th place amongst the largest emitting population in the world 14 and the IEA’s energy balances according to the 2006 IPCC Guidelines (IEA-Statistics, 2017)). As outlined in a recent report by the International Energy Association, the status of CCS globally is not on track (marked with red), however the trends towards CCS implementation are positive (arrow up). See https://www.iea.org/etp/tracking2017/carboncaptureandstorage/ in which the status of global CCS is described. In December 2015 a report “New regulatory trends: effects on coal-fired power plants and coal demand” was published by H. Nalbandian-Sugden through the IEA Clean Coal Centre (CCC/262). The review presents recent regulatory trends and practices in major coal producing and consuming countries for coal-fired power plants - of which Greece is one. As stated here, Greece is one of the countries with absolute economy-wide reduction targets (see Table 2 on page 20 in (Nalbandian-Sugden, 2015)). Since most of the electric power plants use lignite coal, the global coal market is expected to be under stress by over-supply and a decreasing price. Several sources for information about the CO2 emissions, or CO2 equivalents (the impact of the release of the other green-house gases), exist. The Index mundi presents statistics from all countries world-wide compiled from a multitude of sources15 including the emissions of CO2. The Carbon Dioxide Analysis Centre (CDIAC) from the US department of energy presents emission charts in which the evolution in CO2 emissions from fuel consumption and cement production are shown in Figure 24. The combustion of fuels (especially solid fuels for electric power generation) and cement production are very important to the overall emission of CO 2. The main background information used in this report come from the national inventory report submitted to the ‘United Nations Framework Convention on Climate Change’ in April 2017 reporting from the time-period of 1990-2015 (Climate Change). In addition, the survey ‘A Bridge to a Greener Greece – a realistic assessment of CCS potential’ by Bellona 2010, and public statistics from the “International Energy Association (IEA)”16 and the “Global CCS institute”17 is actively being used in this document.
‘Mtoe’ is an acronym referring to ‘million tonnes of oil equivalents’, while ‘Mt’ refer to million tonnes of e.g. CO 2. http://energyatlas.iea.org/#!/tellmap/1378539487/4 15 https://www.indexmundi.com/facts/greece#Environment 16 http://www.iea.org/statistics/ 17 https://www.globalccsinstitute.com/ 13 14
D
Copyright © ECO-BASE Consortium 2017-2020
Page 44
Figure 24.
Emissions from fuel consumption (from gas, liquid and solid fuel sources) and cement production from 1867 onwards to 2008 (a) and to 1960 (b). The source is the CDIAC, US department of Energy: Table from http://cdiac.ess-dive.lbl.gov/ftp/trends/emissions/gre.dat. World war I and II are shown in which the CO2 emission estimates are not accurate. The exponential fit (grey) using a 4.9% increase annually is fitted to the fuel consumption data from 1867 to 1960 (data from the world wars are excluded from the fitting procedure).
The annual inventory of the green-house gas (GHG) emissions reported to the national inventories reported to the UN cover emissions and removals of carbon dioxide (CO2), methane (CH4), nitrous oxide (N2O), perfluorocarbons (PFCs), hydrofluorocarbons (HFCs), Sulphur hexafluoride (SF6) and nitrogen trifluoride (NF3). For comparison, the other gases are reported as CO2 equivalents. The CO2 equivalents are calculated from how much a given amount of either of the other greenhouse gases cause global warming. The emissions values come from five sectors: 1) Energy sector, 2) industrial processes and product use (IPPU, mainly mineralogical, chemical and metal industries), 3) agriculture, 4) land use, land-use change and forestry (LULUCF), and 5) waste. 35 larger scale CCS facilities are found world-wide in total (14 in North America, 10 in Asia (8 China +2 South Korea), 5 in Europe, 3 in Australia, 2 in the Middle East, and 1 in South America) in which CO2 is injected into the underground world-wide18. However, there is no ongoing CO2 storage project in Greece (IEA-report, 2016). In order to provide a status of the ongoing CCS initiatives in Greece, information from the Carbon Sequestration Leadership Forum is described in the following. The information was given in a letter dated 12th of October 2017 provided by Nikolaos Koukouzas: The Centre for Research and Technology Hellas/Chemical Process Engineering Research Institute (CERTH/CPERI) is the National agency responsible for managing CO2 related programs, participating in a number of CCS projects of the EU Framework Programs, as well as national CCS R&D projects funded by the Greek Operational Program “Competitiveness” (2000-2006). Other Institutes that have carried out research work on CCS are the Institute of Geology and Mineral Exploration (IGME) and the National Technical University of Athens (NTUA). Within the framework of a contract with the Public Power Corporation S.A. - Hellas (PPC) and CERTH/CPERI has completed a techno economic study related to the feasibility of a CCS demo project in Northern Greece. Finally, taking into account the high fossil fuel dependency of the national electricity generation mix CCS-related R&D activities are included as a high priority research topic in the Greek National Energy Program 20072013. CERTH/CPERI represents the Greek government in international organizations and European Committees, such as in the United Nations, Committee of Energy of the European Committee, International Energy Agency, and Carbon Sequestration
18
D
https://www.globalccsinstitute.com/projects/large-scale-ccs-projects
Copyright © ECO-BASE Consortium 2017-2020
Page 45
Leadership Forum, the European Technology Platform for Zero Emissions Power Plants (ETP ZEPP), etc. The Ministry of Environment and Energy, as the main authority responsible to coordinate the CCS Directive transposition, established a Working Group which involves representatives of research organizations and universities. Technology providers, private energy companies and other industrial players have at times expressed an interest in CCS, but this interest has yet to culminate into a concrete project. PPC, which currently operates most large energy emission points within Greece, has an ambiguous stance regarding the application of CCS. Although the company is following all technological developments, it has published no concrete plans regarding the application of CCS in one of its current or projected units and has not indicated an intention to be part of any project foreseeing the application of CCS in one of its units. The Minister of Environment has commented in a press conference that the solution of CCS application is a hard endeavor, ‘especially for a seismogenous country as Greece’ adding that it would be a mistake ‘if we merely store emissions thus perpetuating the same developmental model’ (Reference: Bellona report on “A Bridge to a Greener Greece: A Realistic Assessment of CCS Potential,” 2010, (Bellona Environmental CCS Team, 2010)). 5.2
Status of CCS
5.2.1
National policy The “National action plan 20-20-20” in Greece promotes “the use of energy from renewable sources with regard to the target to achieve a 20 % share of energy from renewable sources in the Community’s gross final consumption of energy in 2020” (Energy, u.d.). According to the 2020-20 plan the aim is to remove regulatory and non-regulatory barriers to the development of energy from renewable sources. Energy policy scenarios in relation to CCS implementation in Greece are described in (Ioakimidis, Koukouzas, Chatzimichali, Casimiro, & Itskos, Energy Policy scenarios of CCS implementation in Greece, 2011, June 14-16.) in which the authors discuss three scenarios that should meet the challenge of reducing the CO2 release by 20% below the 1990 level within 2020, even though the required electricity production should increase by 5% year, mostly from lignite sources. This work was expanded and published in Energy Procedia in 2012 (Ioakimidis, Koukouzas, Chatzimichali, Casimiro, & Mcarulla, TCCS-6 Energy policy scenarios of CCS implementation in the Greek electricity sector, 2012). Further on, “The current leadership of the Ministry of Environment has not yet presented a clear policy regarding CCS application in Greece. The Ministry has not yet indicated how it is going to deal with the implementation of the “Directive on the geological storage of carbon dioxide (2009/31/EC)” (Reference: Page 15 in (Bellona Environmental CCS Team, 2010)). As outlined on page 15 in the report “A bridge to a greener Greece” by Bellona 2010 (Bellona Environmental CCS Team, 2010), the main actors for CCS are the a) Governmental initiatives, b) Industrial initiatives, c) Civil society and the d) Research institutions. The Governmental initiatives are presented elsewhere in this report. Here we quote the status for Industry and civil society. Industry: No concrete projects on CCS exist to date, despite the fact that the industries have “at times expressed an interest in CCS”. See (Bellona Environmental CCS Team, 2010). “the operator of Prinos, an off-shore mature oil field near Kavala in the Aegean Sea, (Aegean Energy) has indicated that this reservoir has all necessary characteristics to accommodate the injection of CO2 as part of a CCS project”.
D
Copyright © ECO-BASE Consortium 2017-2020
Page 46
Comment from N. Koukouzas: The “Cooperation 2011” project has studied in depth the possibility of transport and storage of CO2 to the Prinos field. The project results have been included in various deliverables that unfortunately were written in greek only”. Public Power Corporation S.A.-Hellas PPC is the primary operator in the electricity power generation. In (Bellona Environmental CCS Team, 2010) it is claimed that “PPC, has an ambiguous stance regarding the application of CCS. Although the company is following all technological developments, it has published no concrete plans regarding the application of CCS in any of its current or projected units. Nor the other electricity producers have issued a specific strategy for CCS application.” The major players in the Civil society presented by (Bellona Environmental CCS Team, 2010): “Major environmental NGOs in Greece approach CCS in an outright negative or suspicious manner. In the first case, CCS is viewed as a dangerous, expensive and unnecessary tool that could also serve as a pretext for carbon lock-in. The rationale behind the discussion about CCS according to these groups is an effort by major private companies and national governments to retain existing patterns of energy production as well as profiteering by major petroleum groups. Other NGOs, although acknowledging the necessity of CCS for emission reductions if it indeed appears to be viable, will avoid being vocal about the perspectives of this technology. The lack of any pro-CCS discourse on behalf of these NGOs lays in the supposition that the technology is untested and has not proven to be environmentally safe yet.” The research institutions in Greece that have mainly performed CCS studies are: Institute of Geological and Mineral Exploration (IGME), the Centre for Research and Technology Hellas (CERTH), and the National Technical University of Athens. From Bellona report 2010 (Bellona Environmental CCS Team, 2010) we quote: “Especially CERTH and the National Technical University of Athens have developed strong activity within European umbrella organizations, such as the European Technology Platform for Zero Emission Fossil Fuel Power Plants (ZEP), and act as centres of gravity for the dissemination of information and the education of stakeholders. Representatives of several research bodies and organizations have been carrying out studies and research concerning a number of aspects of CCS application in Greece”. 5.2.2
Regulatory issues The Grantham Research Institute on Climate Change and Environment have made a database of more than 800 climate-related laws from 99 countries in addition to country facts and key indicators19. This database covers the world’s 50 largest greenhouse gas emitters and 93 of the top 100 emitters accounting for nearly 95 % of the global release. A recent update on the global trends on climate change legislation and litigation can be seen online20. The key messages are that approx. 1200 relevant laws globally and the rate at which new laws are passed have declined from approx. 100 laws per year in 2009 to less than 40 in 2016, implying the large amount of ground covered by climate laws. The challenge for further law-makers is to strengthen existing laws and fill in gaps to meet the overall emission goals set. In Greece, 12 laws are found in the database mentioned above. The EU CCS Directive 2009/31/EC of the European Parliament and of the Council of 23 April 2009 on the geological storage of carbon dioxide has been transposed into Greek law in 2011 by the Joint Ministerial Decision 48416/2037/E.103/2011 (Government Gazette, Series II, No. 2516/2011). The Ministry of Environment is the main authority responsible for the
19
This can be accessed at http://www.lse.ac.uk/GranthamInstitute/climate-change-laws-of-the-world/ http://www.lse.ac.uk/GranthamInstitute/publication/global-trends-in-climate-change-legislation-and-litigation2017-update/ 20
D
Copyright © ECO-BASE Consortium 2017-2020
Page 47
implementation of the directive. Major additions have been made to the EU Directive contents, relevant to the countries specific environmental regulations, needs and processes. 5.2.3
Regulatory barriers CO2 storage is allowed in geological formations within the Hellenic territory, but not allowed within the water column and in underground aquifers. As such, the injection of CO2 is unlikely without these barriers having been addressed. The Ministry of Environment, Energy and Climate change issued a law “Law 3851/2010 – Accelerating the development of Renewable Energy Sources to deal with climate change and other regulations addressing issues under the authority of the Ministry of Environment, Energy and Climate Change”21. The national targets for the RES (Renewable Energy Sources) is based on: “The protection of the climate, through the promotion of electrical energy production from R.E.S., constitutes an environmental and energy priority of the highest importance for the country.” Further on the national targets for RES until the end of 2020 are: a) Energy produced by RES to the gross final energy consumption by a share of >20%. b) Contribute to the electrical energy produced by RES to the gross electrical energy consumption to a share of >40%. c) Energy produced by RES to the energy consumption for heating and cooling to >20%. d) Electrical energy produced by RES to the electrical energy consumption in transportation to >10%. More information from the Ministry of Environment and Energy is available online22 To meet the emission reduction goals by developing renewable energy sources, carbon capture and storage from lignite power plants can represent an alternative way. If so, key hurdles in the public opinion need to be overcome. Incentives for CCS in Greece The economic incentives for private capital investments into CO 2 storage can be divided into three categories: a) to avoid taxation for the current CO 2 release, b) to improve the production of secondary sell-able products, and c) using CO2 in new and emerging technologies in which CO2 is used to drive chemical reactions, e.g. green cement production from olivine and other mantle rocks. Point a) above is not relevant for Greece since there is no tax system designed inhibit the release of CO2. Now b), however, can be more relevant for Greece as the coming discussion is based on three mechanisms namely, i) enhanced coal bed methane production from unmineable resources induced by CO2 injection (CO2-ECBM), ii) methane production from CO2 injection into gas hydrates (CO2-GH), and iii) enhanced oil recovery from oil resources (CO 2EOR) in Greece. Knowledge of green cement, CO2-ECBM, CO2-EOR, and CO2-GH, using CO2, is based on a range of sources. In laboratory tests, the focus is on understanding and improving the physical and chemical processes themselves. Laboratory studies are important because they enable testing new ideas in a cheaper way, with better control of the variables at play. Field tests are performed to investigate how the up-scaled version of the laboratory tests perform on industry scale. Often used to find the practical hurdles and challenges in the implementation phase. As such, to acquire the synthesized knowledge that can be used in decision making processes, knowledge from both laboratory and field tests are combined with economic analyses. Both regional and global investigations may apply. The reviewed documents fall into the categories above, i) laboratory studies, ii) lessons learned from field cases, iii) economic assessments, and iv) regional / global analyses.
21 22
D
http://www.ypeka.gr/LinkClick.aspx?fileticket=qtiW90JJLYs%3D&tabid=37 http://www.ypeka.gr/Default.aspx?tabid=225&language=en-US.
Copyright © ECO-BASE Consortium 2017-2020
Page 48
5.2.4
Projects Coal bed methane, unmineable resources and the application of CO 2 injection CO2-ECBM: Even though the unmineable resources in Greece are not currently important to the energy mix, since the lignite coal mines are easily available currently, CO 2 can still be applied to extract methane gas from these plays. This process is referred to as CO 2 enhanced coal bed methane (CO2-ECBM). A review of the status and global potential has been performed by (Godec, Koperna, & Gale, 2014) in which the IEAGHG reassessed the status of research and development of CO2-ECBM. In this study they 1) reviewed the current CBM production and the global potential for CO2 storage, 2) reviewed the research on enhanced gas recovery (EGR) and geological CO2 storage in coals, and 3) updated the global potential for EGR and geological storage of CO2 in coals. They conclude that globally, the “estimated technical recovery potential of CH4 is 79 trillion cubic meters (29 Tcm conventional and 50 Tcm when applying CO 2-ECBM as a secondary production technique). This would facilitate the storage of nearly 488 billion metric tons (giga tons) of CO2 in unmineable coal seams globally.” As can be seen, the global potential to produce energy in the form of methane from unmineable coal beds is large. CO2 enhanced methane production from gas hydrate (CO2-MH) The methane stored in hydrates may be one of the largest natural gas resources on the planet. More complicated recovery strategies than depleting the pore pressure is required to capture significant amounts of the stored methane. CO 2 enhanced methane production from gas hydrate (CO2-MH) laboratory data can be seen in (Birkedal, Hauge, Graue, & Ersland, 2015). This article describes the physical-chemical concepts at play. A review of the available research on replacement of CH4 by CO2 in gas hydrates can be studied in (Zhao, et al., 2012). In another paper, (Anderson, et al., 2014) the lessons learned from the CO2 injection in the Ignik Sikumi hydrate field (Alaska, USA) is described. Enhanced oil recovery by CO2 injection (CO2-EOR) The employment of CO2 to enhance the oil production to drive hydrocarbons towards production facilities in underground reservoirs started in early 1970’s. CO 2-EOR both mixes with the oil and reduces the viscosity and releases the trapped oil from the mineral surfaces in the formation thereby enhancing the production rate of oil. The CO2 in the oil is then separated from the oil, before being re-injected into the formation. Using primary production techniques as much as 80% of the oil in place remains in the reservoir, and techniques for enhanced oil recovery may provide significant additional value. The economy of CO 2 EOR in real cases is dependent upon the petrophysical properties of the reservoir, the properties of the fluids, the depth of the formation as well as the distance to the CO2 sources. In addition, when oil production ceases the reservoir may be used for additional CO 2 storage. N. Koukouzas published an assessment of CO2 storage opportunities in Greece (Koukouzas, Ziogou, & Gemeni, Prelimenary assessment of CO2 geological storage opportunities in Greece, 2009). The focus in this publication was to identify the geological structures close to major CO 2 emission sources that could be used for long-term storage. In this paper, the Prinos oil field (and saline aquifer), aswell as the saline formations of the Thessaloniki Basin and the Mesohellenic Trough were identified as candidates for CO2 storage. In addition, a deep saline aquifer in a carbonate formation beneath the Neogene-Quaternary sediments of Ptolemais-Kozani graben (NW Greece) is considered. The proximity of this geological formation to Greece's largest lignite-fired power plants suggests that it would be worthwhile undertaking further site-specific studies to quantify its storage capacity and assess its structural integrity. A description of the Prinos oil field can be found in (Proedrou & Sidiropoulos, 1992). Prinos is a mature field in the North Aegean sea approx. 6 km northwest of Thassos at a water depth of 31 m. The Prinos field is an anticline trap (as is the adjacent small gas reservoir of South Kavala 11 km to the south). A study of the safety and monitoring system for CO2 injection into Prinos has been performed by Koukouzas and co-workers in 2016 (Koukouzas, Lymperpoulos, Tasainas, & Shariatipour, 2016).
D
Copyright © ECO-BASE Consortium 2017-2020
Page 49
5.2.5
R&D projects This is based on an email sent by Nikolaos Koukouzas the 13th October 2017. The current ongoing project related to CCS is (in italic): An ongoing project is the COABYPRO project which will be focusing on coal ash and its disposal or use in different ways depending on the type of by-product, the processes at the plant and the regulations the power plant should follow. Some power plants may dispose of it in surface impoundments or in landfills. Others may discharge it into a nearby waterway under the plant's water discharge permit. Coal ash may also be recycled into products like concrete or wallboard. Coal ash contains contaminants that without proper management, can pollute waterways, ground water, drinking water and the air. Therefore, the disposal of the by-products becomes an important issue. Considering that coal combustion emits a great amount of CO2, the produced fly ash can be used as a material for on-site CO2 capture and storage (CCS). In this ongoing project, a laboratory scale study of mineral carbonation of coal fly ash for CO 2 sequestration will be made. The capture of CO2 in zeolites will also be studied. The two methods (CO 2 capture in fly ash and zeolites) will be compared and their carbonated products will be examined with regards to their leachability. The goal is to be used for the environmental management of coal mines after closure. Further on, the email by N. Koukouzas the 13th of October 2017 also describe the past projects on CCS (in italic): • NOVEL TechnologIES ON the implementation of CCS (NOVELTIES ON CCS) "COMPETITIVENESS AND ENTREPRENEURSHIP"-NSRF 2007-2013. The main goal of the NOVELTIES ON CCS proposal was to bring forward CCS as an operational and economically viable technology in Greece, earlier than if left to the market alone. The proposal covered a range of activities aimed at accelerating the innovation and development of CCS technologies. During this project a preliminary study of CO2-EOR and CO2 storage was performed for the oil reservoir of Prinos, which resulted in the following: a) Under an injection scheme of approximately 30 years, the total storage capacity of the oil reservoir is estimated to be 16.4 million tons of CO2 from which 38,5% of CO2 volume is stored during the EOR process while the rest of it during the pure storage phase. b) the CO2-EOR process resulted to an oil recovery increase of approximately 9,5%, providing an additional oil volume of 22,2 million barrels. • Research and Civil Society Dialogue towards a low-carbon society (R&Dialogue) FP7-SCIENCE-IN-SOCIETY-2011-1: The objective of the R&Dialogue project was to create mechanisms for effectively tackling the scientific and technology-related challenges faced by society by proactively bringing together different actors with complementary knowledge and experiences. The aim of this project was to organise a dialogue between R&D organisations (RDOs) and civil society organisations (CSOs) that resulted in a joint vision of CSOs and RDOs on the development of renewable energies and CCS for a low carbon society and identification of actions to improve the dialogue and associated mutual learning. • Enhanced Coal Exploitation through Underground Coal Gasification in European Lignite Mines (COAL2GAS), Research Fund for Coal and Steel Project. The overall objective of the COAL2GAS project was to evaluate the feasibility of UCG in shallow lignite seams, both geologically, technically and environmentally and to illustrate this for a selected deposit in Romania. The resulting information was linked to the requirements in a permit application. Chances were assessed for other similar European deposits. The results obtained helped to evaluate the potential and risks of UCG in shallow mining environments. • CO2QUEST (European FP7) project involved the collaboration of 12 industrial and academic partners in Europe, China and Canada which focused on the development of state-of-the-art mathematical models along with the use of large scale
D
Copyright © ECO-BASE Consortium 2017-2020
Page 50
•
•
•
•
•
•
experiments to identify the important CO2 mixtures that have the most profound impact on the different parts of the CCS chain. Research into Impacts and Safety in CO2 Storage (RISCS), FP7-ENERGY-2009-1 Collaborative project. The objective of RISCS was to provide fundamental research on environmental impacts, necessary to underpin frameworks for the safe management of CO2 storage sites. To achieve this, RISCS quantitatively assessed environmental impacts from exposure to known CO2 fluxes on humans and onshore and offshore ecosystems. Study of CO2 Storage in Coal Seams and Deep Underground Coal Gasification (UCG & CO2 Storage), Research Fund for Coal and Steel Project. The objectives of the project included the evaluation of the potential of deep lying coal seams (e.g. in Dobroudja Coal Deposit), for the development of UCG and the sequestration of CO2. European Carbon Dioxide Capture and Storage Laboratory Infrastructure, 7th FP INFRA-2010-2.2.4 INFRA-2010-2.2.4. The ECCSEL consortium teamed up selected Centres of Excellence on CCS across Europe (Norway, Poland, France, Italy, Germany, Spain, Greece, UK, Netherlands and Switzerland). The mission was to develop a European distributed, goal-oriented, integrated Research Infrastructure to provide a dynamic scientific foundation to respond systematically to the urgent R&D needs in CCS at a pan-European level in a short and long-term perspective. "GEOMECS" (GEOMechanics and Environment of CO 2 geological Storage) project is another CCS related project which involved cooperation between CERTH, the University of Patra, the Aristotle University of Thessaloniki and the Polytechnic in Crete. It was a project dedicated to increasing the understanding of the long-term fate of stored CO2 and to the study of the mechanisms of leakage through the cap rock. Selection of a CO2 representative storage basin was made e.g. the Mesohellenic Trough and reservoir and cap rock sampling was carried out. Physicochemical and petrographical analyses of rock samples were also made. Batch reactor experiments and fluid analysis as well as geochemical kinetic models were constructed. "CO2 mineralization" (bilateral co-operation with Los Alamos National Laboratory, USA) and "Assessment of CO2 geological storage potential in Greece and the Czech Republic". Other projects included GESTCO, GeoCapacity, CASTOR and CACHET. The CO2 storage capacity of the Greek hydrocarbon fields and deep saline aquifers has been estimated under the EU GeoCapacity project providing opportunities for CCS implementation.
In summary, a series of national and international incentives on a range of CO2 related topics has been made. However, no current ongoing pilot projects exist on Greek soil. 5.2.6
Emission In the following the spatial distribution of emission points and the time-evolution of the estimated emission of greenhouse gases are presented. In Figure 27 a map over Greece is shown with the different regions outlined. Before analyzing the emission numbers from the national inventory submitted to UN the results of the uncertainty analyses has to be presented. Emission estimate uncertainty Uncertainties of the annual emission estimates have been analyzed (see page 69 in (Climate Change)): In general, the uncertainties associated with CO2 are very low, and the least accurate estimations are those for Ν2Ο and F-gases. This difference is mainly due to the uncertainty in emissions factors. For example, in the sector of marine transport the emission factor for CO2 depends only on the type of fuel, while CH4 and Ν2Ο factors
D
Copyright © ECO-BASE Consortium 2017-2020
Page 51
depend heavily on the technology of the engine used. As a result, the uncertainty in emissions factors for marine transport is 5% for CO 2 and an order of magnitude for CH4 and Ν2Ο. Total uncertainty is 11.8% (without LULUCF23), while the uncertainty that carried over into the GHG emissions trend is 11.3%. To be mentioned that the uncertainty analysis is based on the 100% of emissions. The uncertainty estimates for GHG emissions per gas (with LULUCF) in 2015, were estimated to be 2.9% for CO2, 36.7% for CH4, 106.5% for Ν2Ο and 282.4% for the Fgases. The total uncertainty was 12.5%, while the uncertainty that carried over into the GHG emissions trend was 11.7%. As such, when evaluating trends and time-laps evolution the uncertainty above has to be acknowledged. Emission trend analysis The anthropogenic greenhouse gases that are emitted are CO2, CH4, N2O, HFC, PFC and SF6 as reported in (Climate Change). In Table 8 the release of the GHG gases are shown from A) the GHG emissions, B) from land use and forestry (negative imply that it binds CO 2), and C) from international transport to and from Greece which is treated separately. As can be seen, the CO2 emission increased from 83.3 Mt in 1990 to a peak of 114.6 Mt in 2007 before it was reduced to 74.9 Mt in 2015. The corresponding emissions of methane (CH 4) were 10.9 Mt CO2 eq. in 1990 until a peak of 11.3 Mt in 2006, towards a reduction to 10.2 Mt in 2015. Estimates of the N2O release ranged started out at 7.4 Mt CO2 eq. in 1990 following a steadily decaying trend towards the 4.5 Mt CO2 eq. emitted in 2015. This trend is opposite to HFC gases which started at 1.1 Mt CO2 emissions in 1990, increasing to 6.7 Mt CO2 eq. released in 1997, before a minimum of 2.7 Mt CO2 eq. was released in 2006, increasing again to 5.9 Mt CO 2 eq. in 2015. The uptake of CO2 from forestry and land use (LULUCF) vary between approx. 2 to 3 Mt CO2 eq. per year (minimum of 0.4 and maximum of 3.4 Mt CO2 eq.). The GHG emissions from international transport comes in addition to the national releases as reported here.
23
D
LULUCF: Land use, land use change and forestry.
Copyright © ECO-BASE Consortium 2017-2020
Page 52
Table 8.
CO2 and CO2 equivalents (eq.) reported for the six most important gases released by humans. Data from 1990 to 2015. A) GHG emissions, B) Land use, land use exchange and forestry, and C) International transport. Table acquired from page ‘v’ and ‘vi’ in (Climate Change)
As reported in the UN Emission inventory the sources of GHG emissions arise from five sources. In Table 9 the total estimated CO2 equivalents (CO2 eq.) are given in kilo-tonne (kt). The most important being the energy production making up to 76.869 kt (i.e. 76.9 Mt) CO 2 eq. in 1990 while in 2015 this value was reduced to 71.0 Mt in 2015, with a peak in 2007 with 108.1 Mt CO2 eq. emitted. The emission from the energy sector further divided as shown in Table 9. The second most important emission factor is the industrial process and product use (IPPU) with a base 1990-level of 11.2 Mt CO2 eq. emitted, to a peak in 1999 when 16.4 Mt, before the number was reduced to 11.9 Mt CO2 eq. in 2015. The third most important emitter category is agriculture whereas the base 1990 level was 10.1 Mt (1990 was the peak year) and in 2015 agriculture production emitted 8.3 Mt CO2 eq. Waste handling comes out fourth with an emission varying between from 4.3 to 5.2 Mt from 1990 to 2015. In all, the total CO2 eq. greenhouse gas emissions were increasing from 103.1 Mt CO 2 eq. in 1990, towards a peak emission of 136.3 Mt in 2005 until it was reduced to 95.7 Mt in 2015 (i.e. an overall reduction by 7.15%). The uncertainty in the estimates as described above in the annual emission estimates should be noted. In addition, the numbers vary naturally as new businesses grow and diminish, new solutions are implemented and due to the economic crisis in the years since 2008. As can be observed from the table below the total emission estimates can be considered volatile, because annual variations can be as high as 4 to 6%. In order to draw any significance and predict any overall trends the numbers need to be compared to the volatility of the estimate. When this
D
Copyright © ECO-BASE Consortium 2017-2020
Page 53
fluctuations vs trends comparison has been made two emission trends appear: an increase in emission from 1990 to 2007-2009, after which the overall emissions decreased. This coincides with the economic crisis that struck the Greek economy. This can explain much of the variation that is observed. It is interesting to observe that the emission reduction seemed to start before the economic crisis from the peak value in 2005, three years in advance of the global economic crisis (care needs to be taken here because of the aforementioned errors and volatility). As such, data imply that a one-to-one correlation between economic growth and CO2 eq. emissions cannot be made as other factors also play a role. The overall Greek emissions in 2015 partitioned as shown in Figure 25 in which emissions from the energy sector are responsible for almost ¾ of the total emissions, followed by industrial processes and product use (IPPU) 12.4%, agriculture 8.7% and waste 4.7%.
Figure 25. Distribution of GHG emission in 2015. Figure acquired directly from page 76 in (Climate Change). The contribution (CO2 capture, and methane release etc.) of LULUCF is excluded from the plot above as only emissions to the atmosphere by anthropogenic consumption is concerned here.
D
Copyright © ECO-BASE Consortium 2017-2020
Page 54
Table 9.
Total estimated CO2 emissions divided into the five different sources. Based on the UN Inventory report (2017). The numbers are given as kt CO2 eq. (Acquired from page ix and x in (Climate Change)).
In Table 9, the land use, land use change and forestry (LULUCF) represents a sink as it inhibits the release to the atmosphere because of biological processes that bind CO 2 (thus negative numbers). The estimates of LULUCF vary greatly (see from 2014 to 2015 when the numbers change from -0.4 Mt to -3.1 Mt), such that a clear trend cannot be deduced from the table. Typical values range from -2 to -3 Mt CO2 eq. from 1990 until 2015. As shown in Figure 25, about ¾ of the total emissions come from the energy sector. The energy sector can, again, be divided into two main parts, namely Fuel combustion (Energy Industry, construction, transport and other services), and Fugitive emissions as shown in Table 10 from 1990 to 2015. As can be seen, in 2015, 40.8 Mt out of the total 69.2 Mt CO 2 eq. from the energy sector arise from energy industries that use liquid, solid or gaseous fuels. The IPPU consists of the emissions from mineralogical, chemical and metal industries. In the report energy industries are not the only ones that produce electricity. In Table 10 ‘energy industries’ includes public electricity and heat production Petroleum refining Manufacturing of solid fuels and other energy industries.
D
Copyright © ECO-BASE Consortium 2017-2020
Page 55
Table 10.
Energy, IPPU, Waste, LULUCF and international transport emissions partitioned. Table acquired from page 80 in (Climate Change)).
Emissions from electric energy production In Figure 26, the total energy production, the total primary energy supply, and the selfsufficiency is plotted from 1970 to 2015. The Greek numbers are compared to Turkey and Romania. As can be seen, the overall energy production for Greece increased until about 19901995, then was around constant until 2010. A decline in the energy produced can be seen from 2010 to 2015. Now the total primary energy supply per capita is shown in (B), the average consumption in tons of oil equivalents increased steadily from about 1.2 toe/capita in 190 to almost 2.8 toe/capita in 2007, after which it was reduced to around 2.1 toe/capita in 2015. The ratio of the produced energy and the energy demand of Greece is the ratio of the produced energy (in A) and the consumed requirements, i.e. the self-sufficiency as plotted in (C). The selfsufficiency of Greece is as low as 40% emphasising the importance of CCS for the energy sector in the future.
D
Copyright © ECO-BASE Consortium 2017-2020
Page 56
A
B
C Figure 26.
(A) Total energy production (in land) from 1970 to 2015 in units of millions tonne oil equivalents (Mtoe). (B) the Total primary energy supply (TPES) in tonnes of oil equivalents per capita is plotted. Greece has around 11.4 million inhabitants. In (C), the self-sufficiency (production divided by the total energy supply) is plotted. This is around 40% for Greece. The blue line correspond to Greece, orange to Romania and brown/yellow to Turkey. The plots are acquired from http://energyatlas.iea.org/#!/tellmap/-297203538/4
The 2009 state of the Greek electricity production is the following (reference: (Ioakimidis, Koukouzas, Chatzimichali, Casimiro, & Mcarulla, TCCS-6 Energy policy scenarios of CCS implementation in the Greek electricity sector, 2012)): • The Greek electricity system is divided between an interconnected system and electricity generation on isolated autonomous islands. • The total production was 14.5 TW in which 12.9 TW is produced on the ‘interconnected system’, while 1.7 TW is produced on autonomous islands. • 22 Lignite power plants contribute with 5.0 TW, natural gas with 3.3 TW, oil with 2.1 TW, renewable energy with 4.3 TW (Hydro:3.2 TW, wind: 1.1 TW, solar: 0.04 TW, Biomass: 0.04 TW, Geothermal: 0 TW). • From 1995 to 2009 the installed capacity of electricity generation in the interconnected system increased from 9.2 to 12.9 TW
D
Copyright © ECO-BASE Consortium 2017-2020
Page 57
• •
The demands for electricity are rising faster than the supply even though the first steps towards a market liberalization have been made. The two major lignite surface coal mines are situated in the north-west part of Greece in Ptolemaida / Kozani and the Peloponnese / Megalopolis region (see Figure 27).
Figure 27. Map of Greece with codes of geographical locations (acquired from Fig. 9.1 in (Climate Change)).
Lignite coal production in Greece The lignite mines in Ptolemais and Megalopolis provide brown coal for power generation. In all, the eight lignite power plants owned by the Public Power Corporation S.A.-Hellas (PPC/DEI) generate nearly 56% of the national electrical energy. Lignite coal is therefore the single most important energy source for the Greek electricity production, with natural gas (20%) and hydropower (12%) coming second and third (nuclear power 0%). Greece has the second largest European lignite reservoirs, ranking the country sixth worldwide. To date, a total of 1.3 billion tons have been mined, while the exploitable reserves is 3.1 billion tons. With the current consumption rate, the lignite reserves will last for more than 45 years24.
24
D
https://www.dei.gr/en/i-dei/i-etairia/tomeis-drastiriotitas/oruxeia
Copyright © ECO-BASE Consortium 2017-2020
Page 58
See Figure 28. Lignite is cheap to produce, and it offers stability and security in the availability of fuel supply. The use of lignite power generation contributes to saving of foreign currency reserves (approx. 1 billion dollars annually), work for people in remote areas and contributes to the growth of the Greek National Product.
Figure 28. Greek map of the lignite power plants. Acquired from https://www.dei.gr/en/i-dei/i-etairia/tomeis-drastiriotitas/oruxeia the 19th of October 2017.
The largest CO2 emitters in the power sector are shown in Table 11 in which the point sources, fuel sources for the energy production, and the total annual CO 2 emission in Mt/year are shown. Data comes from 2007 and is taken from Table 2 in (Bellona Environmental CCS Team, 2010). As can be seen, the Ag. Dimitrios is the largest emitter with 12.95 Mt/year.
D
Copyright © ECO-BASE Consortium 2017-2020
Page 59
Table 11.
CO2 emitters in the electrical power section in Greece. Based on 2007. Table acquired from the report 'A bride to a greener Greece' by Bellona 2010.
The spatial distribution of the capital emission points is shown in Figure 29. The map is acquired from (Bellona Environmental CCS Team, 2010) where diameters of the grey circles are proportional to the annual emission. In addition, the existing pipelines are shown together with the maritime boundary.
D
Copyright © ECO-BASE Consortium 2017-2020
Page 60
Figure 29.
2010 emission sources acquired from (Bellona Environmental CCS Team, 2010). The existing fossile gas pipes, and the national maritime boundaries are shown. The largest emittor is found in north-west parts of Greece. The diameter of the grey circle is proprotional to the annual emission with 13 Mt CO2 eq shown in the legend. Remember that the overall total annual emission was about 95 Mt CO2 eq. in 2015.
GHG CO2 eq. emission from the industrial sector In (2), they present the largest CO2 emitters from the industrial sector in Greece in 2010 (see Table 12). As can be seen, cement manufacture, with eight factories, is by far the most important source of emission. Each factory emits from 0.5 to 2.8 Mt/year of CO 2 (typical values range between 1.0 and 2.0 Mt/yr). In addition, the emissions from metal, fertilizers and ferronickel industries are presented. The numbers from 2010 are further developed in the 2015 report to the Greek emission inventory submitted to the United Nations (Climate Change). Here, a chapter on the ‘industrial processes and product use IPPU’ report the emissions from the following categories: a) the mineral industry, b) the chemical industry, c) the metal industry, d) non-energy products from fuels and solvent use, e) the electronics industry, f) fluorinated substitutes, and g) other IPPPU. The report here is based on the CO2 equivalents (eq.’s) in which the overall production has varied greatly since 1990 until today (see Figure 30). In 2015 the GHG emissions from these sources were approx. 12.9% of the total emissions. The emissions of the different GHG gases in the same time period are shown in Table 13, while the annual emissions from the different sectors (a to g, above) are shown in Figure 31. Two factors are worth being mentioned in the release of CO2 equivalents shown: the HCFC gases have been replaced by substitutes of the Ozone Depleted Substances (ODS) gases, and the release from the mineral industry has reduced significantly since 2005 until 2015.
D
Copyright © ECO-BASE Consortium 2017-2020
Page 61
Further on, the GHG emissions as estimated from industrial applications have been divided into 23 industrial applications where the major 2015 emissions were (see page 169 to 261 in (Climate Change)): 1. Cement production / clinker production: 3.4 Mt CO2 eq. 2. Lime production: 0.2 Mt CO2 eq. 3. Glass production: 0.1 Mt CO2 eq. 4. Other processes using the products from heating carbonates: 0.7 Mt CO 2 eq. 5. Ammonia production: 0.24 Mt CO2 eq. 6. Nitric acid production: 0.07 kt N2O emission 7. Petrochemical and Carbon Black Production: Not relevant since the production of ethylene and 1,2 dichloro-ethane production ceased in 2000 8. Fluorochemical production ceased in 2005. 9. Other chemical production: 0.25 Mt CO2 eq. 10. Iron and steel production: 0.06 Mt CO2 eq. 11. Ferroalloys production: 0.7 Mt CO2 eq. 12. Aluminium production 0.28 Mt CO2 eq. 13. Lead: 11.3 kt 14. Zink: 65 kt 15. Lubricant use: 29 kt 16. Parafin wax use: 0.5 kt 17. Use of urea as catalyst: 0.68 kt 18. Solvent use: 10.8 kt 19. Substitutes for HCFC gases (ODS): 5.9 Mt CO2 eq (primary use in refrigerators and air conditioning) 20. Electrical equipment: not relevant 21. N2O from product use: 0.23 kt N2O emissions (+ 0.24 kt from medical use) 22. Other solvent use: 81.3 kt CO2 Table 12.
D
List of the largest CO2-emitters in Greece. The table below is acquired from ‘A bridge to a greener Greece’ by Bellona 2010 (Bellona Environmental CCS Team, 2010) in which the data was based on E-PRTR.
Copyright © ECO-BASE Consortium 2017-2020
Page 62
Figure 30.
Greek IPPU emission trend acquired from page 169 in (Climate Change). From 1990 until 2015, the total emissions have varied from a minimum of 10.3 Mt (1992) to a maximum of 16.5 Mt CO 2 eq. in 1997.
Table 13.
IPPU emissions divided into different gases (see page 170 in (Climate Change)).
D
Copyright © ECO-BASE Consortium 2017-2020
Page 63
Figure 31.
Emissions from the different industry sectors within the IPPU category as shown over time. The production of HCFC gases ceased in 2006, while the product uses as substitutes for Ozone Depleted Substances has increased substantially to compensate the use of HCFC-gases. The emissions from the mineral industries have decreased since 2005.
GHG emissions from the transport sector Transportation is the third emission factor playing a role in the Greek emission budget with an overall emission of 16.8 Mt CO2 eq. (see Table 10). This sector is, however, not directly relevant for CCS applications since the emissions are distributed throughout the country. Electrified vehicles are supplied by electric energy from lignite driven power plants. 5.2.7
Data, databases Subsurface petrophysical data of potential hydrocarbon reservoir rocks are owned by oil and gas companies. These data sets are not publicly available and will not become so in the future. Studies, however regarding porous rocks not relevant to O&G conducted by universities, the Institute of Geology and Mineral Exploration or other organizations can be either found in their libraries (not publicly available) or in published scientific papers. Greece has participated in the most European projects that were focused on the carbon storage options like GESTCO “European Potential for the Geological Storage of CO 2”, Geocapacity, Castor and CO2Stop that produced databases, different storage structure potentials and storage capacities. GESTCO evaluated the CO2 storage potential of Greece. The largest capacity by type is in saline aquifers, with a potential of 2.3 Gt CO 2. Potential sites within an economically feasible distance of major emission nodes are situated in the Thessaloniki Basin and the Mesohellenic Trough. Additional research is required to characterize other prospects including hydrocarbon and other off-shore basins. The depleted Prinos oilfield exhibited a capacity of 13 Mt CO2 and for which it was thought to be a demonstration opportunity. That being said; the Geocapacity study in which the capacity of CO2 storage in Europe is assessed (Geological Survey of Denmark and Greenland, 2009) estimated that 70 Mt of CO2 can be stored in Greek hydrocarbon fields (see page 22 in the GeoCapacity final report).
D
Copyright © ECO-BASE Consortium 2017-2020
Page 64
However, Rutters and partners (Rutters & CGS Europe, June 2013) estimated that 2190 Mt CO2 could be stored in Greece when all potential storage sites were included. An overview of the location of the i) Mesohellenic Trough, ii) Westarn Thessaloniki, and the iii Prinos basin (with further detail in b) can be seen in Figure 32. In a recent publication the storage capacity of the Mesohellenic Trough was estimated to be 728 Gt of CO 2 (Tasianas & Koukouzas, 2016), which is higher than earlier estimates of the storage capacity. A geological map of the Mesohollenic Through that is copied from Figure 2 in (Tasianas & Koukouzas, 2016) can be seen in Figure 33. 5.2.8
Scoping studies for CCS A case study regarding CO 2 capture and Storage from the Komotini NGCC Power plant was published in 2006 by Koukouzas et al (Koukouzas, Klimantos, Stogiannis, & Kakaras). This report analyzes how the abatement (ending) of CO2 emissions from a concrete fossil fuel power generator using post-combustion CO2 capture, transportation and storage would affect the economy and overall energy consumption. The authors conclude that CCS is technically feasible although not without a significant cost as the efficiency of the plant is reduced. CCS in Prinos which is a mature offshore oilfield brought into production in 1981 in the PrinosKavala basin, located offshore in the Gulf of Kavala in the Aegean Sea. It covers an area of 6 km2, about 8 km north-west of the Island of Thassos and 18 km south of the mainland Northern Greece , in water 31 metres deep. Its storage capacity of 13Mt CO 2 was evaluated in the GESTCO project , while more recently in the framework of a Greek project NOVEL TechnologIES ON the implementation of CCS (NOVELTIES ON CCS) a preliminary study was performed on CO2-EOR and CO2 storage resulting to more detailed conclusions as was mentioned earlier in the report.
D
Copyright © ECO-BASE Consortium 2017-2020
Page 65
Figure 32.
D
Figure copied from Figure 1 in (Koukouzas, Lymperpoulos, Tasainas, & Shariatipour, 2016). Map of Greece with three potential storage locations shown. b) Is a geologica map of the PrionsKavala sedimentary basin northwest of the Island of Thassos (copied from Figure 2 in (Koukouzas, Lymperpoulos, Tasainas, & Shariatipour, 2016)).
Copyright © ECO-BASE Consortium 2017-2020
Page 66
Figure 33. Geological map is copied from Figure 2 in (Tasianas & Koukouzas, 2016). Porous formations are displayed in b).
Pipeline networks The Greek ministry of Foreign affairs has described the role of Greece in the Natural gas pipeline network on the Balkan peninsula. This study is complementary to the transport pipelines and is shown in Figure 2 of the Bellona 2010 report. 5.2.9
Public awareness Public awareness and the perceptions of CCS are discussed in (Pietzner, Shumann, & et. al, 2011) where surveys from six European countries are compared. The information can be used to address how CCS should be communicated to the broad audience. The paper summarizes the results of surveys conducted in Germany, Greece, the Netherlands, Norway, Romania and the United Kingdom (UK). Approximately 1000 interviews from each country were performed between the last quarter of 2009 and January 2010. An average of about 60% of the interviewed persons had never heard of CCS before. In Greece, this number was 77%. Overall, younger male persons had a higher perception of CCS compared to older and/or female inhabitants. The initial perception to CCS was from ‘more or less neutral to slightly positive’ to CCS, although national differences exist in which Germany is more on the negative side, while Greece and Romania would on average slightly support using CCS to mitigate climate change. The perception of CCS application in 2009-2010 was, however, overall dominated by a lack of knowledge as around 60% had never heard of it before. As such, the public perception to CCS as a viable way forward could be subject to change as more people are made aware of the emerging technology. This was confirmed by an experiment in which they divided the group in
D
Copyright © ECO-BASE Consortium 2017-2020
Page 67
two (approx. 500 respondents in each group) in which one group was given ‘negative information’ and the other ‘positive information’ about CCS. The change in pre and post perception of CCS (compared to the given information) was largest in Greece., where most persons had never heard of CCS before. 5.3
Conclusion CCS currently has no clear role in government plans for energy system reform or emission reduction. Studies have pointed to opportunities for CCU, in the form of CO 2-EOR, but so far no initiatives have been undertaken to develop these to real projects.
D
Copyright © ECO-BASE Consortium 2017-2020
Page 68
6
DISCUSSION
As Annex B countries of the Kyoto Protocol, Romania and Greece have greenhouse gas emission reduction targets. Romania has included CCS as one of the technologies to reduce emissions from fossil fuel based power and industry in the transition towards emission-free technologies (renewable and nuclear). In Greece, there are no clear policies regarding CCS and CCUS. Turkey, not being a member of the Kyoto Protocol Annex B group of countries, has defined its own emission reduction targets in various parts of the society (energy, building, etc.). The CCS Directive has been transposed into national law in both Greece and Romania; Turkey does not have a law that regulates CO2. However, none of the countries report regulatory barriers to the use or subsurface storage of CO2. Various studies have been performed for Romania and Turkey that clarify the potential for capture, storage, as well as usage, such as CO2-EOR, in reducing emissions and even achieving negative emissions through the use of biomass in energy production. Less clarity exists about the potential role of CCS in Turkey, where it does not have a clear role in government climate-related strategies. However, a CO2-EOR project has been in operation in Turkey since 1986, using natural CO2. In the past decade, in Greece a large number of studies have been performed, with the aim to both build a knowledge base and explore potential for CCUS in the country. At present, there are no ongoing CCS or CCUS projects. Recent assessments have shown the potential of, for example, enhanced oil recovery, but no initiatives have been started to develop projects. CO2-EOR is relevant in all three countries. It is being deployed in Turkey, using natural CO 2, but only with the aim of enhanced oil production. The process has been studied in Greece, but is not currently deployed. The impacts of the findings presented in this report for the ERA-NET ACT ECO-BASE report are several. Several recent reports are available that present potential scenarios for the development of CCS in Romania and Greece. These will be used as starting points, updated where possible and extended with more detail on the aspect of CO2-EOR and CCS. However, data on the subsurface are not readily available in Romania or Turkey. This will impact the level of modelling that can be done to arrive at a reliable estimate of the feasibility of CO2-EOR (CO2 utilisation) and of its potential in supporting the development of CCS (CO2 storage). There is potential in supporting the inclusion of CCS in national policies of Turkey and Greece, by providing a description of the potential of CO 2-EOR in developing a CCS industry. Neither country has included CCS in its climate-related policies yet.
D
Copyright © ECO-BASE Consortium 2017-2020
Page 69
7
BIBLIOGRAPHY
Anbar, S. (2009). Development of a Predictive Model For Carbon Dioxide Sequestration In Deep Saline Carbonate Aquifers. MSc Thesis, Middle East Technical University, Petroleum and Natural Gas Engineering Department, Ankara. Anderson, B., Boswell, R., Collett, T., Farrell, H., Ohtsuki, S., White, M., & Zyrianova, M. (2014). REVIEW OF THE FINDINGS OF THE IĠNIK SIKUMI CO2-CH4 HYDRATE EXCHANGE FIELD TRIAL. Beijing, China: Proceedings of the 8th International Conference on Gas Hydrates (ICGH8-2014). ANRE. (2016). Raportul anual privind activitatea Autorității Naționale de Reglementare în domeniul Energiei pentru anul 2015. Aslanoğlu, S., & Köksal, M. (2012, July 4). Elektrik Üretimine Bağlı Karbon Dioksit Emisyonunun Bölgesel Olarak Belirlenmesi ve Uzun Dönem Tahmini. Hava Kirliliği Araştırmaları Dergisi. Bardon, C., Karaoguz, B., & Tholance, M. (1986). Well Stimulation by CO2 in the Heavy Oil Field of Camurlu in Turkey. SPE/DOE Fifth Symposium on Enhanced Oil Recovery of Society of Petroleum Engineers, SPE/DOE-14943. Tulsa, USA. Basbug, B. (2005). Modeling of Carbon Dioxide Sequestration in a Deep Saline Aquifer. MSc Thesis, Middle East Technical University, Petroleum and Natural Gas Engineering Department, Ankara. Bellona Environmental CCS Team. (2010). A bridge to a greener Greece - A realistic assessment of CCS potential. The Bellona Foundation. Bender, S. (2016). Optimization of CO2 EOR and storage design under uncertainity. PhD Thesis, Middle East Technical University, Petroleum and Natural Gas Engineering Department, Ankara. Bender, S., & Yilmaz, M. (2014). Full Field Simulation and Optimization Study of Mature IWAG Injection in a Heavy-Oil Carbonate Reservoir. SPE Improved Oil Recovery Symposium, SPE-169117-MS. Tulsa, USA. Birkedal, K., Hauge, L., Graue, A., & Ersland, G. (2015). Transport Mechanisms for CO2-CH4 Exchange and Safe CO2 Storage in Hydrate-Bearing Sandstone. 8(pp. 4073-4095). Climate Change, U. (n.d.). Climate change - Emission inventory from 1990-2015 Greece. Retrieved 10 17, 2017, from National Inventories: http://unfccc.int/national_reports/annex_i_ghg_inventories/national_inventories_submis sions/items/10116.php Dalkhaa, C. (2010). Cap rock integrity in CO2 storage. PhD Thesis, Middle East Technical University, Petroleum and Natural Gas Engineering Department, Ankara. Elidemir, S. (2014). Geochemical characterization of geothermal systems in Turkey as natural analogues for geological storage of CO2. MSc Thesis, Middle East Technical University, Geological Engineering Department, Ankara. Energy, G. M. (n.d.). Greek Ministry of Environment and Energy. Retrieved 09 28, 2017, from http://www.ypeka.gr/Default.aspx?tabid=225&language=en-US
D
Copyright © ECO-BASE Consortium 2017-2020
Page 70
Erena, A., Filip, G., Fjøsna, E., Helseth, J., Hoff, E., Perez-Garcia, C., . . . Whiriskey, K. (2012). Our future is carbon negative: A CCS roadmap for Romania. Bellona. Geological Survey of Denmark and Greenland. (2009). EU GeoCapacity - Assessing European Capacity fo Geological Storage of Carbon Dioxid: Final Report. http://www.geology.cz/geocapacity/publications/D42%20GeoCapacity%20Final%20Rep ort-red.pdf. Godec, M., Koperna, G., & Gale, J. (2014). CO2-ECBM: A Review of its Status and Global Potential. 63(Pp. 5858-5869). Gultekin, C. (2010). Feasibilty study of sequestration of carbon dioxide in geological formations. MSc Thesis, Middle East Technical University, Petroleum and Natural Gas Engineering Department, Ankara. IEA-report. (2016). 20 Years of Carbon Capture and Storage - Accelerating Future Deployment. Parice, France: OECD/IEA, International Energy Agency. IEA-Statistics. (2017, September 25). IEA - Energy Statistics for Greece 2015. Retrieved from https://www.iea.org/statistics/statisticssearch/report/?year=2015&country=GREECE&pr oduct=Indicators Ioakimidis, C., Koukouzas, N., Chatzimichali, A., Casimiro, S., & Itskos, G. (2011, June 14-16.). Energy Policy scenarios of CCS implementation in Greece. Trondheim: The 6th Trondheim CCS conference. Ioakimidis, C., Koukouzas, N., Chatzimichali, A., Casimiro, S., & Mcarulla, A. (2012). TCCS-6 Energy policy scenarios of CCS implementation in the Greek electricity sector. 23(Pp. 354-359). IPCC. (2006). 2006 IPCC Guidelines for National Greenhouse Gas Inventories. (H. Egglestone, L. Buendia, K. Miwa, T. Ngara, & K. Tanabe, Eds.) Japan: National Greenhouse Gas Inventories Programme. Ishii, H., Sarma, H., Ono, K., & Issever, K. (1997). A Successful Immiscible CO2 Field Pilot in a Carbonate Heavy-Oil Reservoir in the Ikiztepe Field, Turkey. 9th European Symposium on Improved Oil Recovery. The Hague, The Netherlands. Issever, K., Pamir, A., & Tirek, A. (1993, November). Performance of a Heavy-Oil Field under CO2 Injection, Bati Raman, Turkey. SPE Reservoir Engineering(SPE-20883-PA). Izgec, O. (2005). Experimental and Numerical Investigation of CO2 Sequestration in Deep Saline Aquifers. MSc Thesis, Middle East Technical University, Petroleum and Natural Gas Engineering Department, Ankara. Jadid, K. (2011). Chemical alteration of oil well cement with basalt additive during carbon storage application. MSc Thesis, Middle East Technical University, Petroleum and Natural Gas Engineering Department, Ankara. Karaoguz, O., Topguder, N., Lane, R., Kalfa, U., & Celebioglu, D. (2007). Improved Sweep in Bati Raman Heavy-Oil CO2 Flood: Bullhead Flowing Gel Treatments Plug Natural Fractures. SPE Reservoir Evaluation and Engineering(SPE-89400-PA). Koukouzas, N., Klimantos, P., Stogiannis, P., & Kakaras, E. (n.d.). CO2 capture and storage in Greece: a case study from Komotini NGCC Power plant. 10(3: 71-80).
D
Copyright © ECO-BASE Consortium 2017-2020
Page 71
Koukouzas, N., Lymperpoulos, P., Tasainas, A., & Shariatipour, S. (2016). Feasibility Study for The Setting Up of a Safety System for Monitoring CO2 Storage at Prinos Field, Greece. 44(052043). Koukouzas, N., Ziogou, F., & Gemeni, V. (2009). Prelimenary assessment of CO2 geological storage opportunities in Greece. Pp. 502-513, Vol. 3(4). Ministry of Energy. (2016). The Romanian Energy Strategy 2016 - 2030, with the perspective of 2050. Ministry of Environment, Water and Forests. (2012). Romania's National Climate Change Strategy 2013 – 2020. Ministry of Environment, Water and Forests. (2016). Greenhouse Gas Inventory 1989 - 2014 National Report. (Romania's Greenhouse Gas Inventory 1989-2014 v.1). Nalbandian-Sugden, H. (2015). New regulatory trends: effects on coal-fired power plants and coal demand. International Energy Associateion - IEA Clean Coal Centre, CCC/262. Okandan, E., & Hladik, V. (2012). Deliverable D5.7, CO2 Capture and Storage – Regional Awareness-Raising Workshop, 13 - 14 June 2012, Ankara, Turkey. Pan-European Coordination Action on CO2 Geological Storage. Okandan, E., Karakece, Y., Cetin, C., Topkaya, I., Parlaktuna, M., Akin, S., . . . Akalan, E. (2009). Türkiye'de Endüstriyel Tesislerden Kaynaklanan CO2 Emisyonlarının Değerlendirilmesi, Jeolojik Depolama İmkanlarının Tespiti ve Bir Petrol Sahasında Depolamanın Modellenmesi, TUBİTAK KAMAG-106G110. ODTU-PAL, Türkiye Petrolleri Anonim Ortaklığı, Enerji ve Tabi Kaynaklar Bakanlığı, Ankara. Okandan, E., Karakece, Y., Cetin, H., Topkaya, I., Parlaktuna, M., Akin, S., . . . Akalın, E. (2011). Assessment of CO2 Storage Potential in Turkey, Modelling and a Pre-Feasibility Study for Injection into an Oil Field. Energy Procedia, 4, 4849-4856. Ors, O. (2012). Investigation of the interaction of CO2 and CH4 hydrate for the determination of feasibility of CO2 storage in the Black Sea sediments. MSc Thesis, Middle East Technical University, Petroleum and Natural Gas Engineering Department, Ankara. Ozgur, E. (2006). Assessment of diffusive and convective mechanisms during carbon dioxide sequestration into deep saline aquifers. MSc Thesis, Middle East Technical University, Petroleum and Natural Gas Engineering Department, Ankara. Pamukcu, Y. Z. (2006). Simulating oil recovery during CO2 sequestration into a mature oil reservoir. MSc Thesis, Middle East Technical University, Petroleum and Natural Gas Engineering Department, Ankara. Pietzner, K., Shumann, D., & et. al. (2011). GHGT-10 Public Awareness and Perceptions of Carbon Dioxide e Capture and Storage (CCS): Insights from Surveys Administered to Representative Samples in Six European Countries. 4(Pp. 6300-6306). Proedrou, P., & Sidiropoulos, T. (1992). Prinos Field - Greece. Aegean Basin. Pp. 275-291. Rutters, H., & CGS Europe. (June 2013). State of play on CO2 geological storage in 28 European countreis. CGS Europe report No. D2.10, 89p. For CO2 Geonet & CGS Europe.
D
Copyright © ECO-BASE Consortium 2017-2020
Page 72
Saftic, B., Stead, R., & Kurelec, Z. (2012). Deliverable 5.11: Publication of the CO2GeoNet educational brochure “What does CO2 geological storage really mean?”. Pan-European Coordination Action on CO2 Geological Storage. Sahin, S., Kalfa, U., & Celebioglu, D. (2010). Unique CO2-Injection Experience in the BatiRaman Field may Lead to a Proposal of EOR/Sequestration CO2 Network in the Middle East. SPE International Conference on CO2 Capture, Storage, and Utilization, SPE139616. New Orleans, USA. Sava , C., Anghel, S., & Dudu, A. (2009). CO2 Storage Possibilities in Romania, Side Event Prospects and challenges for CCS implementation in the new EU members States and candidate countries. 5th BGS Congress - Geophysics at the Crossroads. Belgrade, Serbia. Sava, C., Andrei, J., & Heredea, N. (2006). CO2 Emissions and Geological Storage Possibilities in Romania. The 1st EU GeoCapacity Working Meeting. Toledo, Spain. Sava, S., Georgescu, C., & Scrădeanu, D. (2007). State of work in Romania. The 2nd EU GeoCapacity Working Meeting. Athens, Greece. Sinayuc, C. (2007). Modeling of enhanced coalbed methane recovery from Amasra coalbed in Zonguldak coal basin. PhD Thesis, Middle East Technical University, Petroleum and Natural Gas Engineering Department, Ankara. T.C. Çevre ve Şehircilik Bakanlığı. (2012). İklim Değişikliğinin Farkında mıyız? Ankara: Türkiye'nin İklim Değişikliği II. Ulusal Bildiriminin Hazırlanması Projesi Yayını. T.R. Ministry of Energy and Natural Resources. (n.d.). Electricity. Retrieved September 5, 2017, from http://www.enerji.gov.tr/en-US/Pages/Electricity T.R. Ministry of Environment and Forestry. (2007, January). First National Communication of Turkey on Climate Change. (G. Apak, & B. Ubay, Eds.) T.R. Ministry of Environment and Urbanization. (2010). Republic of Turkey Climate Change Strategy 2010-2023. T.R. Ministry of Environment and Urbanization. (2012). National Climate Change Action Plan 2011-2023. Ankara. T.R. Ministry of Environment and Urbanization. (2012). Turkey's National Climate Change Adaptation Strategy and Action Plan 2011 - 2023. Ankara. Tasianas, A., & Koukouzas, N. (2016). CO2 Storage Capacity Estimate in the Lithology of the Mesohellenic Trough, Greece. 86(Pp. 334-341). Türkiye Çelik Üreticileri Derneği. (2016, December 1). Çelik Haritası. Retrieved September 6, 2017, from http://celik.org.tr/harita/ Türkiye Çimento Müstahsilleri Birliği. (n.d.). Türkiye'deki Çimento Fabrikaları Haritası. Retrieved September 6, 2017, from http://www.tcma.org.tr/index.php?page=icerikgoster&cntID=204 Türkiye İstatistik Kurumu. (2015, May 25). 2013 Seragazı Emisyon Envanteri. Haber Bülteni(18744). Türkiye İstatistik Kurumu. (2017, April 17). 1990-2015 Seragazı Emisyon İstatistikleri. Haber Bülteni(24588).
D
Copyright © ECO-BASE Consortium 2017-2020
Page 73
United Nations. (1992). United Nations Framework Convention on Climate Change. United Nations. (2002, 1 21). Report of the Conference of the Parties on its Seventh Session, Held at Marrakesh from 29 October to 10 November 2001. Yenilenebilir Enerji Genel Müdürlüğü. (2012). Karbon Yakalama ve Depolama. Retrieved September 4, 2017, from http://www.eie.gov.tr/teknoloji/karbon_yakalama_depolama.aspx Zhao, J., Xu, K., Song, Y., Liu, W., Lam, W., Liu, Y., . . . Li, Q. (2012). A Review on Research on Replacement of CH4 in Natural Gas Hydrates by use of CO2. 5(Pp. 399-419).
D
Copyright © ECO-BASE Consortium 2017-2020