Arab J Geosci (2016) 9:95 DOI 10.1007/s12517-015-2182-z
ORIGINAL PAPER
Temporal and spatial assessment of pollen, radionuclides, minerals and trace elements in deposited dust within Kuwait Ali M. Al-Dousari 1 & Abdulaziz Aba 1 & Safaa Al-Awadhi 1 & Modi Ahmed 1 & Noor Al-Dousari 1
Received: 25 June 2015 / Accepted: 28 September 2015 # Saudi Society for Geosciences 2016
Abstract Sixty-seven dust collectors were installed in 47 sites all over Kuwait. Nine of these sites contain four collectors for radionuclide collection. The monitoring of dust fallout and associated pollen was conducted for 2 years from August 2009 to August 2011. The highest dust depositional rates were detected within the western areas of Kuwait. The annual amount of dust in Kuwait varies from 10 to 1065 unit with an average of 278 t/km2. The year 2010–2011 was found dustier compared to 2009–2010 by 43 %. The analysis leads to a conclusion that the northwestern, western, and northern winds play a key role in producing dust within Kuwait. Regional areas represent the dominant sources of dust fallout, while local sources contribute appreciable amounts. The very fine and fine sand particles originate from local sources as they move in the form of saltation for a short distance and represent 37 % of the average dust fallout percentages in Kuwait. There is a trend of fining in mean size of dust particles towards the east and the northeast. Mineralogically, carbonates and quartz are the major components of dust in Kuwait, feldspars are found in considerable amounts. Other minerals in the dust are gypsum, anhydrite, bassonite and heavy minerals. Carbonates are more and quartz is less towards the coastal areas compared to desert areas. Natural 40K and 210 Pb, man-made (anthropogenic) 137Cs, and cosmogenic 7 Be radionuclides were determined. The average monthly depositional rates were 35.4, 11.2, 13.2 and 0.3 Bq m−2 for 7Be, This article is part of the Topical Collection on DUST * Ali M. Al-Dousari
[email protected] 1
Crisis Decision Support Program, Environment and Life Sciences Research Center, Kuwait Institute for Scientific Research, P.O.Box:24885, Safat 13109, Kuwait
210
Pb, 40K and 137Cs, respectively, which are were comparable to similar climatologically areas around the globe. Pollen originates predominantly from regional sources. However, the presence of a large amount of pollen from Haloxylon sp. Cyperus sp. indicates that close-by regional and local areas are a major contributor of fallen dust. Keywords Dust fallout . Saltation . Suspension . Radionuclide . Pollen
Introduction Dust, travelling long distances, is commonly very fine with the predominant sizes between 0.068 and 0.02 mm (Walker and Costin 1971). Significant quantities of dust may be blown thousands of kilometres from their source (Meng and Lu 2007; Al-Dabbas et al. 2011; Awadh 2012), and it was estimated that windblown dust derived from soil erosion contributes approximately 500×106 t of particulate matter to the atmosphere each year (Peterson and Junge 1971). The northwesterly winds are mostly prevailing in Kuwait with 18 km/h as average wind speed (Safar 1980). Al-Dousari (2009) listed Kuwait as one of the highest in dust precipitation rates among other parts in the world. Safar (1980) stated that the annual average number of dusty days of dust storms or rising dust or suspended dust in Kuwait is 255.4d. Al-Dousari and AlAwadhi (2012) identify five major sources of dust, these are as follows: (1) South-western desert of Iraq, (2) The Mesopotamian Flood Plain in Iraq, (3) North eastern desert of Saudi Arabia, (4) Drained marshes (Ahwar) area in southern Iraq, and (5) Sabkhas, dry marshes and abandoned farms in Iran at northern coastal area of Arabian Gulf (Fig. 1). Therefore, this study aimed to assess the physical (particle size), chemical (mineralogy, trace elements percentages and radionuclides
95
Page 2 of 5
Arab J Geosci (2016) 9:95
Fig. 1 Dust storms major and intermediate source areas and trajectories for the northwestern areas of Arabian Gulf including Kuwait and the study area (AlDousari and Al-Awadhi 2012)
contents) characteristics and pollen contents within deposited dust in order to identify its origin, as well as to identify the distribution pattern of the dust fallout in Kuwait.
Materials and methods The selection of the site for dust collectors was based on reconnaissance field survey, analysis of satellite images (2003), 47 sites for dust collectors were selected. The particle-size fractions were determined using standard sieve analysis and Centrifugal Particle Analyzer (Shumadzu, SACP3) for dust fallout in all samples. The particle-size percentages analysis was performed for all samples within 4 months in 2010, these are as follows: January, May, August and November. The two main textural components: very fine sand (0.125–0.063 mm) and mud (less than 0.063 mm) of the dust samples were subjected to mineralogical analysis using X-ray diffraction (XRD) analysis. Also, geochemical analysis for dust sample using inductively coupled plasma atomic emission spectroscopy (ICP.OES) was used to trace main concern
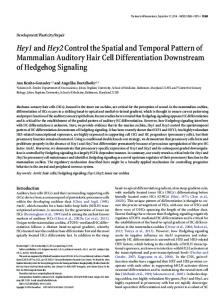
Fig. 2 Average monthly dust fallout for 2011
elements (Na, K, Ca, Mg, Al, Fe, V, Cr, Pb, Ba, Ti and Tl) as these elements act as good tracers for dust sources. The crushed powders from defined particle-size fractions were analysed using ICP (inductively coupled spectrometry plasma) for major and trace elements (Na, K, Ca, Mg, Al, Fe, V, Cr, Pb, Ba, Ti, and Tl). The reason for using ICP to analyse major elements was because some size fractions had less weight than that needed (7 g) for analysis by XRF. Only 2 g (+/−0.05) of powder is used in the ICP method. The sediment samples were dissolved with hydrofluoric acid, together with nitric acid (HNO3), in a platinum crucible. Four samplers were installed at nine sites (D1, 10, 13, 19, 24, 27, 28, 33, 34), among the 47 sites, to accumulate an adequate sample mass required for radioactivity determination. These nine sites are distributed around Kuwaiti borders and in Kuwait City in order to identify the sources and changes around radionuclides among deposited dust. The concentrations of radionuclides were determined using ultra low background gamma spectrometry equipped with high resolution broad energy germanium (BEGe) detector. Thirty sand traps were used for trapping pollens from the air. The traps
Arab J Geosci (2016) 9:95
Page 3 of 5 95
Fig. 3 Annual dust fallout for 2009–2010 (left) and 2010–2011 (right), showing sampling sites for dust (dark and double circle) and with pollen (dark circle)
are 30 cm radius and 50 cm depth and were located in D (1, 3, 7, 8, 9, 10, 12, 13, D14, 15, 16, 17, 20, 22, 25, 26, 27, 28, 29, 30, 33, 34, 36, 38, 39, 40, 41) (Fig. 3). These traps were distributed all over Kuwait covering all geomorphological and vegetation classes in Kuwait. A sample for each month in a 2-year period was collected. Each sample was analysed for pollen grain and spore content.
the Western Desert of Iraq and Mesopotamian Flood Plain (Al-Dousari 2009). In addition to local dust deposition that produces relatively coarse saltated dust material larger than 63 mm particle-size fractions. The former type represents 63 %, while the latter is 37 %. Generally, the distribution of particle size is trimodal and slight variation with time (Fig. 4). Mineralogical analysis
Results and discussion
Figure 2 illustrates the average fallen dust for all months. The western areas of Kuwait show higher amounts of average deposited dust compared to coastal areas as shown in the deposition of fallen dust in Fig. 3 for the duration August 2009–August 2011.
The XRD semi-quantitative results show that quartz carbonates especially calcite are the major minerals in the dust fallout samples of the study area. Feldspars are found with appreciable amounts (13 % in average), while other minerals with small percentages (3 %). Quartz percentage varies from 35 to 52 % with average of 44 %. Generally, quartz percentages increase with decrease of carbonates during summer time due to the increase in aeolian activities.
Particle size characteristics
The trace elements analysis
The long distance suspended dust consists of mud particles that dominantly originated from regional sources such as
The average concentration of the major elements was presented in Table 1. The iron is an important element for the marine
Variations of dust deposition rates in Kuwait
Fig. 4 Average of mean particlesize percentages of dust fallout in Kuwait
95
Arab J Geosci (2016) 9:95
Page 4 of 5
Table 1
Average concentration of the major elements in dust samples
ICP elements
Na
K
Ca
Mg
Al
Fe
V
Cr
Pb
Ba
Ti
Tl
Average STD Max Min
9091 7674 62,771 941
18,035 26,458 178,613 848
48,318 26,916 115,515 1247
10,822 2572 14,774 1192
41,246 13,649 80,108 2999
27,309 25,713 191,413 1851
70 23 153 11
251 343 2128 28
2169 1685 8543 6
511 879 4979 47
2328 1040 8873 4
4 3 14 3
1000 7
Cs
1
0.1
The depositional fluxes of the natural radionuclides (40K, Pb and 7Be) and the man-made radionuclide (137Cs) have been measured in nine sampling sites covering Kuwait. The calculated averages of the monthly deposition rates were 35.4, 11.2, 13.2 and 0.3 Bq.m−2 for 7Be, 210Pb, 40K and 137Cs, respectively. The obtained results of are comparable to those obtained for similar climatologically areas around the globe (Baskaran 2011; Preiss and Genthon 1997; Brost et al. 1991). The temporal variations of the radionuclides depositional
16/09/2011
23/10/2011
04/07/2011
10/08/2011
28/05/2011
21/04/2011
15/03/2011
06/02/2011
24/11/2010
31/12/2010
18/10/2010
11/09/2010
05/08/2010
23/05/2010
29/06/2010
16/04/2010
01/02/2010
10/03/2010
fluxes showed temporal tendency; of the highest in spring months (February, March, April); the time where the precipitation rates are highest and hence more dust washed out, and the lowest in October–November each year (Fig. 5). However, the correlation of depositional fallout and the radionuclides fluxes was in the order of 40K