IJCBS, 2(2012):7-13
International Journal of Chemical and Biochemical Sciences Journal Home page: www.iscientific.org/Journal.html © International Scientific Organization
Temporal and spatial distribution of lead and total suspended particles in ambient air of Faisalabad, Pakistan Yasir Niaz1, Munawar Iqbal2*, Nasir Masood3, T.H. Bokhari4, M.A. Shehzad5 and Mazhar Abbas2 1
Department of Structures and Environmental Engineering, University of Agriculture, Faisalabad-38040, Pakistan 2
Department of Chemistry and Biochemistry, University of Agriculture, Faisalabad-38040, Pakistan
3
University College of Agriculture and Environmental Sciences, The Islamia University of Bahawalpur, Pakistan 4
Department of Chemistry, Government College University, Faisalabad-38000, Pakistan 5
Department of Agronomy, University of Agriculture, Faisalabad-38040, Pakistan
. Abstract According to Pakistan National Environmental Quality Standards (NEQS) and U. S. Environmental Protection Agency (USEPA), the air pollutants such as Lead (Pb), Total Suspended Particulate (TSP) and their variation in Faisalabad city was evaluated in the present study. The concentration of TSP and Pb were measured at 24 sites continuously for three month by standard methods. Results showed that TSP and Pb concentration in the ambient environment of Faisalabad city was much higher in dry condition, while reduces lower the limits of NEQS in rainy season, but still higher in comparison to the USEPA ambient air quality standards. The concentration of TSP was found ranging from 160-506 µg/m3 with average value 363 µg/m3 and Pb contents were recorded 0.062 to 18 µg/m3 (4.33 µg/m3 average) during whole study period. Furthermore, it was found that the vehicular and industrial areas showed significantly higher Pb and TSP values verses residential area. Key words: Faisalabad, Pb, TSP, Ambient Air Quality, NEQS and USEPA standards Full length article Received: 28-02-2012 Revised: 11-06-2012 *Corresponding Author, e-mail:
[email protected]
1. Introduction Faisalabad is the third largest city in Pakistan after Karachi and Lahore and second largest city in Punjab, formerly known as Lyallpur and situated at 31° 25' 0" N/73° 5' 0" E. Faisalabad gross domestic product is expected to rise to $67 billion in 2025 at a growth rate of 5.7% and has a population of 6 million at present. At the same time, it has high energy consumption and dense transport system. The most closely related health problem due to dense transport system is the air pollution [1]. Air pollution can lead to various health as well as environmental problems [2-4]. In urban centers, high vehicle density is also source of noise pollution, which is associated with hearing loss and sleep destruction [5-6]. Finally, rising rates of traffic overcrowding can lead to increased stress levels and results loss in productivity [7]. As a result of worsening ambient air quality, there are growing concerns about the exposure of citizens to air pollutants. Faisalabad has become one of the regions in Punjab, Pakistan, where control of air pollution is crucial. Due to progress of rapid urbanization and development of society and economy, Faisalabad, just like other metropolitan cities in the world, is facing pressure for Niaz et al., 2012
Accepted: 23-07-2012
Available online: 31-07-2012
environment protection and the restoration of environmental damage is needed. Despite these problems, the monitoring authorities have no monitoring and controlling systems of these negative impacts of transport systems and industries as well [8-9]. Heavy metals are released into the biosphere by human activities, which are responsible for various disorders. They are predominately transferred as particulate matter in to the air and related territories. The amount of anthropogenically derived heavy metals has increased continuously since the beginning of the industrial revolution [10]. Among heavy metals, lead is one of the prominent examples for anthropogenic environmental pollution [11-12] and is known to a major contributor of asthma, obstructive pulmonary diseases, exacerbations and chronic bronchitis [13-14]. It is believed that anthropogenic releases of lead in the environment in the modern era is attributable to the use tetraethyl lead in gasoline as an anti-knocking agent and it is responsible for air pollution. Similarly, The TSP is another aspect of environmental pollution and usually formed by condensation of vapors produced either by high temperature or by chemical processes. Particles in the range of 0.05-2 µm are usually formed by coagulation of smaller particles or 7
IJCBS, 2(2012):7-13
from smaller particles through vapor condensation. The fine particulates are small enough to bypass the screening of the nose and can penetrate alveoli and get deposited in the upper respiratory tract and are responsible for various health problems. The particulate matter is emitted from fuel combustion in motor vehicles as well as due to combustion, industrial activities, residential, agricultural burning and during interaction of other pollutants [15-17]. The use of air pollution index NEQS and USEPA values, based on the ambient concentrations, is better method to assess air quality and thus, NEQS and USEPA was used to evaluate ambient air quality in Faisalabad. To assess the air quality, the lead and TSP and their variation in 2010 was studied. This research was conducted to evaluate the effect of season and different sites on concentration of Pb and TSP in Faisalabad.
put in sand bath at 90°-100° and evaporated to dryness. Now added the solution 150 mL in it and centrifuged for 15 mints at 350 rpm to removed undisclosed matter. After centrifuging, solution were transferred into clean plastic bottle and stored in a refrigerator for further analysis by atomic absorption spectrometer. The plastic bottle used in last step was cleaned by dipping in 10% HNO3 overnight followed by immersion in 2% HNO3 for a day with subsequent washing by distilled water. From samples, the concentration of lead was measured in term of µg/m3 of air samples according to prescribed method17.
2. Materials and methods
2.2. Statistical analysis One way ANOVA was performed using Statistica (version 8.1. Stat soft Inc, Tulsa Okahoma, USA) at 95% confidence interval of mean and all the experiments were seeded in triplicate and data thus obtained was reported as mean ± SD.
2.1. Sample collection and measurement of Pb and TSP’s The High volume sampler was used for sampling of particulate available in Department of Structures and Environmental Engineering, University of Agriculture, Faisalabad, Pakistan. A high flow rate blower (1.13 m3/min) was used which draws the air sample through a covered housing on to a (20 cm x 25 cm) rectangular glass fiber filters. The intake dimension and normal flow rate are believed to limit aerosol collection to particulate matter less than 100 µm diameters. Glass fiber filters were used because of their gradual head loss build up characteristics and nonhygroscopic properties. The collection of oily particles or sampling during foggy condition may lead to decreased sampling flow rates which was avoid during sampling. At the end of sampling filters were folded in such a way that surface containing the deposit face each other. The filter was weighted to get a net weight of deposit. It replaced in an air tight polythene bag after being labeled and stored. The mass of TSP were measured by weighting the filters before and after sampling using analytical balance. From the mass of the filter paper and the volume of air sample, the mass of concentration of TSP in the ambient air was calculated in microgram per cubic meter. The dust monitoring analyzer was calibrated once every 24 hours. Hi-Vol air samplers, HV-500F, AC 100v 50/60Hz, SIBATA (Japan) were used for Total Suspended Particulate (TSP). These samplers have maximum capacity of sucking air at the rate of 800 liters/min, which can be adjusted according to the requirement of investigation. To run these samplers, electric supply was provided from the Air Monitoring Mobile generator to ensure continuous sampling. After collection of samples, filters were being preserved in the refrigerator. A steel cutter of 2 cm diameter was used to on three pieces of folded paper (doubled). The filters pieces were place in inner Teflon container of 45 mL capacity. Using pipette 2 mL of concentrated nitric acid, 4 mL of hydrofluoric acid, and 0.5 mL of hydrogen per oxide were added to filters pieces in the digester vessel. After putting Teflon vessel in outer container, the bomb was closed firmly. The digestion bomb was heated in microwave oven for one minute at 350 watts power after which it was allowed to cool overnight. The bomb were opened when it was cold down and inner Teflon vessel was removed and
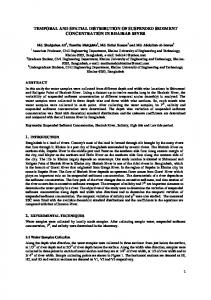
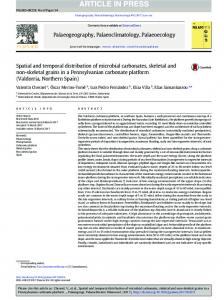
3. Results and Discussion The TSP contents were calculated for period of 82 days (24 samplings) at 24 different sites and are given in table 1. The TSP concentration was less than NEQS from 1/6/2010-14/6/2010 and subsequently increased and remained above the NEQS values until 15/7/10. In month of August, there was a sudden decrease in TSP values and as a result it became lower than the values of both NEQE (Table 2) and USEPA (www.epa.gov/air/criteria.html) standards. In comparison with USEPA Standard (150 µg/m3) the concentration of TSP remained above the permissible value until 31/7/2010. Over all, the concentration of TSP was found ranged from 160-506 µg/m3 with average value 363 µg/m3. The mean concentrations of TSP was also higher than Chinese (our neighbor country having very dense population) air quality secondary standard limits (0.20 mg/m3), Hong Kong (80 μg/m3) [19], Chinese air quality tertiary standard limits (0.30 mg/m3). The average three month concentrations of TSP was also found higher than Chinese secondary standards (100 μg/m3), Hong Kong (55 μg/m3), USEPA national ambient air quality standards (50 μg/m3) [19] and for European Commission Ambient Air Quality Standards (30 μg/m3). It can be seen that, the concentrations of TSP in Faisalabad city was found higher in that area where the vehicular density was high and weather condition were also found considerably effective, because in rainy days the TSP concentration has been recorded minimum. It is therefore, concluded that TSP pollution in ambient air of city is a serious problem and vehicles had become a significant (P vehicular + industrial > vehicular + commercial > industrial + residential > residential. Similar results have also been reported by other researchers for other big cities of Pakistan, that with the passage of time, the air quality is becoming more worsen [20]. Similar trend has been found for the concentration of Pb in air. The concentration of Pb measured in same area and date like TSP. Total Pb contents were also measured for period of 82 days (24 samplings) at 24 sites (Table 1 and Fig. 9) and Pb observed values on different dates, month variation, station wise and cumulative frequency and are given in Figs. 5-8. The Pb concentration was less than NEQS and USEPA on 1/6/2010 and increased subsequently and remained above the NEQS values until 12/7/10. In month of August, there was a sudden decrease in Pb values and reduced verses standard values of both NEQE and USEPA standards. Month wise distribution of Pb was also found much high in June and afterword than there was a steady decrease and observed lower than NEQS and USEPA in August on average basis. The vehicular area showed more contribution regarding the distribution of Pb. The order of Pb was found as vehicular >>> commercial + industrial > residential. Overall, the TSP and Pb contents were found prominent in the ambient air environment of Faisalabad City verses previous reports as compared to other Pakistan big cities (Islamabad, Karachi, Lahore, Peshawar, Quetta and Niaz et al., 2012
Rawalpindi; 188, 194, 202, 250 and 191 µg/m3, respectively) as well as other countries (Bangkok (Thailand), Singapore, Tokyo (Japan), Busan (S. Korea), Seoul (S. Korea), Daegu (S. Korea), Incheon (S. Korea), Jakarta (Indonesia), Manila (Philippines), Hanoi (Vietnam), Shanghai (China), Kathmandu (Nepal), Colombo (Sri Lanka), Dhaka (Bangladesh), Kalkata (India) are 60, 31, 30, 60, 61, 58, 62, 100, 40, 112, 100, 129, 80, 131 and 122 µg/m3, respectively) [20]. Similarly, the enhanced Pb contents were also found higher as compared to previous studies. Qadir and Zaidi [21] reported the levels of Pb (549 ng/m3) in Faislabad, while Saqib and Jaffar [22] reported the mean 48-h Pb levels in Lahore, Karachi, Peshawar, and Quetta in the range of 2-5 μg/m3. Daily mean concentration were lower during August as compared to July and June, which implied that the value of Pb and TSP was related to weather background, air circulation and rainfall. In order to maintain sustainable and coordinated development, Faisalabad authorities must have taken a series of appropriate measures and should made great progress in controlling ambient air pollution. The greenbelt area per person and the greenbelt vegetation can cover ambient air pollution. However, in the process of rapid urbanization and rapid development of society and economy, Faisalabad, just like most of the developing countries and metropolitan cities in the world, is facing more and more pressure to protect the atmospheric environment. In fact, air environmental pollution has to some extent restricted sustainable development and damaged citizen health. There are several possible causes of the worsening of ambient air quality in Faisalabad city such as rapid development of the economy, shortage of electric power and emissions of waste from 11
IJCBS, 2(2012):7-13
industrial site. According to the reports, vehicular and industrial oil utilization is much high to meet the energy crises and as a result the emission of Pb and TSP in ambient air in Faisalabad city increased quickly. Our measured value found to be much higher than reported by Shahid et al. [23] for different cities of Pakistan including Faisalabad, which indicates that the pollution increasing rate is much higher as compared to population growth. This unbalanced increment in ambient air quality is attributed to the negligence of corresponding authorities. To reduce production costs, high sulphur coal and petroleum are used by many companies, industries and manufactories in Faisalabad without any control measures and as a result of this the total emissions of atmospheric pollutants has been raised along with rapid socioeconomic development and increased energy consumption. Faisalabad city has severe drought condition and the total annual rainfall is less than the usual annual quantity required. Landing typhoons, and strong updrafts and downdrafts in the ambient air of Faisalabad are lacking, so air pollutants cannot be easily diffused and diluted. It has been noted that the emission volume of pollutants in Faisalabad ambient air will increase, because the EP authorities seems to having no positive or initiative step in this regard. So, it is necessary to optimize energy consumption, utilization of clean fuels and renewable energy and augmentation in the vegetation cover as well as improvement in ecological service and implement an integrated environmental plan within region in future, is a best way to control the pollution at initial step [24]. In order to greatly improve the quality of the air environment and to carry out international agreements to mitigate climate change, rigorous and forceful measures should be adopted and the emission volume of pollutants must be controlled, the sustainable develop economic mechanism would be built to optimize the energy structural imbalance in the long term planning. 4. Conclusion The increased load of Pb and TSP in Faisalabad city air seems to be a serious problem. The Pb and TSP values were found up to 18 µg/m3 and 506 µg/m3, respectively and these values are considerably higher as compared to previous reports as well as the ambient air quality standards. The contents of both pollutants were found enough high in normal weather condition as compared to NEQS and USEPA standards and this situation became more worsen in dry season because the within 82 days, the difference of Pb and TSP values was found significantly different in Faisalabad city ambient air. The concentration of Pb and TSP were found significantly different in vehicle dense and industrial areas as compared to residential area which is an indication of Pb and TSP source and pollution in that area. Acknowledgements The authors are thankful to the Punjab-EPD, for providing air monitoring mobile generator for sampling. References [1]
[2]
Y.L. Guo, Y.C. Lin, F.C. Sung, S.L. Huang, Y.C. Ko and J.S. Lai. (1999). Climate, traffic-related air pollutants, and asthma prevalence in middle-school children in Taiwan. Environmental Health Perspective. 107: 1001-1006.
[3]
R. Stott. (2000). Carson’s syndrome: a major threat to the public’s health in the twenty-first century. Medicine, Conflict and Survival. 16: 94-103 (2000).
[4]
J.A. Patz, D. Engelberg and J. Last. (2000). The effects of changing weather on public health. Annual Review of Public Health. 21: 271-307.
[5]
N.M. Singh and S.N. Rao. (2001). A reconnaissance of traffic noise pollution in the city of Patna. Indian J. Environ. Health. 43: 138-43.
[6]
C.L. Wong, W. Chau and L.W. Wong. (2002). Environmental noise and community in Hong Kong. Noise and Health. 4: 65-69.
[7]
D.C. Greenwood, K.R. Muir, C.J. Packham and R.J. Madeley. (1996). Coronary heart disease: a review of the role of psycho-social stress and social-support. Journal of Public Health Medicine. 18: 221-31.
[8]
A. Kristin and X.C. Pan. (2004) Exposure-response functions for health effects of ambient air pollution applicable for China- ameta-analysis. Science of the Total Environment. 329: 3-16.
[9]
Z. Kai, Y.H. Ye, L. Qiang, L. Ai-Jun and P. ShaoLin. (2007). Evaluation of ambient air quality in Guangzhou, China. Journal of Environment Science. 19: 432-437.
[10]
M. Kashefi, P. Salaryan, N. Hazeri, J. Valizadeh, A. Abdi, M.S. Mohammadnia. (2012). Biosorption of Cr (VI) from aqueous solutions using Carum copticum stem. International Journal of Chemical and Biological Sciences. 1: 48–53.
[11]
M. Alam, R. Nadeem and M. I. Jilani. (2012). Pb(II) removal from wastewater using Pomegranate waste biomass. International Journal of Chemical and Biological Sciences. 1:24-29.
[12]
G.J.K. Komarnicki. (2005). Lead and cadmium in indoor air and the urban environment. Environmental Pollution. 136: 47-61.
[13]
C.A. Pope, R.T. Burnett, M.J. Thun, E.E. Calle, D. Krewski K. Ito and G.D. Thurston. (2002). Lung cancer, cardiopulmonary mortality, and long-term exposure to fine particulate air pollution. Journal of American Medical Association. 287: 1132-1141.
www.smeda.org/downloads/Cluster_Profile_Light Engineering.pdf.
Niaz et al., 2012
12
IJCBS, 2(2012):7-13
[14]
WHO (World Health Organization). (2002). The World Health report: Reducing risks, promoting healthy life, Geneva.
[15]
R. David, L.M. Sthephane, G. Yvon, G.C. Alain and G. Catherine. (2004). The origin of atmospheric particles in Paris: a view through carbon and lead isotopes. Atmospheric Environment. 38: 953-961.
[16]
[17]
J. Hiniches O. Dellwig and H.J. Brumsack. (2002). Lead in sediments and suspended particulate matter of German Bight: natural versus anthropogenic origin. Applied Geochemistry. 17: 621–632. A.G. Hilary. (2001). The biological chemistry of lead. Current Opinion in Chemistry and Biology. 5: 223–227 (2001).
[18]
U. S. EPA methods. (1986). Laboratory manual physical and chemical methods. SW-846. 3rd ed., Washington, DC, U. S. EPA.
[19]
USEPA (U.S. Environmental Protection Agency). National ambient air quality standards. Accessible online at http://www.epa.gov/air/criteria.html.
Niaz et al., 2012
[20]
Colbeck, Z.A. Nasir and Z. Ali. (2010). The state of ambient air quality in Pakistan-a review. Environmental Science Pollution Research. 17: 4963 (2010).
[21]
M.A. Qadir and J.H. Zaidi. (2006). Characteristics of the aerosol particulates in the atmosphere in an urban environment at Faisalabad, Pakistan. Journal of Radioanalytical and Nuclear Chemistry. 267: 343-348 (2006).
[22]
M. Saqib and M. Jaffar. (2004). High volume sampling and dithizone scrubbing-based estimation of aerosol lead levels at Islamabad, Pakistan. Journal of Chemical Society of Pakistan. 26: 52-56.
[23]
A.K. Shahid, M.R. Sajid, K. Hussain and H.M.Y. Tabassom. (2007). comparative study of Environmental Air-born particulate pollution in different areas of the Punjab, Pakistan. Nat form environ. 6: 32-41 (2007).
[24]
M. Iqbal, Y. Niaz, M. Mushtaq, R.A. Khera, F. Cecil, M.A. Waqar, M. Abbas and T.H. Bokhari. (2012). Evaluation of Ambient Air Quality in Faisalabad, Pakistan. Asian Journal of Chemistry. 24(10): In press.
13