AQUATIC MICROBIAL ECOLOGY Aquat Microb Ecol
Vol. 39: 211–223, 2005
Published June 20
Temporal distribution of viruses, bacteria and phytoplankton throughout the water column in a freshwater hypereutrophic lake V. J. Goddard1, A. C. Baker1, 2, J. E. Davy1, D. G. Adams2, M. M. De Ville3, S. J. Thackeray 3, S. C. Maberly3, W. H. Wilson1, 4,* 1
Marine Biological Association of the UK, The Laboratory, Citadel Hill, Plymouth PL1 2PB, UK 2 Department of Biochemistry and Molecular Biology, University of Leeds, Leeds LS2 9JT, UK 3 Centre for Ecology and Hydrology, Lancaster Environment Centre, Library Avenue, Lancaster LA1 4AP, UK 4 Plymouth Marine Laboratory, Prospect Place, Plymouth PL1 3DH, UK
ABSTRACT: Analytical flow cytometry (AFC) and denaturing gradient gel electrophoresis (DGGE) were used to investigate the diversity and dynamics of viruses, bacteria and phytoplankton communities in a hypereutrophic freshwater lake. Samples were taken from different depths throughout the water column over an annual cycle. Priest Pot is a small lake in the Lake District in NW England (UK), and has been well characterised in previous studies; however, little is known of the diversity and dynamics of the virus community. Virus abundance was shown to change over both spatial and temporal scales, and appeared to be closely linked to other biotic and abiotic parameters. The highest virus concentrations occurred in the deepest part of the lake at a depth of 3.2 m, in the anoxic layer, at the same time as a peak of abundance of green sulphur bacteria. Sequence analysis of a DGGE band that occurred at the same time suggested a bacterium similar to Chlorobium spp., a green sulphur bacterium, comprised part of this bacterial bloom. KEY WORDS: Viruses · Microbial community dynamics · Freshwater · Flow cytometry Resale or republication not permitted without written consent of the publisher
Viruses are the most numerically abundant entities in aquatic habitats. Virus concentrations have been shown to range between 4.8 × 10⁶ and 1.4 × 10⁷ ml–1 in marine systems (Bergh et al. 1989, Wommack & Colwell 2000, Weinbauer 2004), and numbers are often an order of magnitude higher in freshwater (Maranger & Bird 1995). Virus abundance is also generally higher in habitats with higher nutrient status in both freshwater (Bettarel et al. 2003b) and marine systems (Bratbak et al. 1994), possibly as a result of higher bacterial numbers in these environments. The impact of viruses on their host communities is significant, with as much as 34% of bacterial production in freshwater estimated to be lost through viral lysis (Hennes & Simon 1995, Mathias et al. 1995, Bettarel et al. 2003a).
Although many studies have investigated virus–host interactions in freshwater habitats (Mathias et al. 1995, Weinbauer & Höfle 1998a, Fischer & Velimirov 2002, Bettarel et al. 2004), none have been carried out over both spatial and temporal scales in any detail. This is the first study of a complete freshwater microbial community, including viruses, that extends over an entire annual cycle. We aimed to gain a clearer picture of virus community dynamics throughout the water column of Priest Pot, a small hypereutrophic lake in the English Lake District (Cumbria, UK), over a whole annual cycle. Priest Pot has been extensively studied, and the seasonal changes that occur in the physical and chemical characteristics of the water column, and the phyto- and zooplankton communities have been well documented (Finlay & Maberly 2000). The water column is mixed and oxygenated in the winter and
*Corresponding author. Email:
[email protected]
© Inter-Research 2005 · www.int-res.com
INTRODUCTION
212
Aquat Microb Ecol 39: 211–223, 2005
early spring. During early summer, the lake stratifies and high nutrient concentrations support a large microbial biomass, which leads to oxygen depletion at depth. During the autumn, the water cools and the stratification eventually breaks down as oxygen becomes available at depth. The stratified water column provides a large number of diverse niches in which different organisms can proliferate, generating a dynamic and complex microbial community. Although Priest Pot has been well studied, the role of viruses within the microbial community has received little attention. The different microbial communities were enumerated by analytical flow cytometry (AFC), an accurate way of screening large numbers of samples; this technique has been shown to be useful in studies of microbial ecology, and has been used to enumerate viruses (Marie et al. 1999, Larsen et al. 2001), bacteria (Gasol et al. 1999) and phytoplankton (Olson et al. 1985, Binder et al. 1996, Crosbie et al. 2003) from a range of aquatic systems. The diversity of potential bacterial and phytoplankton host populations was determined by denaturing gradient gel electrophoresis (DGGE) separation of PCR amplified 16S and 18S rDNA, respectively. DGGE has been widely used to monitor diversity and dynamics within aquatic microbial populations, and remains a powerful tool in this field (Casamayor et al. 2002, Ovreas et al. 2003). A previous study suggested that the virus community in Priest Pot was closely coupled to both the bacteria and phytoplankton communities in the surface layer (Goddard et al. unpubl.). In the present study we investigated the effect of depth, and the steep physical and chemical gradients that develop during the year in Priest Pot, on the dynamics of microbial and virus communities.
MATERIALS AND METHODS Sampling. Samples were taken from Priest Pot every 2 wk from March to May 2002, then monthly until April 2003. Samples for flow cytometry (2 to 5 ml) were taken using a pneumatically operated sampler modified from the design of Heaney (1974), so that samples of up to 180 ml could be collected simultaneously from each of 16 depths. All samples were taken from the centre of the lake. Samples for bacteria and phytoplankton diversity were taken using an acid and sample rinsed 250 ml glass bottle sealed with a rubber bung attached to a line, and weighted with a brass weight. The bottle was lowered to the appropriate depth, then the bung was jerked off with a sharp tug; the bottle was returned to the surface when full. All samples were processed or fixed immediately on arrival at the laboratory.
Physical and chemical measurements. Nitrate, phosphate, silicate and oxygen analyses were carried out using the methods detailed in Mackereth et al. (1978). Algal chlorophyll a and bacterial chlorophylls c and d were analysed using the method of Caraco & Puccoon (1986). Phytoplankton, bacteria and virus enumeration. All counts were carried out on a FACScan flow cytometer (Becton Dickinson), equipped with an air cooled laser providing 15 mW at 488 nm, with the standard filter set-up. For phytoplankton enumeration, fresh samples (collected from the 26 March 2002 to the 17 December 2002) were analysed for 3 min at a flow rate of 90 µl min–1, using red fluorescence as the trigger. When viewing the scatter plots, the majority of the different groups were easier to distinguish when plotted on the basis of orange fluorescence versus side scatter. Samples for virus and bacteria enumeration (collected from the 26 March 2002 to the 8 April 2003) were fixed in a final concentration of 0.5% gluteraldehyde (Sigma, EM grade) overnight at 4°C, and stored at –80°C for analysis at a later date. (Note that recent research by Brussaard [2004] has shown that this method may have underestimated virus numbers.) For virus enumeration, 10 µl of fixed sample was diluted in 980 µl TE (Tris-ethylenediaminetetraacetic acid; 10 mM Tris, 1 mM EDTA) and incubated at 80°C for 10 min with 10 µl 1/1000 concentration SYBR Green 1 (Molecular Probes) in the dark. Samples were analysed for 2 min at a flow rate of 30 µl min–1 with the discriminator set on green fluorescence. For bacteria enumeration, 100 µl of fixed sample was diluted 10-fold in TE, and incubated with 10 µl of 1/1000 concentration SYBR Green 1 for 15 min at room temperature in the dark, and samples analysed as above. In each case, distinct virus, bacteria or phytoplankton groups were identified from scatter plots of side scatter versus fluorescence using Cellquest software (Becton Dikinson) (Fig. 1). Bacteria and phytoplankton diversity. The diversity of bacteria and phytoplankton communities was measured by DGGE of PCR amplified 16S and 18S rDNA fragments, respectively. Prokaryotes and eukaryotes were harvested from approximately 100 to 200 ml water onto 47 mm diameter 0.2 µm Durapore filters (Millipore) by vacuum filtration. The filters were cut into strips and stored at –80°C until processing. DNA extraction was carried out using an adaptation of the CTAB (1% N-cetyl N,N,N-trimethylammonium bromide) method (Goddard et al. 2001). Half filters were incubated in lysis buffer (0.5% sodium dodecyl sulphate [SDS], 20 µg ml–1 Proteinase K) for 1 h at 55°C. Eighty µl of 5 M NaCl and 150 µl of CTAB buffer (2% [w/v] hexadecyltrimethylammonium bromide [Sigma], 1.4 M NaCl, 20 mM EDTA, 100 mM Tris HCl [pH 8.0]) were added and incubated for a further 15 min at 65°C,
Goddard et al.: Freshwater microbial community dynamics
213
followed by chloroform isoamyl alcohol (24:1) extraction. Extracted DNA was then precipitated in 0.6 volumes of isopropanol at room temperature and pelleted by centrifugation at 14 000 × g for 30 min. Recovered DNA was resuspended in 100 µl of TE (pH 8.0) and stored at –20°C. PCR reactions were carried out using primers 8f (Weisburg et al. 1991) and 534r (GC) (Muyzer et al. 1993) for amplification of a section of the bacterial 16S rRNA gene, including the variable V3 region, and 1427f (GC) and 1616r (van Hannen et al. 1998) for amplification of a fragment of the eukaryotic 18S rRNA gene. All PCR reactions were carried out using 1 µl of a 1/100 dilution of extracted DNA as template. This was added to a reaction mix containing 1 U of Taq DNA polymerase (Promega), 1 × PCR buffer (Promega), 0.25 mM deoxynucleoside triphosphates (dNTPs), 2.5 mM MgCl2 and 20 pmol of each primer (8f/534r[GC] for 16S rDNA amplification and 1427f[GC]/1616r for 18S rDNA amplification). The PCR was conducted on a PTC100 thermocycler (MJ Research) with 30 cycles of 1 min denaturing at 94°C, 1 min annealing at 52°C and 1 min extension at 72°C. An initial denaturing step of 3 min at 94°C and a final extension of 5 min at 72°C were also included. PCR products were verified by agarose gel electrophoresis. DGGE separation of PCR products was carried out on a parallel gradient of 30 to 50% denaturant in an 8% acrylamide gel (where 100% denaturant is 7 M urea and 40% deionized formamide). Electrophoresis was carried out on a DCode universal mutation detection system (Biorad) for 3 h at a constant temperature of 60°C. Gels were stained in a 1× solution of SYBR gold (Molecular Probes) for 30 min at room temperature, and band patterns visualised on a UV transilluminator on a low intensity setting, and photographed with the Gel Doc 2000 system (Bio-Rad). Selected bands for sequence analysis were picked from the gels by removing plugs with wide bore 200 µl tips. Polyacrylamide plugs were placed in 200 µl of TE
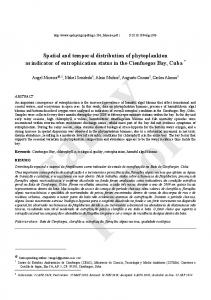
Fig. 1. Flow cytometry scatter plots showing characteristic groups obtained from Priest Pot water samples. (A) Virus Groups V1 to V4 obtained from samples stained with SYBR Green I (Molecular Probes), run using flow cytometry settings specific for the detection of viruses. (B) Bacteria Groups B1 and B2 obtained from samples stained with SYBR Green I, run using settings specific for the detection of bacteria. Scatter plots A and B were both obtained from the same sample taken on 26 March 2002. (C) Phytoplankton Groups P1 to P6 obtained from unstained samples, using settings specific for the detection of autofluorescent phytoplankton and picoplankton. Sample from 8 May 2002. (D) Groups P7 and P8 detected in unstained samples, using the same settings as for C. Sample from 8 October 2002
214
Aquat Microb Ecol 39: 211–223, 2005
and heated to 94°C for 10 min, then cooled to 4°C. Eluted bands were then stored at –20°C prior to reamplification. For the 16S rDNA bands, 1 µl of eluate was used as the template for reamplification using the PCR conditions detailed above, with modifications. Reamplification was carried out in half volume reactions (25 µl), the annealing temperature was increased to 60°C and 25 cycles were carried out instead of 30. For the 18S rDNA bands, 1 µl of 1/100 diluted eluate was used as the template for reamplification using the modified conditions detailed above. Reamplified bands were verified on agarose and DGGE gels as described above. Reamplified 16S rDNA and 18S rDNA DGGE bands for sequencing were treated with Exo SAP-IT (USB) to remove unused primers and nucleotides, according to the manufacturer’s instructions. Sequencing reactions were carried out on a PTC100 thermocycler (MJ Research), using a BigDye Terminator v3.1 cycle sequencing kit (ABI), with 8f and 1616r as the sequencing primers for 16S rDNA and 18S rDNA bands, respectively. Cycle sequencing was carried out following the manufacturer’s instructions, the only modification being an increased annealing temperature of 60°C during the cycle sequencing reactions. Sequences were determined on an ABI 3100 capillary sequencer, and similarity to known sequences determined using the BLAST database (www.ncbi.nlm.nih.gov). The sequences obtained in this study are available in GenBank (see Table 1 for accession numbers).
RESULTS Spatial and temporal variations in environmental conditions Changes in water temperature, dissolved oxygen, nitrate, phosphate, algal chlorophyll a and bacterial chlorophyll c and d concentrations were measured at different depths throughout the annual cycle from March 2002 to March 2003 (Fig. 2). Water temperature ranged between 3.7 and 18°C over the annual cycle, with the highest temperatures recorded in the summer in the surface waters. During this time, the difference between the surface temperature and that in proximity to the sediment was between 2 and 4°C. During the winter, the temperature was consistent throughout the water column (Fig. 2A). Dissolved oxygen (dO2) ranged from 0 to 490 µmol l–1, with the development of an anoxic layer below 150 cm occurring between 8 May and 8 October 2002 (Fig. 2B). Nitrate was undetectable in Priest Pot throughout the water column between 23 April and 8 October, and increased markedly between 8 October and 19 November (Fig. 2C). Nitrate concentrations then increased to a peak of 865 µg l–1 on 12 February 2003,
before dropping again, and did not vary greatly with depth. The majority of phosphate was detected in the deeper part of the water column (below 200 cm) between 21 May and 8 October (Fig. 2D). Concentrations ranged from 1.3 to 439 µg l–1. Algal chlorophyll a concentrations ranged from 5.2 to 387.5 µg l–1, with a peak at 100 cm on 8 May, and were generally higher in the upper half of the water column (Fig. 2E). Algal chlorophyll a was not detected in the anoxic layer, but was present at very low levels at all depths from October 2002 to February 2003. Bacterial chlorophylls c and d were detected at high levels (up to 650 µg l–1 ) during the late summer and autumn months (between 18 June and 8 October) in the anoxic layer below 150 cm, and only low concentrations (< 7.5 µg l–1) were detected in other parts of the water column (Fig. 2F).
Abundance and succession of bacteria, viruses and phytoplankton Several different groups of bacteria, viruses and phytoplankton were identified in scatter plots of green fluorescence versus side scatter for viruses and bacteria, and red or orange fluorescence versus side scatter for phytoplankton (see Fig. 1). Concentrations of bacteria ranged from 9.46 × 10⁵ to 2.17 × 10⁷ ml–1 (Fig. 3A). Two distinct bacterial groups were observed in the AFC scatter plots (Fig. 1B), thought to represent high and low DNA fluorescence bacteria. Similar bacteria groups have previously been observed by flow cytometry (Gasol et al. 1999). The seasonal distribution of the 2 groups was found to be very similar (data not shown), and it was decided to take the 2 bacterial groups as one community. The bacterial abundance reported here therefore reflects the sum of both bacterial regions. Although patchy, bacterial abundance increased during the spring months (26 March to 21 May) and remained relatively constant during the summer (18 June to 10 October), although concentrations were lower in the surface waters during September and October. Abundance remained consistently low (2 × 10⁶) during the winter months (between 19 November and 17 March). The following spring (17 March to 8 April 2003) bacteria concentrations started to increase again, with little variation over depth. Total virus concentrations (the sum of all 4 virus groups determined from AFC scatter plots shown in Fig. 1A) ranged from 7.06 × 10⁶ to 2.03 × 10⁸ ml–1 (Fig. 3B). During the spring months (26 March to 21 May), temporal variations in virus abundance were observed, but concentrations remained relatively consistent with depth. In contrast, during the summer months (18 June to 8 October), higher concentrations of viruses were observed in the deeper anoxic layers,
Goddard et al.: Freshwater microbial community dynamics
with the highest virus concentrations (2 × 10⁸ ml–1) observed at a depth of 330 cm (near the bottom) on 8 October. At the beginning of the winter months (between 8 October and 19 November) virus concentrations decreased markedly throughout the water column, and remained low until the following spring (17 March
3
Depth (m)
B
1 2 3
Depth (m)
C
1 2 3
Depth (m)
D
1 2
E
Depth (m)
450 400 350 300 250 200 150 100 50 0 –50 950 850 750 650 550 450 350 250 150 50 –50 400 350 300 250 200 150 100 50 0 –50
3
360 320 280 240 200 160 120 80 40 0
1 2 3 F
1 2
2002
8 Apr
17 Mar
28 Jan 12 Feb
17 Dec
19 Nov
8 Oct
10 Sep
16 Jul
13 Aug
18 Jun
3 26 Mar 10 Apr 23 Apr 8 May 21 May
Depth (m)
Temp (°C)
2
dO2 (µmol l–1)
16 14 12 10 8 6 4 2
1
2003), when concentrations began to increase once more. The seasonal distributions of Groups V1, V2 and V3 were similar to that of the total virus community (data not shown). However, Group V4 had a distinct seasonal pattern, with a peak in abundance on 16 July at 100 cm depth (Fig. 3C). The phytoplankton community was differentiated into 8 distinct groups. Six groups were distinguished from scatter plots on the basis of side scatter and orange fluorescence signals by AFC (P1 to P6, Fig. 1C). A further 2 groups were distinguished from scatter plots of red fluorescence and side scatter (P7 and P8, Fig. 1D), which were distinct from those previously identified on the basis of orange fluorescence. Total phytoplankton concentrations ranged from 6.39 × 10² to 5.94 × 10⁵ ml–1. Most of the phytoplankton groups had peaks of abundance that were both spatially and temporally distinct (Fig. 4). For example, Group P2 had a peak of 5 × 10³ ml–1 on 8 May at a depth of 150 cm (Fig. 4B), and Groups P3 and P4 were most abundant on 10 April (3.2 × 10² ml–1) and 16 July (1 × 10³ ml–1), respectively (Fig. 4C,D). Two phytoplankton groups, P1 (Fig. 4A) and P6 (Fig. 4F), had peaks in abundance of 3.6 × 10⁴ and 2.7 × 10² ml–1, respectively, on 8 May at 100 cm depth, at the same time and depth at which the highest algal chlorophyll a levels were recorded. Group P8 was the numerically dominant group detected using these settings, with concentrations reaching 4.5 × 10⁵ on 16 July below 200 cm depth (Fig. 5B). Group P7 was also present in relatively high numbers, with concentrations reaching a peak of 7.5 × 10⁴ ml–1 on 10 September below 300 cm depth, in the anoxic layer (Fig. 5A). Neither Group P7 nor P8 were detected above 200 cm, nor in the spring or winter months. The peaks in abundance of these 2 groups also occurred at the same time as the peaks in bacterial chlorophylls c and d (Fig. 2F), suggesting that they did not comprise phytoplankton, but rather autofluorescent phototrophic bacteria growing anaerobically in the anoxic layer. Phytoplankton counts were measured throughout the winter, but all groups were undetectable during this time.
Bacterial chl c+d (µg l–1) Algal chl a (µg l–1) Phosphate (µg l–1) Nitrate (µg l–1)
Depth (m)
A
650 600 550 500 450 400 350 300 250 200 150 100 50 0
215
2003
Fig. 2. Contour plots showing spatial and temporal variations in Priest Pot of (A) water temperature (°C), (B) dissolved oxygen (dO2) concentration (µmol l–1), (C) nitrate concentration (µg l–1), (D) phosphate concentration (µg l–1), (E) algal chlorophyll a concentration (µg l–1), and (F) bacterial chlorophyll c and d concentration (µg l–1). ×: times and depths of samples taken
Bacteria and eukaryote diversity Spatial and temporal changes in the diversity of prokaryotic and eukaryotic members of the microbial community were monitored by DGGE separation of PCR amplified 16S and 18S rDNA, respectively. Samples were taken from 8 depths on 10 occasions between 26 March 2002 and 8
216
Aquat Microb Ecol 39: 211–223, 2005
–1
17 Mar 8 Apr
28 Jan 12 Feb
17 Dec
2.6 × 10⁷ 2.4 × 1077 2.2 × 10⁷ 2.0 × 10⁷ 1.8 × 10⁷ 1.6 × 10⁷ 1.4 × 10⁷ 1.2 × 10⁷ 1.0 × 10⁶ 8.0 × 10⁶ 6.0 × 10⁶ 4.0 × 10⁶ 2.0 × 10 0.0
19 Nov
8 Oct
10 Sep
13 Aug
16 Jul
18 Jun
tween 26 March and 8 October. Fig. 7 shows the temporal variations in 16S rDNA DGGE profiles at 3.2 m, before, during and after the establish1 ment of the anoxic layer. The profiles obtained from 3.2 m in the samples from 26 March and 10 2 April generated 9 bands each and were very sim3 ilar to each other; however, the profiles from subsequent samples differed markedly from both these and each other. Between 23 March and 8 B Total virus counts (ml–1) October, 3 to 5 bands were observed in each sam2.0 × 1088 1.8 × 10⁸ ple, and few bands were present more than once, 1.6 × 10⁸ 1 1.4 × 10⁸ suggesting a dynamic bacterial community. The 1.2 × 10⁸ 1.0 × 10⁷ lower diversity observed by DGGE in the latter 2 8.0 × 10⁷ 6.0 × 10⁷ part of the annual cycle coincided with the in4.0 × 107 2.0 × 10 3 crease in autofluorescent prokaryotes seen by 0.0 AFC (Fig. 5). A small subsample of 4 bands was C Virus group V4 counts (ml–1) excised from the gel for reamplification and se7 1.3 × 10⁷ 1.2 × 10⁶ quencing, to confirm that they were of bacterial 1.1 × 10⁵ origin (Fig. 7, Bands 1 to 4). The sequences ob9.6 × 105 1 8.4 × 10⁵ tained were compared to the BLAST database to 7.2 × 10⁵ 6.0 × 10⁵ determine the closest matches (Table 1). Band 1, 2 4.8 × 10⁵ 3.6 × 10⁵ detected on 10 April was most similar to an uncul2.4 × 105 1.2 × 10 3 tured Actinobacterium. The sequence data ob0.0 tained for Bands 2 and 3 contained a high number of degeneracies, and were therefore not submitted to GenBank; however, BLAST searches were carried out, and both bands, isolated from 16 July 2003 2002 (that co-occurred with the high numbers of photoFig. 3. Spatial and temporal dynamics of (A) bacteria and (B) virus synthetic bacteria), were both most similar to bactotal communities (ml–1) in Priest Pot over an annual cycle, from teria in the Chlorobium–Pelodictyon group, a 26 March 2002 to 8 April 2003. (C) Spatial and temporal distributions group of anaerobic green sulphur bacteria. Band –1 of virus Group V4 (ml ) during the annual cycle 4 isolated on 10 September was also most similar to a Chlorobium species. Although the overall October 2003, and the DGGE profiles observed. Comnumber of bands was low, there was a relatively high parison of DGGE profiles showed that the structure of background smearing, suggesting high diversity. the bacterial community, reflected by the distribution Changes in the composition of the eukaryotic comof the most abundant strains, changed over both spamunity were observed by DGGE separation of PCR tial and temporal scales. Fig. 6 shows 3 gels from 10 amplified 18S rDNA. The eukaryotic community April, 8 May and 10 September 2002 that are represhowed different DGGE profiles based on both the numsentative of these changes. The number of obvious ber of bands observed and the distance of migration, bands ranged from 3 to 9, with the highest number of throughout the annual cycle. Fig. 8 shows 3 gels that are bands observed in May. In the early part of the year representative of the spatial and temporal variations ob(in March and April), the profiles consisted of 4 bands served by DGGE during the annual cycle. There was litof similar intensity, suggesting that they were all of tle variation in either the number of bands or the band similar abundance. These profiles were consistent profiles with depth on 26 March, 10 April and 23 April throughout the water column. In the sample from 8 (represented by the gel in Fig. 8A), but the intensity of May, DGGE patterns from different depths reflected the most dominant bands did decrease with increasing marked differences between the bacterial community depth (Fig. 8A). From 8 May until 8 October (reprein the top 200 cm of the water column and the bottom sented by the gels in Fig. 8B,C), however, the DGGE pro150 cm, as the anoxic layer became established. The files from different depths reflected substantial differhighest number of bands observed during the annual ences between aerobic and anaerobic assemblages. cycle was seen in the oxic water at this time, and both Profiles from the oxic part of the water column varied band number and intensity decreased with depth. little with depth, but very few 18S rDNA bands were There was also a marked shift in bacterial community detected in the anoxic layer (Fig. 8B,C). Two bands were structure at 3.2 m depth (at the bottom of the lake) beexcised from the gel from the 10 April sample and se26 Mar 10 Apr 23 Apr 8 May 21 May
Depth (m)
Depth (m)
Depth (m)
A Total bacteria counts (ml )
Goddard et al.: Freshwater microbial community dynamics
quenced to confirm they were of 18S rDNA origin. The sequences were compared to the BLAST database and the closest matches determined (Table 1). Band 1 was most similar to a Pterocyctis species (a heliozoan) and Band 2 to Cryptomonas ovata, a microalga.
2 3
Depth (m)
D 1 2 3
Depth (m)
E 1 2 3
Depth (m)
F 1 2 3
17 Dec
1
19 Nov
Depth (m)
C
8 Oct
3
10 Sep
2
13 Aug
1
16 Jul
Depth (m)
B
18 Jun
3
8 May 21 May
2
10 Apr 23 Apr
1
DISCUSSION
The aim of this study was to improve our current understanding of the spatial and temporal dynamics of bacteria, viruses and phytoplankton over an annual cycle in Priest Pot, a small hypereutrophic lake in the English Lake District. Priest Pot has been –1 (Cells ml ) Phytoplankton group P1 extensively characterised in previous studies, and 3.6 × 10⁴ the seasonal changes in physical and chemical 4 3.0 × 10 P1 parameters have been well documented (Finlay & 2.4 × 10⁴ 1.8 × 10⁴ Maberly 2000). Although Priest Pot is a small lake 1.2 × 10⁴ 4 of only 1 ha in area, and 350 cm depth, steep phys6.0 × 10 0.0 ical and chemical gradients develop during the spring and summer, giving rise to a wide range of Phytoplankton group P2 habitats which support a diverse and dynamic 3 4.5 × 10 3.75 × 10³ microbial community. 3.0 × 10³ Analytical flow cytometry (AFC) was used as the 2.25 × 10³ tool of choice to determine concentrations of dif3 1.5 × 10 0.75 × 10³ ferent groups within the whole microbial commu0 nity, from viruses and bacteria, through to phytoplankton. The unique sensitivity of AFC allows it Phytoplankton group P3 to easily discriminate between different groups 300 within these microbial components, using scatter 250 plots of either natural fluorescence (in the case of 200 150 phytoplankton), or an added chemical dye such as 100 SYBR Green I that binds to nucleic acid (in the 50 case of bacteria and viruses) versus side scatter. 0 Particles with similar fluorescence and side scatter Phytoplankton group P4 properties form an individual group on a scatter plot, allowing different groups of microorganisms 900 750 to be distinguished (Chisholm et al. 1986, Marie et 600 al. 1999). This technique allowed us to study the 450 300 community dynamics of phytoplankton, bacteria 150 and viruses in the natural environment, simultane0 ously, something not previously achieved in any Phytoplankton group P5 similar freshwater study. In this study, 4 distinct groups of viruses were ob2800 2400 served by AFC (Fig. 1A). Similar AFC groups were 2000 1600 also observed in samples from the English Channel 1200 (Marie et al. 1999) and in a marine mesocosm 800 400 study, during a study of a bloom of the microalga 0 Emiliania huxleyi, and its termination by viruses (Jacquet et al. 2002). Group V2 was the most abunPhytoplankton group P6 dant, and was thought to comprise bacteriophages. 250 Marie et al. (1999) found that the abundance of a 200 similar group followed that of heterotrophic bacte150 100 ria in a study of virus abundance in the Pacific 50 Ocean, and both Lambda and T7 phages were 0 shown to form distinct groups within this region when cultures were enumerated by AFC (Brussaard et al. 2000). Group V1 had a larger green fluorescence intensity, suggesting the presence of larger particles, with larger genomes, perhaps Fig. 4. Spatial and temporal dynamics of phytoplankton Groups P1 –1 suggesting this group could comprise viruses that to P6 (ml ) in Priest Pot over an annual cycle, from 26 March 2002 to 8 April 2003 infect microalgae. Group V3 was unlike any that
26 Mar
Depth (m)
A
217
Aquat Microb Ecol 39: 211–223, 2005
4.5 × 10⁵ 4.0 × 10⁵ 3.5 × 10⁵ 3.0 × 10⁵ 2.5 × 10⁵ 2.0 × 10⁵ 1.5 × 10⁵ 1.0 × 10⁵ 5.0 × 10⁴ 0.0
1 2
8 Apr
17 Mar
28 Jan 12 Feb
17 Dec
19 Nov
8 Oct
10 Sep
13 Aug
16 Jul
18 Jun
26 Mar 10 Apr 23 Apr 8 May 21 May
3
2003
2002
A
Surface
320
300
250
200
150
100
50
Surface
Fig. 5. Spatial and temporal dynamics of Groups P7 and P8 (ml–1) in Priest Pot over an annual cycle, from 26 March 2002 to 8 April 2003
320
Depth (m)
P8 counts (ml–1)
300
3
250
2
200
1
has been reported previously. The larger side scatter and green fluorescence readings suggest this group could comprise large viruses, or small bacteria, although the group was not removed by filtration through a 0.2 µm filter (data not shown). The distribution of abundance of Groups V1, V2 and V3 over the 2002/2003 annual cycle did not differ greatly from each other, and were very similar to the total virus distribution. No correlation was observed between these groups, or any of the bacteria or phytoplankton groups determined by AFC (data not shown). In contrast, a study by Larsen et al. (2004) reported that virus numbers in an AFC group similar to V2 increased during a bloom of picoeukaryotes in coastal waters off Norway, suggesting that this group was dominated by viruses infecting a major component of the bloom. Although overall abundance of microalgae was high, their diversity was also high, as illustrated by both AFC (Fig. 4) and DGGE analysis of 18S rDNA (Fig. 8). This suggests that the high microalgal diversity could be maintained by continuous infection by viruses, hence virus concentrations remained relatively consistent and high from April to October in the top 250 cm (Fig. 3). Essentially, it may be interpreted that
150
7.50 × 10⁴ 6.75 × 10⁴ 6.00 × 10⁴ 5.25 × 10⁴ 4.50 × 10⁴ 3.75 × 10⁴ 3.00 × 10⁴ 2.25 × 10⁴ 1.50 × 10⁴ 7.50 × 10³ 0.0
100
Depth (m)
P7 counts (ml–1)
50
218
C
B
Fig. 6. PCR-DGGE analysis of the bacterial community (16S rDNA) in Priest Pot at 8 depths (cm) throughout the water column, on 3 sampling occasions: (A) 10 April 2002, (B) 8 May 2002, and (C) 10 September 2002, using the 16S specific primers 8f and 534r (GC)
219
320
300
250
200
150
100
Surface
50
Phytoplankton enumeration was also undertaken by AFC. Groups P7 and P8 were the most abundant determined using these settings (Fig. 5). These groups had relatively high side scatter and red fluorescence readings, and were originally thought to represent the
8 Oct
10 Sep
13 Aug
16 Jul
18 Jun
21 May
8 May
23 Apr
10 Apr
26 Mar
Goddard et al.: Freshwater microbial community dynamics
A
B Fig. 7. PCR-DGGE analysis of the bacteria community (16S rDNA) in Priest Pot, at 330 cm depth, over an annual cycle, from the 26 March to the 8 October 2002, using bacterial 16S specific primers 8f and 534r (GC). Bands excised for sequence analysis are indicated (1 to 4) on the gel (details in Table 1)
virus activity could be responsible for preventing the main phytoplankton groups from reaching intense monospecific blooms. This is consistent with the ‘kill the winner’ hypothesis (Thingstad & Lignell 1997). Similar findings were also observed in a marine mesocosm study (Larsen et al. 2001). The resolution afforded by AFC is, at present, insufficient to determine differences between individual groups of bacteriophage in environmental samples, and although individual cultures of Lambda and T7 phages can be distinguished (Brussaard et al. 2000), the diversity observed in Priest Pot was too high to distinguish all the different groups within the major regions used in this and other studies. Group V4 had a scatter profile typical of those obtained for large algal viruses such as members of the Phycodnaviridae including Chlorella viruses (authors’ unpubl. data). A similar AFC group was observed by Jacquet et al. (2002) in a study of the role of viruses in the termination of a bloom of the coccolithophorid Emiliania huxleyi. In Priest Pot, this group had a peak of abundance on 16 July at a depth of 100 cm, but did not coincide with high numbers of any of the phytoplankton groups determined by AFC.
C
Fig. 8. PCR-DGGE analysis of the eukaryotic phytoplankton community (18S rDNA) in Priest Pot at 8 depths (cm) throughout the water column, on 3 sampling occasions: (A) 10 April 2002, (B) 21 May 2002, and (C) 8 October 2002, using the 18S specific primers 1427f (GC) and 1616r. Bands excised for sequence analysis are indicated (1 and 2) on the gel (details in Table 1)
220
Aquat Microb Ecol 39: 211–223, 2005
Table 1. 16S and 18S DGGE band sequence accession numbers and closest BLAST matches. Bands 1–4 of 16S: see Fig. 7; bands 1–2 of 18S: see Fig. 8 Band
Accession no.
Closest BLAST match
16S Band 1 16S Band 2 16S Band 3 16S Band 4 18S Band 1 18S Band 2
AY81286 Not submitted Not submitted AY81287 AY81288 AY81289
Actinobacterium sp. Chlorobium ferrooxidans Chlorobium ferrooxidans Chlorobium ferrooxidans Pterocyctis sp. Cryptomonas ovata
picoplanktonic cyanobacteria. However, both groups were found to flourish under anaerobic conditions in the stratified water column during the late summer and autumn (Fig. 5), and were therefore thought to comprise anaerobic green sulphur bacteria. Despite the dominance of cyanobacteria in many marine (Liu et al. 2002) and freshwater (Callieri & Stockner 2002) habitats, they were not detected in Priest Pot by AFC at any point during this study. Sequence analysis of a DGGE band whose appearance also coincided with the high Group P7 concentration suggested that a component of the bloom was closely related to Chlorobium ferrooxidans, an obligate anaerobic green sulphur bacterium that grows photoautotrophically using sulphide as the electron donor (Holt et al. 1994). Chlorobium species have previously been found in the anoxic layer of stratified lakes (Casamayor et al. 2000) and another member of the green sulphur bacteria has been observed in Priest Pot, and was tentatively identified as Clathrochloris hypolimnica, on the basis of TEM analysis (Davison & Finlay 1986). The large cell size of Group P7 suggested by AFC scatter plots is in accordance with other studies that have found bacteria in the anoxic hypolimnion to be up to twice the size of those in oxic waters (Cole et al. 1993). Strains within both the Chlorobium and Clathrochloris genera are known to form filaments, which could also explain the relatively high side scatter reading. High bacterial chlorophylls c and d levels recorded at the same time as the peaks in abundance of both Groups P7 and P8 (577 and 643 µg l–1, respectively) indicate that this is an actively growing population (Fig. 2F). The highest virus concentrations detected during this study were also observed in the anoxic layer, at the same time and depth as the P7 peak of abundance, suggesting possible interactions between these 2 groups. Larger bacteria have been shown to be more susceptible to viral infection than smaller ones in a eutrophic lake (Weinbauer & Höfle 1998b), and high virus concentrations, enumerated as the frequency of visibly infected bacterial cells, have previously been reported in the anoxic hypolimnion of the eutrophic Lake Plußsee, Germany, where viruses were shown to
e value
% similarity
Source
e–170 4e– 71 1e– 34 e–153 6e– 71 4e– 44
99 96 96 96 95 94
Urbach et al. (2001) Heising et al. (1999) Heising et al. (1999) Heising et al. (1999) Nikolaev et al. (2004) Deane et al. (2002)
account for up to 94% of bacterial mortality (Weinbauer & Höfle 1998a). In Priest Pot, there was a great deal of variation in bacterial community composition, at 320 cm depth, during and after the establishment of the anoxic layer. Although variation in bacterial community composition in the anoxic hypolimnia of freshwater lakes has been shown to be less marked than in communities from oxygenated parts of the water column (Casamayor et al. 2002), bacterial community composition is known to vary in response to changing environmental parameters. The level of photosynthetically available radiation (PAR) is an important factor in structuring anoxic bacterial communities, with organisms with different light harvesting adaptations proliferating under a range of light conditions (Vila & Abella 2001). Temporal and spatial fluctuations in microbial community composition in response to changes in limnological parameters have also been well documented (Casamayor et al. 2000). Once stratification is established in Priest Pot, data from this and previous studies have shown that physical and chemical parameters remain relatively stable in the anoxic layer (Finlay & Maberly 2000), so it is probable there are other forces driving the dynamic change observed within the bacterial community. The data reported in this study support those by others in suggesting that viruses could play an important role in structuring anoxic bacterial communities. In addition to Groups P7 and P8, 6 distinct phytoplankton groups were determined by AFC analysis during this study (Fig. 1C), and were distinguishable on scatter plots of orange fluorescence versus side scatter. We compared the groups observed in this study with the scatter plots generated by individual cultured strains from the Culture Collection of Algae and Protazoa (CCAP) at the Centre for Ecology and Hydrology, Windermere, UK, in an attempt to determine possible identities for each (data not shown). Group P1 had a similar AFC signature to the diatom Stephanodiscus hantschii. Groups P2 and P3 were most similar to the chrysophytes Synura petersenii and Cryptomonas ovata, respectively. C. ovata was also
Goddard et al.: Freshwater microbial community dynamics
identified from 18S rDNA DGGE profiles (Table 1), suggesting that it is an important component of the phytoplankton community in Priest Pot. Group P5 was most similar to another diatom, Asterionella formosa, and Group P6 was similar to a large cryptomonad Cryptomonas, isolated from Priest Pot. None of the cultured strains tested showed similar scatter plot signatures to Group P4, but the higher side scatter reading suggests it is larger than the chrysophyte C. ovata. AFC has been used previously to monitor the community dynamics of picophytoplankton in estuaries (Li & Dickie 2001, Liu et al. 2004), and many studies of phytoplankton seasonal distribution using AFC have been carried out in oceanic environments, where the eukaryotic phytoplankton have been considered as a single group, and compared with the numerically dominant picoplanktonic cyanobacteria (Campbell et al. 1997, Liu et al. 2002). However, studies of the spatial and temporal distributions of freshwater eukaryotic phytoplankton, determined by AFC, are rare. The phytoplankton community in Priest Pot was shown by AFC to consist of a succession of small-scale blooms, or peaks of abundance of numerically dominant groups throughout the annual cycle. Of the 6 distinct groups observed, only 2 (P1 and P6) occurred at the same time and depth. The peaks of abundance of the remaining 4 groups were either spatially or temporally distinct, although they were all present at lower concentrations throughout the annual cycle. Similar observations have been reported in the estuary of the Swan River in Australia, where the major phytoplankton groups (enumerated by microscopy) were shown to be separated in both space and time (Chan & Hamilton 2001). Four out of the 6 groups observed in Priest Pot had peaks of abundance on 8 May 2002, as the water column made the transition from mixed to stratified. This is in agreement with the findings of Crosbie et al. (2003), who monitored the seasonal and vertical distributions of phytoplankton in an oligomesotrophic alpine lake. These authors identified 2 distinct eukaryotic phytoplankton groups that were responsible for a spring bloom at the end of isothermal mixing phase and the beginning of stratification in the lake. This period is one of dynamic change in the physical and chemical characteristics of the water column, which, combined with increasing solar radiation and temperature, lead to an increase in phytoplankton growth. The resulting succession dynamics of the different phytoplankton groups are clear. Similar findings were reported in a mesocosm study investigating the effect of nutrient addition on phytoplankton succession (Estrada et al. 2003). These authors reported that while the qualitative composition of phytoplankton assemblages remained consistent between replicates, significant variability in the abundance of dominant taxa
221
was observed, suggesting that minute differences in conditions within the different replicates put different selective pressures on the phytoplankton assemblage, causing different patterns of succession within the community. Phytoplankton succession observed by AFC was supported by the DGGE data for which, again, clear succession dynamics were observed in the band patterns (Fig. 8). DGGE also showed far greater diversity within the eukaryotic community than was observed by AFC. On 8 October 2002, high numbers of phytoplankton Groups P1, P2 and P3 were observed by AFC between the surface and 2 m depth (Fig. 4). The DGGE profiles show a similar pattern, with 5 bands present in samples from the surface down to 2 m, below which all but 1 of the bands disappeared, suggesting that these bands may represent the dominant components of AFC Groups P1, P2 and P3. Two distinct groups of bacteria were observed in this study (Fig. 1B), distinguishable by their high and low DNA fluorescence upon staining with SYBR Green I. Similar groups have been observed previously in bacterial populations, and are thought to represent bacteria containing high and low DNA . The high DNA bacteria are considered to represent the active fraction (Vaque et al. 2001), with the dynamics of bacterial production closely related to changes in the abundance of this group. The distribution of the 2 groups in this study was very similar, and is in accordance with data shown by Li & Dickie (2001), who enumerated bacteria from the surface of coastal waters over successive annual cycles and found that the patterns of seasonal abundance were very similar for the 2 groups. Bacterial abundance in Priest Pot was high, with concentrations reaching 2.6 × 10⁷ ml–1. This is higher than epifluorescence microscopic counts of acridine orange stained bacteria from the eutrophic lake Plußsee, where 2.6 × 10⁶ and 2.7 × 10⁶ ml–1 were reported in the upper and lower water column, respectively (Weinbauer & Höfle 1998b). High bacterial biomass is a wellknown characteristic of eutrophic systems. Bacterial production and chlorophyll a measurements were shown to be significantly higher in the eutrophic basin of Lake Erie, Ohio, USA, than in the less productive basins (DeBruyn et al. 2004). This is the first study to investigate the diversity and dynamics of microbial communities from phytoplankton to bacteria and viruses, throughout the water column of a freshwater lake, over an entire annual cycle. The combined approach, using AFC and DGGE gives much more information about the ecology of these groups than either method on its own. We only undertook a limited amount of sequence analysis from the DGGE gels, as the value of these data are in the succession observed in the band profiles over spatial and
Aquat Microb Ecol 39: 211–223, 2005
222
temporal scales, rather than in the identification of all bands. The data presented here suggest close coupling between the virus, bacteria and phytoplankton communities in Priest Pot. The high turnover of phytoplankton could be driving bacterial succession and abundance, which in turn maintains a diverse and abundant bacteriophage community. Priest Pot is a dynamic ecosystem in which a complex array of environmental factors combine to shape a rich and diverse microbial community. Acknowledgements. We thank the staff at CEH Windermere (now Lancaster) for their assistance during fieldwork and for sample collection, and in particular J. E. Parker and Dr. G. H. Hall for help in providing the physicochemical data. Work in this study was funded by the Natural Environment Research Council’s Marine and Freshwater Microbial Biodiversity programme through grant NER/T/s/2000/01365 awarded to W.H.W. and D.G.A., and grant F3/G11/34/01 awarded to S.C.M.
LITERATURE CITED Bergh O, Borsheim KY, Bratbak G, Heldal M (1989) High abundance of viruses found in aquatic environments. Nature 340:467–468 Bettarel Y, Amblard C, Sime-Ngando T, Carrias JF, Sargos D, Garabetian F, Lavandier P (2003a) Viral lysis, flagellate grazing potential, and bacterial production in Lake Pavin. Microb Ecol 45:119–127 Bettarel Y, Sime-Ngando T, Amblard C, Carrias JF, Portelli C (2003b) Virioplankton and microbial communities in aquatic systems: a seasonal study in two lakes of differing trophy. Freshw Biol 48:810–822 Bettarel Y, Sime-Ngando T, Amblard C, Dolan J (2004) Viral activity in two contrasting lake ecosystems. Appl Environ Microbiol 70:2941–2951 Binder BJ, Chisholm SW, Olson RJ, Frankel SL, Worden AZ (1996) Dynamics of picophytoplankton, ultraphytoplankton and bacteria in the central equatorial Pacific. DeepSea ResPart II 43:907–931 Bratbak G, Thingstad F, Heldal M (1994) Viruses and the microbial loop. Microb Ecol 28:209–221 Brussaard CPD (2004) Optimization of procedures for counting viruses by flow cytometry. Appl Environ Microbiol 70: 1506–1513 Brussaard CPD, Marie D, Bratbak G (2000) Flow cytometric detection of viruses. J Virol Methods 85:175–182 Callieri C, Stockner JG (2002) Freshwater autotrophic picoplankton: a review. J Limnol 61:1–14 Campbell L, Liu HB, Nolla HA, Vaulot D (1997) Annual variability of phytoplankton and bacteria in the subtropical North Pacific Ocean at Station ALOHA during the 1991–1994 ENSO event. Deep-Sea Res I 44:167–192 Caraco N, Puccoon AH (1986) The measurement of bacterial chlorophyll and algal chlorophyll a in natural water. Limnol Oceanogr 31:889–893 Casamayor EO, Schafer H, Baneras L, Pedros-Alio C, Muyzer G (2000) Identification of and spatio-temporal differences between microbial assemblages from two neighboring sulfurous lakes: comparison by microscopy and denaturing gradient gel electrophoresis. Appl Environ Microbiol 66:499–508
Casamayor EO, Pedros-Alio C, Muyzer G, Amann R (2002) Microheterogeneity in 16S ribosomal DNA-defined bacterial populations from a stratified planktonic environment is related to temporal changes and to ecological adaptations. Appl Environ Microbiol 68:1706–1714 Chan TU, Hamilton P (2001) Effect of freshwater flow on the succession and biomass of phytoplankton in a seasonal estuary. Mar Freshw Res 52:869–884 Chisholm SW, Armbrust EV, Olson RJ (1986) The individual cell in phytoplankton ecology: cell cycles and applications of flow cytometry. In: Platt T, Li WKW (eds) Photosynthetic picoplankton. Can Bull Fish Aquat Sci, Ottawa, p 343–369 Cole JJ, Pace ML, Caraco NF, Steinhart GS (1993) Bacterial biomass and cell-size distributions in lakes — more and larger cells in anoxic waters. Limnol Oceanogr 38: 1627–1632 Crosbie ND, Teubner K, Weisse T (2003) Flow-cytometric mapping provides novel insights into the seasonal and vertical distributions of freshwater autotrophic picoplankton. Aquat Microb Ecol 33:53–66 Davison W, Finlay BJ (1986) Ferrous iron and phototrophy as alternative sinks for sulfide in the anoxic hypolimnia of 2 adjacent lakes. J Ecol 74:663–673 Deane JA, Strachan IM, Saunders GW, Hill DRA, McFadden GI (2002) Cryptomonad evolution: nuclear 18S rDNA phylogeny versus cell morphology and pigmentation. J Phycol 38:1236–1244 DeBruyn JM, Leigh-Bell JA, McKay RML, Bourbonniere RA, Wilheim SW (2004) Microbial distributions and the impact of phosphorus on bacterial activity in Lake Erie. J Great Lakes Res 30:166–183 Estrada M, Berdalet E, Vila M, Marrase C (2003) Effects of pulsed nutrient enrichment on enclosed phytoplankton: ecophysiological and successional responses. Aquat Microb Ecol 32:61–71 Finlay B, Maberly S (2000) Microbial diversity in Priest Pot: a productive pond in the English Lake District. Freshwater Biological Association, Ambleside Fischer UR, Velimirov B (2002) High control of bacterial production by viruses in a eutrophic oxbow lake. Aquat Microb Ecol 27:1–12 Gasol JM, Zweifel UL, Peters F, Fuhrman JA, Hagström Å (1999) Significance of size and nucleic acid content heterogeneity as measured by flow cytometry in natural planktonic bacteria. Appl Environ Microbiol 65: 4475–4483 Goddard VJ, Bailey MJ, Darrah P, Lilley AK, Thompson IP (2001) Monitoring temporal and spatial variation in rhizosphere bacterial population diversity: a community approach for the improved selection of rhizosphere competent bacteria. Plant Soil 232:181–193 Heaney SI (1974) A pneumatically operated water sampler for close intervals of depths. Freshw Biol 4:103–106 Heising S, Richter L, Ludwig W, Schink B (1999) Chlorobium ferrooxidans sp. nov., a phototrophic green sulfur bacterium that oxidizes ferrous iron in coculture with a ‘Geospirillum’ sp. strain. Arch Microbiol 172:116–124 Hennes KP, Simon M (1995) Significance of bacteriophages for controlling bacterioplankton growth in a mesotrophic lake. Appl Environ Microbiol 61:333–340 Holt JG, Krieg NR, Sneath PHA, Staley JT, Williams ST (1994) Bergey’s manual of determinative bacteriology. Williams & Wilkins, Baltimore, MA Jacquet S, Heldal M, Iglesias-Rodriguez D, Larsen A, Wilson W, Bratbak G (2002) Flow cytometric analysis of an Emiliana huxleyi bloom terminated by viral infection. Aquat Microb Ecol 27:111–124
Goddard et al.: Freshwater microbial community dynamics
223
Larsen A, Castberg T, Sandaa RA, Brussaard CPD and 6 others (2001) Population dynamics and diversity of phytoplankton, bacteria and viruses in a seawater enclosure. Mar Ecol Prog Ser 221:47–57 Larsen A, Flaten GAF, Sandaa RA, Castberg T, Thyrhaug R, Erga SR, Jacquet S, Bratbak G (2004) Spring phytoplankton bloom dynamics in Norwegian coastal waters: microbial community succession and diversity. Limnol Oceanogr 49:180–190 Li WKW, Dickie PM (2001) Monitoring phytoplankton, bacterioplankton, and virioplankton in a coastal inlet (Bedford Basin) by flow cytometry. Cytometry 44:236–246 Liu HB, Suzukil K, Minami C, Saino T, Watanabe M (2002) Picoplankton community structure in the subarctic Pacific Ocean and the Bering Sea during summer 1999. Mar Ecol Prog Ser 237:1–14 Liu HB, Dagg M, Campbell L, Urban-Rich J (2004) Picophytoplankton and bacterioplankton in the Mississippi River plume and its adjacent waters. Estuaries 27:147–156 Mackereth FGH, Heron J, Talling JF (1978) Water analysis: some revised methods for limnologists, Vol 36. Titus Wilson & Son, Kendal Maranger R, Bird DF (1995) Viral abundance in aquatic systems — a comparison between marine and fresh-waters. Mar Ecol Prog Ser 121:217–226 Marie D, Brussaard CPD, Thyrhaug R, Bratbak G, Vaulot D (1999) Enumeration of marine viruses in culture and natural samples by flow cytometry. Appl Environ Microbiol 65:45–52 Mathias CB, Kirschner AKT, Velimirov B (1995) Seasonalvariations of virus abundance and viral control of the bacterial production in a backwater system of the Danube River. Appl Environ Microbiol 61:3734–3740 Muyzer G, Dewaal EC, Uitterlinden AG (1993) Profiling of complex microbial-populations by denaturing gradient gel-electrophoresis analysis of polymerase chain reactionamplified genes-coding for 16S ribosomal-RNA. Appl Environ Microbiology 59:695–700 Nikolaev SI, Berney C, Fahrni JF, Bolivar I and 5 others (2004) The twilight of Heliozoa and rise of Rhizaria, an emerging supergroup of amoeboid eukaryotes. Proc Natl Acad Sci
USA 101:8066–8071 Olson RJ, Vaulot D, Chisholm SW (1985) Marine-phytoplankton distributions measured using shipboard flowcytometry. Deep-Sea Res I 32:1273–1280 Ovreas L, Bourne D, Sandaa RA, Casamayor EO and 5 others (2003) Response of bacterial and viral communities to nutrient manipulations in seawater mesocosms. Aquat Microb Ecol 31:109–121 Thingstad F, Lignell R (1997) Theoretical models for the control of bacterial growth rate, abundance, diversity and carbon demand. Aquat Microb Ecol 13:19–27 Urbach E, Vergin KL, Young L, Morse A, Larson GL, Giovannoni SJ (2001) Unusual bacterioplankton community structure in ultra-oligotrophic Crater Lake. Limnol Oceanography 46:557–572 van Hannen EJ, van Agterveld MP, Gons HJ, Laanbroek HJ (1998) Revealing genetic diversity of eukaryotic microorganisms in aquatic environments by denaturing gradient gel electrophoresis. J Phycol 34:206–213 Vaque D, Casamayor EO, Gasol JM (2001) Dynamics of whole community bacterial production and grazing losses in seawater incubations as related to the changes in the proportions of bacteria with different DNA content. Aquat Microb Ecol 25:163–177 Vila X, Abella CA (2001) Light-harvesting adaptations of planktonic phototrophic micro- organisms to different light quality conditions. Hydrobiologia 452:15–30 Weinbauer MG (2004) Ecology of prokaryotic viruses. FEMS Microbiol Rev 28:127–181 Weinbauer MG, Höfle MG (1998a) Significance of viral lysis and flagellate grazing as factors controlling bacterioplankton production in a eutrophic lake. Appl Environ Microbiol 64:431–438 Weinbauer MG, Höfle MG (1998b) Size-specific mortality of lake bacterioplankton by natural virus communities. Aquat Microb Ecol 15:103–113 Weisburg WG, Barns SM, Pelletier DA, Lane DJ (1991) 16s ribosomal DNA amplification for phylogenetic study. J Bacteriol 173:697–703 Wommack KE, Colwell RR (2000) Virioplankton: viruses in aquatic ecosystems. Microbiol Molec Biol Rev 64:69–114
Editorial responsibility: Gunnar Bratbak, Bergen, Norway
Submitted: December 13, 2004; Accepted: March 31, 2005 Proofs received from author(s): June 1, 2005