Temporal dynamics of the geographic differentiation of Late Devonian Palmatolepis assemblages in the Prototethys CATHERINE GIRARD, TA HOA PHUONG, NORMAN SAVAGE, and SABRINA RENAUD Girard, C., Ta, H.P., Savage, N., and Renaud, S. 2010. Temporal dynamics of the geographic differentiation of Late De− vonian Palmatolepis assemblages in the Prototethys. Acta Palaeontologica Polonica 55 (4): 675–687. Throughout their history, species had to face environmental variations spatially and temporally. How both levels of varia− tion interact will be of key importance in conditioning their response to major perturbations. We addressed this question by focusing on a period in Earth’s history marked by dramatic environmental and faunal changes, the Late Devonian Frasnian/Famennian boundary. From a paleogeographic point of view, this period is characterized by a cosmopolitanism of the faunas across a large ocean, the Prototethys. We considered the biotic reaction at a seldom considered scale, namely within a single subgenus of conodont, Palmatolepis (Manticolepis). Patterns of spatial and temporal differentiation were quantified using morphometrics of its platform element. The recognized cosmopolitanism of the faunas was confirmed at this scale of variation since temporal records gathered in distant areas around the Prototethys, including the seldom docu− mented regions located nowadays in South−East Asia, displayed similar morphological trends in response to the major F/F crisis. Beyond this overall cosmopolitanism, subtle geographic structure was evidenced but was not stable through time. Geographic differentiation was maximal shortly before the F/F crisis, suggesting that despite high sea−level, tecton− ics leaded to complex submarine landscapes promoting differentiation. In contrast any geographic structure was swamped out after the crisis, possibly due to a global recolonization from few favorable patches. Key words: Conodonta, mass extinction, morphometrics, geographic differentiation, Frasnian/Famennian, Prototethys. Catherine Girard [Catherine.Girard@univ−montp2.fr], Université Montpellier 2 – CNRS: UMR 5554, Institut des Sci− ences de l‘Evolution, C.C. 64, Place Eugène Bataillon, 34095 Montpellier Cedex, France; Ta Hoa Phuong [
[email protected]], Hanoi University of Science, Faculty of Geology, N°334 Nguyen Trai, Thanh Xuan, Ha Noi, Vietnam; Norman Savage [
[email protected]], Department of Geology, University of Oregon, Eugene, OR 97403, USA; Sabrina Renaud [Sabrina.Renaud@univ−lyon1.fr], Université Lyon 1 – CNRS: UMR 5125, PEPS, Batiment Géode, Campus de la Doua, 69622 Villeurbanne, France. Received 7 October 2009, accepted 10 June 2010, available online 14 June 2010.
Introduction Throughout their history, species had to face and adapt to en− vironmental variations at different scales, both spatially and temporally. Spatial variations in environmental conditions, as various as temperature, salinity, nutrient availability and productivity for the prominent factors in the marine realm, moulded the distribution area of the species depending on their preferences (e.g., Caron et al. 1987; Gaylord and Gaines 2000; Schmidt et al. 2004). These preferences condition the reactions to environmental perturbations (e.g., Schmidt et al. 2003) but these preferences can themselves evolve through time, leading to complex evolutionary patterns through time and space (Renaud and Schmidt 2003). Depending on the relative amplitude of both scales of variations, the response to peculiar local conditions may override variations due to global environmental changes (Stenseth et al. 2003). Hence, complex scenarii including together large−scale climatic Acta Palaeontol. Pol. 55 (4): 675–687, 2010
trends, fluctuations in the local habitats, as well as ecological and physiological data may be necessary to decipher the dis− tribution of some current species including marine organisms such as fishes (Buisson and Grenouillet 2009). In turn, the spatial structure of the environmental condi− tions may vary through time, leading to alternations of phases characterized by enhanced geographical exchanges or restricted conditions and endemism. How these spatial variations interact with temporal changes is critical for un− derstanding the evolutionary dynamics of species, including how they have faced past environmental crises and how they will face the ongoing climate change. The Earth’s history has been marked by several major cri− ses that offer the opportunity to address the interaction of geo− graphic and temporal environmental variations. Among them, the Late Devonian period is known to have experienced a drastic turn−over in the faunas, culminating at the Frasnian/ Famennian (F/F) boundary. Traditionally considered as one of doi:10.4202/app.2009.0098
676
ACTA PALAEONTOLOGICA POLONICA 55 (4), 2010
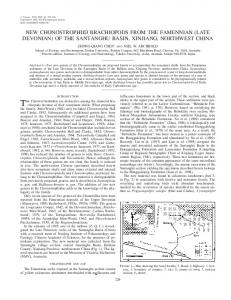
Fig. 1. Palaeogeographic map of the Late Devonian showing the location of the sections considered in the present study (after Scotese and McKerrow 1990; Scotese and Golonka 1992). Circle = Coumiac Upper Quarry (France), square = Mrirt (Morocco), triangle = Xom Nha (Vietnam), diamond = Thong Pha Phum (Thailand).
the “Big Five” mass extinctions, with the disappearance of 70% of all species and 50% of all genera (Raup and Sepkoski 1982), the processes underlying this indubitable loss in bio− diversity are today debated. A deficit in speciation may be in− volved rather than high extinction rates (Bambach et al. 2004; Racki 2005; Alroy 2008). Drastic environmental changes seem anyway to have triggered this biotic turn−over (i.e., Algeo et al. 1998; Joachimski and Buggisch 2002). During this Late Devonian period, most of the continental land masses were assembled in two main continents, Gond− wana and Laurussia (Scotese and McKerrow 1990) that bor− dered a large Prototethys ocean. How oceanic circulation was organized in this past ocean and the vast epicontinental seas of the shelves is still unknown. However, the homoge− neity of the composition of the faunas around the Prototethys suggests that the Late Devonian was a period of cosmopoli− tanism for marine species (McGhee 1996; Cooper 1998; Rode and Lieberman 2004, 2005; McNamara et al. 2009). Among the genera surviving the crisis, and hence allow− ing an investigation of how the environmental perturbations affected its geographic structuration, we focused on the conodont genus Palmatolepis. Previous studies showed that its evolutionary response to the F/F crisis was adequately de− scribed by the morphometric variations of its platform ele− ment outline (e.g., Girard and Renaud 2007). A subtle geo−
graphic structure was also evidenced for this genus shortly before the F/F boundary (Girard et al. 2007) despite evi− dences of an overall cosmopolitanism of Late Devonian conodont fauna (Klapper 1995). To investigate how this geographic structure articulates and interacts with the dramatic changes observed through the Late Devonian period, we applied the same morphometric analysis to Palmatolepis conodonts documenting the temporal variations through the late Frasnian and early Famennian in four outcrops, characterizing the two contrasted areas of the Western and Eastern Prototethys. The western zone was sam− pled at the stratotype section of Coumiac (France) and in Mrirt (Morocco). Abundant literature has been devoted to the cono− dont systematics and stratigraphy of these sections (Becker et al. 1989; Klapper 1989; Klapper et al. 1993; Lazreq 1992; 1999; Girard and Renaud 2007) in contrast with the poorly documented eastern sections of Xom Nha (Vietnam) (Ta 1998; Luu et al. 2007) and Thong Pha Phum (Thailand) (Sav− age et al. 2006). Together with a comprehensive analysis throughout the four sections, we further focused on the geographic differen− tiation in three successive time−slices: the period shortly pre− ceding the F/F boundary, and two further time−slices bracket− ing the crisis: one in the preceding zone and one in the fol− lowing zone.
GIRARD ET AL.—GEOGRAPHIC DIFFERENTIATION OF DEVONIAN CONODONT
677
Thong Pha Phum (Thailand)
Zone 13b-c
MN Zone 13a
upper Palmatolepis rhenana
FAMENNIAN FRASNIAN
Pa. linguiformis Palmatolepis triangularis
TPP40
32c 32b 32a 31g 31f 31c
30a
Coumiac
Mrirt
Xom Nha
(France)
(Morocco)
(Vietnam)
UKW
M15 M14 M13 M12 M11b M11a M9 M8 M7
XN55 XN54 3
XN53 2
UKW
XN53-1 XN52-1 XN51-1
1m
29b
limestones Kellwasser limestones
28c
TPP31
grey limestones
27 0
position of conodont samples
TPP30
Fig. 2. Stratigraphical logs of the four compared sections, Coumiac (France), Mrirt (Morocco), Xom Nha (Vietnam) and Thong Pha Phum (Thailand). The studied levels are marked by a black circle. In gray, the dysoxic Kellwasser (UKW = Upper Kellwasser). Pa., Palmatolepis.
Abbreviations.—CUQ, Coumiac Upper Quarry; FC, Fourier Coefficient; F/F, Frasnian/Famennian; KW, Kruskal Wallis; M, Mrirt section; MM, Moroccan Meseta; MN, Montagne Noire; Pa., Palmatolepis; PC, principal component; PCA, principal component analysis; RFT, radial Fourier trans− form; sf, size−free; TPP, Thong Pha Phum; UKW, Upper Kellwasser; XN, Xom Nha.
Material and age of samples Successive levels documenting the period of the latest Frasnian and the earliest Famennian throughout the four sections were sampled and compared. The first two sections are located on the Western part of the Prototethys (Fig. 1). Coumiac Upper Quarry (CUQ) is the stratotype section for the Frasnian/ Famennian boundary (Klapper et al. 1993). The second site considered is the Mrirt section (M), located in the Moroccan Meseta (Fig. 1). 11 levels in Coumiac and 9 levels in Mrirt have been considered across the F/F (data from Girard and Renaud 2007). For these two sections, the F/F boundary coincides with the top of a black organic−rich level, recording anoxic condi− tions and called the Upper Kellwasser event (Fig. 2). Two sections have been investigated for the eastern part of the Prototethys, both belonging to the Indochina block: the section Xom Nha (central Vietnam) and Thong Pha Phum (Western Thailand) (Fig. 1). Seven levels in Xom Nha and three levels in Thong Pha Phum have been considered across the F/F boundary. These sections display continuous carbon−
ated succession, without lithological evidence of the pres− ence of the Kellwasser event (Fig. 2). However, a d13C posi− tive excursion has been documented in the Thong Pha Phum section just above the bed TPP 37. This excursion has been tentatively correlated with a similar excursion already ob− served in Europe, North America (Joachimski et al. 2009) and China (Chen et al. 2002), just before the Frasnian/ Famennian boundary, and interpreted as the signal of the Up− per Kellwasser event (Savage et al. 2006). For each stratigraphic level, a piece of 100 to 200g rock was dissolved in formic acid (10%) and rinsed through two sieves. The samples are immersed in formic acid less than 24h to avoid corrosion of the conodont elements. Empirically the abundant occurrence of gracile elements validates the use of unbuffered acid for this step. All intact Palmatolepis (Manticolepis) platform elements were picked for subse− quent morphometric analyses (Table 1). In all sections, the detailed stratigraphic framework was established based on the determination of the conodont fauna; this tentative framework was subsequently compared with patterns emerging from the morphometric analyses. Tradi− tional stratigraphic correlations (Fig. 2) have been used based on the Late Devonian conodont zonation (Ziegler and Sand− berg 1990) and compared to MN conodont zones (Klapper 1989) established in the Montagne Noire (France) but now recognized as being of worldwide significance (Girard et al. 2005). In the Coumiac section, determination of conodonts showed that beds CUQ27−31c at the base of the section belong to the late Palmatolepis rhenana Zone or MN 13a Zone, and doi:10.4202/app.2009.0098
678
ACTA PALAEONTOLOGICA POLONICA 55 (4), 2010
Table 1. Number of Palmatolepis (Manticolepis) elements measured for morphometric analysis in successive beds in Coumiac (France) and Mrirt (Morocco) for the Western part of Prototethys and in beds in Xom Nha (Vietnam) and Thong Pha Phum (Thailand) for the East part of the Prototethys. In grey: the three time−slices considered in this study. Abbreviations: CUQ, Coumiac Upper Quarry; M, Mrirt; PaM, number of entire Palmatolepis (Manticolepis) elements measured for morphometrics; TPP, Thong Pha Phum; XN, Xom Nha.
Stages
Famennian
Conodont zones
Palmatolepis triangularis
Palmatolepis linguiformis
MN13b−c
Frasnian late Palmatolepis rhenana
MN13a
Western Prototethys Mrirt Samples PaM M15 CUQ32c 45 M14 CUQ32b 45 M13 CUQ32a 51 M12 CUQ31g2 58 M11b CUQ31g1 68 M11a CUQ31f 94 M9 CUQ31c 481 CUQ30a 469 CUQ29b 350 M8 CUQ28c 263 CUQ27t 170 M7 Coumiac Samples
beds CUQ31f–31g to the Palmatolepis linguiformis Zone, corresponding to the MN 13b–c zones. The characteristic form of the zone, Pa. linguiformis, is, however, very seldom found in this section (less than 0.5%). Beds 32a–b–c were at− tributed to the Palmatolepis triangularis Zone. In the Moroc− can section of Mrirt, the beds M7–8 are dated of late Pa. rhenana Zone (MN 13a Zone), and beds M9–11 to the Pa. linguiformis Zone (MN13b–c zones). The base of the Famen− nian is represented by the beds M12–15 which are attributed to the Palmatolepis triangularis Zone. For the Thai section of Thong Pha Phum, conodonts from three levels (TPP 30−31−40) have been considered. Beds TPP 30−31 are of Late Pa. rhenana Zone age (MN 13a Zone), and Bed TPP 40 yielded numerous Pa. triangularis indicating the Pa. triangularis Zone (Savage et al. 2006). Seven levels have been studied for the Xom Nha section. Bed 51 contains conodonts belonging to the Upper Palmato− lepis rhenana Zone (MN 13a Zone). In beds 52 and 53−1 the index species of the Pa. linguiformis Zone occurs. It repre− sents approximately 10% of the total assemblage. Beds 53−2 to 55 can be attributed to the Pa. triangularis Zone (Ta 1998). This stratigraphic correlation between the different levels of the sections is presented in the Fig. 2 and the Table 1.
Methods Morphometrics of Palmatolepis conodonts according to a generic approach The traditionally used taxonomy of Late Devonian cono− donts largely relies on a parataxonomic approach based on a single platform element (Pa or P1) taken as a marker of the evolution of the whole animal in a synecdoche that is fre−
PaM 98 42 133 6 25 13 52
74
Xom Nha Samples XN55 XN54 XN53−3 XN53−2 XN53−1 XN52−1
XN51−1
Eastern Prototethys TPP PaM Samples 3 34 TPP40 7 3
PaM 38
302 140
23
TPP31
22
TPP30
83
81
quent in paleontological studies (e.g., most interpretations of small mammal assemblages only rely on teeth remains, see for instance Michaux 1971). Multielement analyses are chal− lenging issues (Dzik 2002) but still encounter several limita− tions for an extensive application to large scale studies. The reconstruction of a multi−element apparatus relies either on seldom found remains of in situ conodont apparatuses, or on assignation of elements to an apparatus of a given species based on similar frequencies in the assemblage. This ap− proach suffers the drawback that various elements of a single apparatus may have different potential of sedimentation and preservation, that may lead to taphonomic biases hindering confident reconstructions of apparatuses (von Bitter and Pur− nell 2005). Hence, the taxonomy of the genus Palmatolepis has been established according to the current parataxonomic approach and accordingly, we based our morphometric anal− ysis on the platform element. The large morphological variation within this genus and particularly during the Late Devonian was traditionally tack− led by splitting it into many species and subspecies. The va− lidity of these entities for stratigraphic purposes is indubita− ble and in agreement, we relied on this approach to establish our tentative stratigraphic framework. Some drawbacks emerge, however, when attempting to tackle evolutionary issues. The lack of well−defined clusters has been recognized by many authors, mentioning transi− tional forms between species (e.g., Ziegler and Sandberg 1990) and leaving generally more than 80% of the specimens in an open nomenclature (e.g., Sandberg et al. 1988; Schülke 1998; Morrow 2000). Furthermore the fuzzy limits between described species led to the proposition of two parallel taxon− omies, partially but not fully overlapping (Klapper 1989; Ziegler and Sandberg 1990). Since most characteristics features of Palmatolepis plat− form elements regard the shape of its platform, morpho−
GIRARD ET AL.—GEOGRAPHIC DIFFERENTIATION OF DEVONIAN CONODONT
metric analyses brought additional light on how to tackle the abundant morphological variability. (i) The separate analysis of the different recognized species showed that they shared similar temporal trends, instead of being stable over time (Renaud and Girard 1999). (ii) When considering together the wealth of undetermined specimens, identified specimens appeared as end−members of a continuous morphological variation showing coherent trends through time (Girard et al. 2004). (iii) Considering all Palmatolepis elements together independently of any a priori identification allows the recog− nition of clear−cut morphological clusters whenever they oc− cur: a study focused on the Latest Devonian period clearly evidenced two distinct groups of Palmatolepis (Girard et al. 2007). Subtle geographic variations within the most abun− dant group were further evidenced using the “generic” ap− proach consisting in pooling all Palmatolepis elements into a single entity corresponding to a continuous morphological variation. We hence adopted this approach in the present study for analysing the temporal and spatial morphological variation of the conodont Palmatolepis. This approach is only challenged during the Latest Fras− nian (Palmatolepis linguiformis Zone) when as mentioned, two distinct groups coexist. They correspond to two subgen− era: (1) Palmatolepis (Palmatolepis), including Pa. (Pa.) lin− guiformis, the index species of the zone; (2) Palmatolepis (Manticolepis) which includes all other specimens (Girard et al. 2007). Because of the transient occurrence Pa. (Palmato− lepis) that only exists during the Latest Devonian, and of its rarity even during this time interval, we focused the subse− quent morphometric analyses on Pa. (Manticolepis) only, being considered as a single evolutionary unit.
Fourier analysis The morphometric analysis was focused on Palmatolepis plat− form elements (Fig. 3), which have already shown clear mor− phological responses to the Frasnian/Famennian global envi− ronmental perturbation in the Western Prototethys (Renaud and Girard 1999; Girard and Renaud 2007) and a geographic differentiation in the Palmatolepis linguiformis (late Frasnian) time slice (Girard et al. 2007). All the intact Palmatolepis plat− form elements of a level were considered. Conodonts having a bilateral symmetry, both right and left elements are found in an assemblage. Left elements were subjected to a mirror transformation and measured as right elements. The two−dimensional outline of each conodont was automatically digitized using an image analyzer (Opti− mas), using the same magnification for all elements irrespec− tive of their size. For each conodont, x− and y−coordinates of 64 points were sampled at equally spaced intervals along the outline. The starting point was defined at the dorsal (or ante− rior) tip of the platform. A radial Fourier transform (RFT) was applied to this data set. From the x, y coordinates of the 64 points, radii corresponding to the distance of each point to the centre of gravity of the outline were calculated. A Fourier transform was then applied to this set of 64 radii. The outline
679
is thus expressed as a finite sum of trigonometric functions of decreasing wavelength (harmonics), weighted by two Fou− rier Coefficients An and Bn (Renaud and Girard 1999). The zero harmonic, A0, is proportional to the size of each cono− dont and was used to standardize all the Fourier coefficients, in order to retain shape information only. Eleven harmonics were retained, considered as a good compromise between in− formation content and number of variables.
Statistics Conodont size.—The size of each conodont element was es− timated using the zero harmonic (A0) based on the analysis of its outline. This size estimator was chosen because directly related to the shape analysis and because it is highly related to other, more intuitive size estimators (as an example, A0 was compared in the level CUQ32c to a range of size estima− tors using linear regression and was highly correlated to all of them: Area: R2 = 0.974; Area: R2 = 0.995; Perimeter: R2 = 0.981; Maximum Length: R2 = 0.986; Maximum Breadth: R2 = 0.964). For the three time−slices differences in size between sam− ples as well as size differences between the sections and be− tween the Eastern part and Western parts of the Prototethys were investigated using analyses of variance (ANOVA). Given the non−normal distribution of conodont size, the anal− yses were completed by Kruskal Wallis (KW) tests. This is a non−parametric analog of a one−way analysis of variance which tests for differences in the center of the distribution of the groups. Differences in distribution of conodont size may further be related to differences in variance instead of differ− ences in mean values. Hence, a comparison of variance was performed using a Levene’s test that tests for the equality of variance in different samples. Conodont shape.—The shape of each conodont element was described by a set of 22 Fourier Coefficients (FCs), cor−
Fig. 3. Upper view of a Palmatolepis (Manticolepis) element.
doi:10.4202/app.2009.0098
680
Size−shape relationship and size−free shape estimates.— Despite their standardization by the zeroth harmonic, the Fourier coefficients may still include size−related, allometric shape variation. Although less obvious than in other genera like Ancyrodella (Girard and Renaud 2008), a significant component of allometric variation has been evidenced in Palmatolepis (Manticolepis) conodonts of the Latest Devo− nian (Girard et al. 2007). The existence of such a relationship between size and shape of the conodonts was first investi− gated in our data set using a linear regression between A0, considered as size estimator, and the first axis of the principal component analysis, considered as a synthetic shape axis. This provides a first insight into the relationship between size and shape, and a visualisation of this relationship. This method provides a straightforward visualization, shape being summarized along a synthetic axis. This is, how− ever, a simplification of the multivariate data set. Hence, this approach was complemented by a multiple regression of one variable (the size of the conodont element estimated by the first Fourier Coefficient A0) upon all other Fourier Coeffi− cients (FCs), that consider the relationship of a pool of de− pendent variables (here the FCs) with another independent variable (here the size of the conodonts). This approach pro− vides “size−free” shape variables that appeared efficient in dis−
2.5 France
Vietnam
Morocco
Thailand
Second shape axis (PC2, 17.4%)
2 XN54
FAMENNIAN
1.5 C32c XN53-3 XN51-1
32b
1
XN53-2 C32a
M13 M14
0.5
XN55
M12
C31g2 C31g1
TPP40
M9
M11b M15
0
28c
M7 C27t
C31f
29b
C30a M11a
TPP31
TPP30
XN53-1
C31c M8
-0.5
XN52-1
FRASNIAN
-1 -2
-1.5
-0.5
-1
0.5
0
1
1.5
First shape axis (PC1, 25.8%) 2.4
2.2
XN51-1
FAMENNIAN 2
XN54 TPP31
XN53-3
Size (A0)
responding to 2 FCs per 11 harmonics. These FCs have been standardized by size, estimated by A0, and retain shape infor− mation only. A principal component analysis (PCA) was first per− formed on the data set corresponding to the 22 FCs of the conodonts in all sections and levels, in order to display the to− tal morphological variance on a few synthetic axes without any a priori hypotheses. This allowed a visualization of the differentiation pattern through time and space and of the global relationship with size. The PCA was performed on the correlation matrix in order to balance the weight given to the different FCs. This procedure tends to give a similar impor− tance to local and global shape differences. Patterns of shape differentiation were thereafter tested us− ing multivariate analyses of variance (MANOVA). Differ− ences were investigated among levels for each section, and among sections for each of the three time−slices, as well as geographic differences between the Eastern and Western part of the Prototethys, and between sections within a given geographic area. A limit in the interpretation of MANOVA results is its sensitivity to sample size: the more specimens, the higher the chance of detecting significant differences among groups (Michaux et al. 2007). Within each time−slice, we further investigated the distri− bution of the morphotypes following the procedure devel− oped for size analysis, the first axis of a PCA per time−slice being considered as synthetic shape axis. Differences in shape between the Eastern and Western part of the Proto− tethys, and between sections within each area, were tested by an ANOVA on the scores on PC1 axis, completed by Kruskal Wallis and Levene’s tests .
ACTA PALAEONTOLOGICA POLONICA 55 (4), 2010
1.8
C31g2 C32c
XN53-2
XN53-1
XN52-1 C31g1 TPP30
1.6
C31f M11a
C29b M15 C32a
1.4
TPP40 M12
1.2
M9 M14
C31c
M7
M13
C32b
C30a
M11b C28c
C27t M8
FRASNIAN
XN55
1 -2
-1.5
-1
-0.5
0
0.5
1
1.5
First shape axis (PC1)
Fig. 4. Geographical and temporal variations between levels/localities based on the shape analysis of Palmatolepis elements. A. Morphological space defined by the first two axes of the principal component analysis (PC1, 25.8% and PC2, 17.2%) which explain almost half of the total variance. B. Relationship between average size and shape values in all considered levels. Size is estimated by A0, shape by scores on PC1. The symbols repre− sent the average value per level; error bars correspond to the 95% confi− dence interval. Open symbols: Frasnian; grey and black symbols: Famen− nian; circles = Coumiac, squares = Mrirt, triangles = Xom Nha, diamonds = Thong Pha Phum.
entangling sources of shape variations related to allometric growth from those related to environmental fluctuations in the conodont Ancyrodella (Girard and Renaud 2008).
GIRARD ET AL.—GEOGRAPHIC DIFFERENTIATION OF DEVONIAN CONODONT
681
Table 2. Tests for size and shape differences for the three time−slices. Size is estimated by the zeroth harmonic (A0) derived from the outline analysis. Shape estimators are the first axes of a principal component analysis either on raw shape variables (Fourier coefficients, FCs) (PC1) or on size−free shape variables (residuals after regression of the FCs vs size) (PC1sf). Size and shape differences in mean values were tested by analyses of variance (ANOVA) completed by Kruskal Wallis tests, and differences in variance were tested using Levene’s tests. Abbreviations: CUQ, Coumiac Upper Quarry; KW, Kruskal−Wallis; P, probability; sf, size−free; TPP, Thong Pha Phum; XN, Xom Nha.
Palmatolepis Famennian triangularis
Frasnian
Palmatolepis linguiformis
Frasnian
Palmatolepis rhenana
A0 PC1 PC1sf A0 PC1 PC1sf A0 PC1 PC1sf
East/West ANOVA KW Levene P P P 0.038 0.057 0.155 0.092 0.059 0.718 0.001 0.001 0.680 0.000 0.000 0.000 0.000 0.000 0.000 0.000 0.000 0.000 0.000 0.000 0.352 0.000 0.000 0.020 0.000 0.002 0.000
In order to discard the global size−related effect, but retain geographic and temporal variations, a new data set was ob− tained as the residuals of multivariate regression of the FCs vs. size. A similar approach was applied for each time−slice. These new “size−free” data−sets were analysed as the raw data sets using multivariate statistics, including visualisation by a PCA and tests of the geographic structure by MANOVA. Distribution of the first axis of each of these PCA, considered as synthetic size−free shape axis, was further investigated for each time−slice using ANOVA, Kruskal−Wallis and Levene’s tests.
Results Patterns of size and shape differentiation.—Variations in size and shape were first addressed by considering together all Manticolepis conodonts from the four sections across the time period considered (Fig. 4). Regarding shape (Fig. 4A), the major differentiation opposes Frasnian and Famennian conodonts whatever their geographic origin. This opposition does not hold true for size (Fig. 4B) that fails to show clear patterns. Noteworthy, samples from the Vietnamese outcrop (Xom Nha) tend to be larger on average whereas those from the Moroccan section (Mrirt) tend to be the smallest. We further tested how much size and shape varied in the different sections. Temporal variations in size were signifi− cant in CUQ and TPP but not in XN and Mrirt. Temporal variations in shape were documented in all four sections (MANOVA: P < 0.001). We further investigated how much size may drive shape variations due to allometric relationship. Indeed, size and shape appear overall related (Fig. 4B). This relationship is highly significant both when considering PC1 as synthetic shape estimator (PC1 vs. A0: P < 0.001) and when consider−
CUQ−Mrirt ANOVA KW Levene P P P 0.000 0.000 0.794 0.000 0.000 0.092 0.008 0.002 0.155 0.000 0.000 0.865 0.000 0.000 0.716 0.000 0.000 0.097 0.000 0.000 0.005 0.024 0.039 0.011 0.382 0.230 0.192
ANOVA P 0.000 0.000 0.134
TPP−XN KW P 0.000 0.000 0.131
Levene P 0.210 0.023 0.262
0.000 0.536 0.003
0.000 0.568 0.009
0.143 0.090 0.004
ing a multivariate regression of all shape variables (FCs) vs. size (P < 0.001). Geographic differences in size.—In the earliest time−slice (Palmatolepis rhenana), a significant difference in mean size was found between the Eastern and the Western part of the Prototethys (Fig. 5A). Variances of the distribution were, however, similar on both sides of the ocean. Local differ− ences in size were involved within both area, the two sections documenting the Western part (CUQ and Mrirt) and Eastern part (XN and TPP) being significantly different from each other in mean size (Table 2). Differences in size variance were more reduced, being only significant on the Western part of the ocean (Table 2). In the following time−slice shortly preceding the Kell− wasser event and the F−F boundary (Palmatolepis lingui− formis), the East−West difference was marked on mean size as well as on size variance. A difference among sections doc− umenting the Western area was also evidenced but these as− semblages shared similar patterns of variance (Table 2). In the latest time−slice corresponding to the beginning of the Famennian (Palmatolepis triangularis), Eastern and West− ern assemblages do not differ anymore in mean size nor size variance (Table 2). Differences in mean size however locally exist but size variances are similar between these two sections (Fig. 5A, Table 2). Geographic differences in shape.—During the Pa. rhenana time−slice, conodonts from the Eastern and Western part of the Prototethys differ in shape (MANOVA on FCs: P < 0.001; Fig. 5B). They also slightly differ in shape variance as esti− mated on PC1 (Table 2). This difference in shape distribution was even more marked during the Pa. linguiformis time−slice (Tables 2 and 3). This shape difference fades out during the subsequent time−slice triangularis (Tables 2 and 3). Within each time−slice, this global geographic pattern is, however, blurred by local differences. These local differ− doi:10.4202/app.2009.0098
682
ACTA PALAEONTOLOGICA POLONICA 55 (4), 2010
Size (A 0)
Palmatolepis triangularis
V: ns M: ns
5
3 2
1
0 -1
0 -1 -2
1 0
-3
3
4
V: *** M: ***
1 0
2
-1
1
-2
0
-3
6
3
V: *** M: ***
3
PC1 sf , 27.6%
PC1, 27.6%
2 1 0
-1
V: ns M: ***
-2 -3
2
PC1, 24.6%
4 3 2 1
3
V: * M: ***
1 0
-3
M West
V T East Morocco (M)
1 0
-1
-1
-2
-2
F
V: *** M: **
2
PC1sf , 25.0%
MN Zone 13b-c
-4
2
4
5
MN Zone 13a
-3
3
V: *** M: ***
5
FRASNIAN
Palmatolepis linguiformis
V: ns M: ***
2
1
-2
6
Palmatolepis rhenana
3
V: ns M: ns
2
4
Shape sf
Shape
3
PC1, 24.9%
FAMENNIAN
6
PC1 sf , 24.8%
V: Variance M: Mean
-3
F
M West
Thailand (T)
V
T
-4
East France (F)
F
M West
V T East
Vietnam (V)
Fig. 5. Differences in size and shape variance through time and space. A. Size distribution of the Palmatolepis (Manticolepis) elements per geographical re− gion and per time slice. Each dot corresponds to a value. Size is estimated by the zeroth harmonic of a Fourier analysis of the platform outline. B. Shape dis− tribution, of the Palmatolepis (Manticolepis) elements per geographical region and per time slice. Shape is estimated by the scores on PC1. Each dot corre− sponds to a value. C. Distribution of the size−free shape, estimated by the scores on PC1sf, of the Palmatolepis (Manticolepis) elements per geographical re− gion and per time slice. Each dot represents single specimen; the grey beld corresponds to the Upper Kellwasser (UKW). Abbreviations: M, mean (Kruskall−Wallis); V, variance (Levene test).
ences are not highly pronounced during the Pa. rhenana time−slice (Tables 2 and 3), but are more marked during the Pa. linguiformis time−slice within the Western area (Table 3) and during the Pa. triangularis time−slice (Tables 2 and 3). Geographic differences in size−free shape (Fig. 5C).— Con− sidering size−free shape estimates instead of raw FCs for each time−slice separately, there was little change in the pattern of
shape differentiation during the Palmatolepis rhenana time− slice between Eastern and Western area (Tables 2 and 3) but the difference in shape variance increased (Table 2). Local dif− ferences were less marked in the Western area (Tables 2 and 3) but more pronounced in the Eastern area (Tables 2 and 3). During the Pa. linguiformis time−slice, the pattern of geographic differentiation was as marked on size−free shape parameters as for raw data. Significant differences
Palmatolepis triangularis
683
MN Zone 13b-c MN Zone 13a
Palmatolepis rhenana
FRASNIAN
Pa. linguiformis
FAMENNIAN
GIRARD ET AL.—GEOGRAPHIC DIFFERENTIATION OF DEVONIAN CONODONT
France Morocco Vietnam Thailand
1
1.5
2
2.5 -2
-1.5
Size (A0)
-1
-0.5
0
Shape PC1, 25.83%
0.5
1
1.5 -2.5
-2
-1.5
-1
-0.5
0
0.5
1
Shape PC1 sf , 25.04%
Fig. 6. Size (estimated by the zeroth harmonic of a Fourier analysis of the platform outline) and shape variations of Palmatolepis (Manticolepis) through Coumiac (France), Mrirt (Morocco), Xom Nha (Vietnam) and Thong Pha Phum (Thailand). Shape is estimated by the score on PC1 (25.5%) and by the score on PC1sf (24.4%). The symbols represent the average value per level; error bars correspond to the 95% confidence interval. The grey beld corresponds to the Upper Kellwasser (UKW). Open symbols: Frasnian; grey and black symbols: Famennian; circles = Coumiac, squares = Mrirt, triangles = Xom Nha, diamond = Thong Pha Phum. Grey boxes = the 3 time−slices.
between East and West emerged (Tables 2 and 3). Local dif− ferences within the Western area were also pronounced (Tables 2 and 3). Considering the size−free shape estimates increased the differentiation between East and West during the Pa. trian− gularis time−slice (Tables 2 and 3) although differences in shape variance are still not significant (Table 2). In contrast, local differences are attenuated (Table 3). Table 3. Tests for shape differences for the three time−slices tested us− ing multivariate analyses of variance (MANOVA). Shape estimators are the Fourier Coefficients (FCs) and the residuals of a multivariate regression of the FCs vs. size (Res−sf). Abbreviations: CUQ, Coumiac Upper Quarry; P, probability; sf, size−free; TPP, Thong Pha Phum; XN, Xom Nha. East/
CUQ−
MANOVA West Mrirt
TPP−XN
P
P
P
0.000
0.000
0.000 0.004
Famennian
Palmatolepis triangularis
A1−B11 Res−sf
0.000
0.000
Frasnian
Palmatolepis linguiformis
A1−B11
0.000
0.001
Res−sf
0.000
0.000
Frasnian
Palmatolepis rhenana
A1−B11
0.000
0.001
0.000
Res−sf
0.001
0.010
0.000
Summary of size and shape variations through time and space.—The patterns of differentiation detailed above per time−slice can be integrated into a broader framework show− ing temporal and spatial variations (Fig. 6). Temporal and spatial trends in size are quite fuzzy (Fig. 6A) and especially, no clear response to the major step represented by the F/F boundary can be identified consistently. Local characteris− tics seem to be of prime importance, with conodonts being on average the smallest in the Moroccan section (Mrirt) and the largest in the Vietnamese outcrop (Xom Nha), to the excep− tion of the latest sample. Patterns of shape variations are much more coherent (Fig. 6B). Especially, the major morphological shift characterising the F/F, already recognized in Western samples (e.g., Girard and Renaud 2007) appears to occur in a similar way in the Eastern locations. Eastern samples, especially from Xom Nha, appear close to the reference outcrop Coumiac but slightly shifted towards positive values, whereas conodonts in Mrirt appear to be characterized by the reverse trend. This may be due to an allometric covariation with size, Xom Nha and Mrirt being characterized by the largest and smallest conodont size, respectively. Considering size−free shape variations (Fig. 6C) allowed removing any blurring effects of local size differ− ences. Indeed, the gap between Vietnamese and Coumiac samples disappeared, providing very coherent trends across, before and after the F/F boundary. doi:10.4202/app.2009.0098
684
Discussion Global trends of Palmatolepis (Manticolepis) shape over time.—A first striking result emerging from the present anal− ysis was actually to show how little geographic differentia− tion occurred within Palmatolepis (Manticolepis) during the investigated Late Devonian period. In contrast, very coher− ent and homogeneous temporal trends emerge throughout the time interval in all sections considered. This corroborates previous results suggesting that shape trends in Palmatolepis (Manticolepis) were comparable among sections and might serve for stratigraphic correlations (Girard and Renaud 2007). These results, however, were only based on outcrops from the Western margin of the Prototethys; the present re− sults show that they can be generalized to the whole Protote− thysian domain. In the Western area, the temporal shape trends in Pa. (Manticolepis) have been further shown to par− allel environmental variations, suggesting that shape varia− tions might have been triggered by subtle variations in their diet, in turn triggered by changes in the trophic chain (Balter et al. 2008). The geographic homogeneity of the response of Pa. (Manticolepis) to this environmental forcing suggests that on this respect, global change had an impact largely overcoming local environmental differences. This assertion seems trivial for the F/F crisis, known to have been global and of tremendous impact on the fauna on a world−wide scale; it is less intuitive, however, for the trends occurring during the late Frasnian and the early Famennian. Geographic differentiation and eustatic trends.—The present study failed to identify clear−cut morphotypes characteristic of the Western vs. Eastern Prototethys, all assemblages largely overlapping in size and shape. Still, thanks to the impressive sampling allowed by conodonts for morphometric analyses, we evidenced some subtle differentiation between these two biogeographic areas, in the way (mean and variance) the size and shape values were distributed. This differentiation was not constant over time: being quite subtle in the late Frasnian inter− val (Pa. rhenana Zone), it appeared maximal just before the crisis during the Pa. linguiformis Zone, to decrease to almost no geographic differences in the early Famennian. Several factors may explain this temporal dynamics of the biogeographic pattern. Eustatic trends seem to be good candidates to modify the patterns of water mixing and affect the distribution of marine organisms, although evidences of their impact on the geographic structure of the fauna are conflicting. On the one hand, transgression may be invoked to increase water mixing, and hence long−term dispersal and cosmopolitanism. On the other hand, high sea−level in− creases the areas of epicontinental seas, possibly providing more complex landscapes favorable to geographic differen− tiation. Accordingly, increased diversity were observed during global rises of sea−levels in ammonoids (Klug 2002) and trilobites (McNamara and Feist 2006; McNamara et al. 2009). The more complex the marine landscapes, the more
ACTA PALAEONTOLOGICA POLONICA 55 (4), 2010
the rise in diversity associated with transgressive conditions should be pronounced. How to interpret the temporal dynamics of geographic differentiation of Palmatolepis conodonts in this context? The late Frasnian Pa. rhenana Zone was characterized by low sea−level, followed by a transgression shortly before the F/F crisis, probably culminating at the base of the Upper Kellwasser deposit. This transgressive episode was followed by a regressive trend at the top of the Kellwasser event, which continued during the early Famennian (Sandberg et al. 2002; Racki 2005; Girard and Renaud 2007). Our results to a maximal geographic differentiation during the transgressive episode of the Latest Frasnian, an observation apparently dis− crepant with the long−term observation that the overall cos− mopolitanism of the conodonts increased through the Fras− nian (Klapper 1995) together with a global sea−level rise (Johnson et al. 1985; Haq and Schutter 2008). This discrepancy may be due to particular tectonic con− ditions during the Latest Frasnian, a period suggested to be marked by extensive synsedimentary tectonics and block movements leading to complex shelf topography (Racki 1998; Averbuch et al. 2005). In addition, long−term dis− persal does not necessarily prevent geographic differentia− tion, if the ecological conditions are contrasted enough to promote local adaptation (e.g., Norris and de Vargas 2000; de Vargas et al. 2001). Indeed, the geographic restriction of Pa. linguiformis during the same Latest Devonian time in− terval on the Eastern shelf of the Prototethys already sug− gested contrasted ecological conditions (Girard et al. 2007) that may have promoted subtle geographic differentiation within the apparently cosmopolitan Pa. (Manticolepis). The F/F crisis swamping biogeographic differences.— Geographic differentiation within Pa. (Manticolepis) appea− red overall subtle throughout the record, but for a similarly low sea−level, geographic differentiation between Eastern and Western part of the Prototethys seems to have been even lower during the early Famennian, i.e., the recovery period following the F/F crisis, than during the preceding late Fras− nian Palmatolepis rhenana time−interval. This suggests that the occurrence of a major biotic crisis swamped out geographic differentiation. This matches a pattern already documented for several extinctions events (Cocks and Fortey 1990; Hallam and Wignall 1997). A pos− sible explanation is that, even for animals surviving the cri− sis such as Pa. (Manticolepis), survival occurred in favor− able patches from which a global recolonization by forms adapted to the new environmental conditions occurred. Overall cosmopolitanism and local differences.—Beyond these trends in temporal response to environmental changes and in biogeographic differentiation, a further striking feature is the frequent occurrence of local geographic differences be− tween conodonts from outcrops located on the same area of the Prototethys margin. How to reconcile an overall cosmopolitan− ism of Pa. (Manticolepis), widely distributed without clear dif− ferentiation at a global scale, and such local differences?
GIRARD ET AL.—GEOGRAPHIC DIFFERENTIATION OF DEVONIAN CONODONT
Two, not mutually exclusive, ranges of explanation can be invoked. First, marked local differences persisting throughout the record regard size differences, with for instance conodonts being on average larger in the Xom Nha section and smaller in the Mrirt section. This might be due to different taphonomic processes, favoring deposition of conodonts of various size range (McGoff 1991). Size distributions in the various sec− tions (Fig. 5), however, document the occurrence of the whole range of conodont size in all sections, differences being rather due to distributions more or less skewed towards small−sized conodonts. Since the size of the conodont element is related to growth, the distribution of the size value can point to the pat− tern of survivorship of the conodonts at this time and space (e.g., Girard and Renaud 2008). Geographic structure in cono− dont size may thus be due to differences in life−history traits due to local ecological conditions. It is difficult to explain geographic shape differentiation, however, by differences in growth only, especially once allo− metric influences have been retrieved by considering size− free variables. Shape differences, even subtle, are more com− monly the phenotypic expression of an underlying genetic differentiation as shown in various marine organisms (e.g., Cadrin 2000; de Vargas et al. 2001; Borsa 2002; Kassahn et al. 2003; Turan 2004). The local morphometric differences evidenced in Palmatolepis (Manticolepis) would thus point to a genetic structure despite an overall cosmopolitanism. This raises the question of how to mix populations of marine organisms on a global and local scale. Marine organisms, es− pecially with planktic life stages, are expected to be capable of long distance dispersal (e.g., Kyle and Boulding 2000). Indeed, long distance genetic mixing has been shown in planktic organisms such as foraminifera (Darling et al. 2000) and fishes (e.g., Grant and Bowen 1998). Such long distance dispersal is not inconsistent, however, with a structure be− tween distant populations (Graves 1998), depending on the amount of gene flow. Geographic differences between popu− lations may even occur at a finer scale, depending on the complexity of marine landscapes and currents, even in ani− mals capable of long−range dispersal such as marine fishes (e.g., Roques et al. 2002; Jørgensen et al. 2005). Hence, the cosmopolitism of Pa. (Manticolepis) is compatible with both the occurrence of a large scale geographic pattern, although transient in time, and the occurrence of subtle local differen− tiations. This points to the potential of such fine scale mor− phometric analyses to decipher the population dynamics in extinct organisms; in a reassuring way, however, such bio− geographic signature remains discrete compared with global signals, allowing for correlations of morphometric trends in Pa. (Manticolepis) conodonts on a global scale.
Acknowledgements We thank Raimund Feist (Université Montpellier, Montpellier, France) for numerous discussions. The manuscript greatly benefited from the constructive reviews of Grzegorz Racki (Institute of Paleobiology
685
PAS, Warsaw, Poland), Mark A. Purnell (University of Leicester, Leicester, UK), and Michael Foote (University of Chicago, Chicago, USA). This work has been supported by the program GDR 2474 CNRS “Morphométrie et Evolution des Formes”. This is publication ISEM 2010−039.
References Algeo, T.J. and Scheckler, S.E. 1998. Terrestrial−marine teleconnections in the Devonian: links between the evolution of land plants, weathering processes, and marine anoxic events. Philosophical Transactions of the Royal Society 353: 113–130. http://dx.doi.org/10.1098/rstb.1998.0195 Alroy, J. 2008. Dynamics of origination and extinction in the marine fossil record. Proceedings of the National Academy of Sciences USA 105: 11536–11542. http://dx.doi.org/10.1073/pnas.0802597105 Averbuch, O., Tribovillard, N., Devleeschouwer, X., Riquier, L., Mistien, B., and van Vliet−Lanoe, B. 2005. Mountain building−enhanced conti− nental weathering and organic carbon burial as major causes for climatic cooling at the Frasnian–Famennian boundary (c. 376 Ma)? Terra Nova 17: 25–34. http://dx.doi.org/10.1111/j.1365-3121.2004.00580.x Balter, V., Renaud, S., Girard, C., and Joachimski, M.M. 2008. Record of climate−driven morphological changes in 376 Ma Devonian fossils. Ge− ology 36: 907–910. http://dx.doi.org/10.1130/G24989A.1 Bambach, R.K., Knoll, A.H., and Wang, S.C. 2004. Origination, extinction, and mass depletions of marine diversity. Paleobiology 30: 522–542. http://dx.doi.org/10.1666/0094-8373(2004)030%3C0522:OEAMDO %3E2.0.CO;2 Becker, R.T., Feist, R., Flajs, G., House, M.R., and Klapper, G. 1989. Frasnian/Famennian extinction events in the Devonian at Coumiac, southern France. Comptes Rendus de l‘Académie des Sciences, série II 309: 259–266. Borsa, P. 2002. Allozyme, mitochondrial−DNA, and morphometric vari− ability indicate cryptic species of anchovy (Engraulis encrasicolus). Bi− ological Journal of the Linnean Society 75: 261–269. Buisson, L. and Grenouillet, G. 2009. Contrasted impacts of climate change on stream fish assemblages along an environmental gradient. Diversity and Distributions 15: 613–626. http://dx.doi.org/10.1111/j.1472-4642.2009.00565.x Cadrin, S.X. 2000. Advances in morphometric identification of fishery stocks. Reviews in Fish Biology and Fisheries 10: 91–112. http://dx.doi.org/10.1023/A:1008939104413 Caron, D.A., Faber, W.W. J., and Bé, A.W.H. 1987. Effects of temperature and salinity on the growth and survival of the planktonic foraminifer Globigerinoides sacculifer. Journal of the Marine Biological Associa− tion of the United Kingdom 67: 323–342. http://dx.doi.org/10.1017/S0025315400026643 Chen, D., Tucker, M.E., Shen, Y., Yans, J., and Préat, A. 2002. Carbon iso− tope excursions and sea−level change: implications for the Frasnian– Famennian biotic crisis. Journal of the Geological Society, London 159: 623–626. Cocks, L.R.M. and Fortey, R.A. 1990. Biogeography of Ordovician and Si− lurian faunas. Geological Society, London, Memoirs 12: 97–104. Copper, P. 1998. Evaluating the Frasnian–Famennian mass extinction: com− paring brachiopod faunas. Acta Palaeontologica Polonica 43: 137–154. Darling, K.F., Wade, C.M., Stewart, I.A., Kroon, D., Dingle, R., and Leigh Brown, A.J. 2000. Molecular evidence for genetic mixing of Arctic and Antarctic subpolar populations of planktonic foraminifers. Nature 405: 43–47. http://dx.doi.org/10.1038/35011002 de Vargas, C., Renaud, S., Hilbrecht, H., and Pawlowski, J. 2001. Pleisto− cene adaptative radiation in Globorotalia truncatulinoides: genetic, morphologic, and environmental evidence. Paleobiology 27: 104–125. http://dx.doi.org/10.1666/0094-8373(2001)027%3C0104:PARIGT%3 E2.0.CO;2 doi:10.4202/app.2009.0098
686 Dzik, J. 2002. Emergence and collapse of the Frasnian conodont and ammonoid communities in the Holy Cross Mountains, Poland. Acta Palaeontologica Polonica 47: 565–650. Gaylord, B. and Gaines, S.D. 2000. Temperature or Transport? Range Lim− its in Marine Species Mediated Solely by Flow. The American Natural− ist 155: 769–789. http://dx.doi.org/10.1086/303357 Girard, C. and Renaud, S. 2007. Quantitative conodont−based approaches for correlation of the Late Devonian Kellwasser anoxic events. Palaeo− geography, Palaeoclimatology, Palaeoecology 250: 114–125. http://dx.doi.org/10.1016/j.palaeo.2007.03.007 Girard, C. and Renaud, S. 2008. Disentangling allometry and response to Kellwasser anoxic events in the Late Devonian conodont genus Ancyro− della. Lethaia 41: 383–394. http://dx.doi.org/10.1111/j.1502-3931.2008.00095.x Girard, C., Klapper, G., and Feist, R. 2005. Subdivision of the terminal Frasnian linguiformis conodont Zone, revision of the correlative inter− val of Montagne Noire Zone 13, and discussion of stratigraphically sig− nificant associated trilobites. In: D.J. Over, J.R. Morrow, and P.B. Wignall (eds.), Understanding Late Devonian and Permian–Triassic Biotic and Climatic Events: Towards an Integrated Approach. Develop− ments in Palaeontology and Stratigraphy Series 20: 181–198. http://dx.doi.org/10.1016/S0920-5446(05)80007-X Girard, C., Renaud, S., and Feist, R. 2007. Morphometrics of Late Devonian conodont genus Palmatolepis: phylogenetic, geographical and ecologi− cal contributions of a generic approach. Journal of Micropalaeontology 26: 61–72. Girard, C., Renaud, S., and Sérayet, A. 2004. Morphological variation of Palmatolepis Devonian conodonts: species vs. genus. Comptes rendus Paleovol 3: 1–8. http://dx.doi.org/10.1016/j.crpv.2003.09.008 Grant, W.S. and Bowen, B.W. 1998. Shallow population histories in deep evolutionary lineages of marine fishes: insights from sardines and an− chovies and lessons for conservation. The American Genetic Associa− tion 89: 415–426. Graves, J.E. 1998. Molecular insights into population structures of cosmo− politan marine fishes. The American Genetic Association 89: 427–437. Hallam, A. and Wignall, P.B. 1997. Mass Extinctions and Their Aftermath. 330 pp. Oxford University Press, Oxford. Haq, B.U. and Schutter, S.R. 2008. A chronology of Paleozoic sea−level changes. Science 322: 64–68. http://dx.doi.org/10.1126/science.1161648 Joachimski, M.M. and Buggisch, W. 2002. Conodont apatite d18O signatures indicate climatic cooling as a trigger of the Late Devonian mass extinction. Geology 30: 711–714. http://dx.doi.org/10.1130/0091-7613(2002)030% 3C0711:CAOSIC%3E2.0.CO;2 Joachimski, M.M., Breisig, S., Buggisch, W., Talent, J.A., Mawson, R., Gereke, M., Morrow, J.R., Day, J., and Weddige, K. 2009. Devonian climate and reef evolution: Insights from oxygen isotopes in apatite. Earth and Planetary Science Letters 284: 599–609. http://dx.doi.org/10.1016/j.epsl.2009.05.028 Johnson, J.G., Klapper, G., and Sandberg, C.A. 1985. Devonian eustatic fluctuations in Euramerica. Geological Society of America Bulletin 96: 567–587. http://dx.doi.org/10.1130/0016-7606(1985)96%3C567: DEFIE%3E2.0.CO;2 Jørgensen, H.B., Hansen, M.M., Bekkevold, D., Ruzzante, D.E., and Loe− schcke, V. 2005. Marine landscapes and population genetic structure of herring (Clupea harengus L.) in the Baltic Sea. Molecular Ecology 14: 3219–3234. http://dx.doi.org/10.1111/j.1365-294X.2005.02658.x Kassahn, K.S., Donnellan, S.C., Fowler, A.J., Hall, K.C., Adams, M., and Shaw, P.W. 2003. Molecular and morphological analyses of the cuttlefish Sepia apama indicate a complex population structure. Marine Biology 143: 947–962. http://dx.doi.org/10.1007/s00227-003-1141-5 Klapper, G. 1989. The Montagne Noire Frasnian (Upper Devonian) conodont succession. In: N.J. McMillan, A.F. Embry, and D.J. Glass (eds.), Devo− nian of the World. Paleontology, Paleoecology, Biostratigraphy. Cana− dian Society of Petroleum Geologists, Calgary. Memoir 14: 449–468. Klapper, G. 1995. Preliminary analysis of Frasnian, Late Devonian cono−
ACTA PALAEONTOLOGICA POLONICA 55 (4), 2010 dont biogeography. Historical Biology 10: 103–117. http://dx.doi.org/10.1080/10292389509380514 Klapper, G., Feist, R., Becker, R.T. and House, M.R. 1993. Definition of the Frasnian–Famennian Stage Boundary. Episodes 16: 433–441. Klug, C. 2002. Quantitative stratigraphy and taxonomy of late Emsian and Eifelian ammonoids of the eastern Anti−Atlas. Courier Forschungsinstitut Senckenberg 238: 1–109. Kyle, C.J. and Boulding, E.G. 2000. Comparative population genetic struc− ture of marine gastropods (Littorina spp.) with and without pelagic lar− val dispersal. Marine Biology 137: 835–845. http://dx.doi.org/10.1007/s002270000412 Lazreq, N. 1992. The Upper Devonian of Mrirt (Morocco). Courier For− schungsinstitut Senckenberg 154: 107–123. Lazreq, N. 1999. Biostratigraphie des conodontes du Givétien au Famen− nien du Maroc central – Biofaciès et événement Kellwasser. Courier Forschungsinstitut Senckenberg 214: 1–111. Luu, T.P.L., Elwood, B.B., and Ta, H.P. 2007. Defining the Frasnian/ Famennian (Upper Devonian) boundary on the limestones of Xom Nha Mountain, Quang Binh Province, using stratigraphy (conodonts) and magnetostratigraphic (susceptibility) data [in Vietnamese]. Journal of Sciences of Earth 29: 30–37. McGhee, G.R.J. 1996. The Late Devonian Mass Extinction—The Frasnian/ Famennian Crisis. 303 pp. Columbia University Press, New York. McGoff, H.J. 1991. The hydrodynamics of conodont elements. Lethaia 24: 235–247. http://dx.doi.org/10.1111/j.1502-3931.1991.tb01472.x McNamara, K.J. and Feist, R. 2006. New styginids from the Late Devonian of Western Australia—the last corynexochid trilobites. Journal of Paleontol− ogy 80: 981–92. http://dx.doi.org/10.1666/0022-3360(2006)80%5B981: NSFTLD%5D2.0.CO;2 McNamara, K.J., Feist, R., and Ebach, M.C. 2009. Patterns of evolution and extinction in the last harpetid trilobites during the Late Devonian (Frasnian). Palaeontology 52: 11–33. http://dx.doi.org/10.1111/j.1475-4983.2008.00832.x Michaux, J. 1971. Muridae (Rodentia) néogènes d'Europe sud−occidentale. Evolution et rapports avec les formes actuelles. Paléobiologie continen− tale, Montpellier 2: 1–67. Michaux, J., Cucchi, T., Renaud, S., Garcia−Talavera, F., and Hutterer, R. 2007. Evolution of an invasive rodent on an archipelago as revealed by molar shape analysis: the house mouse in the Canary Islands. Journal of Biogeography 34: 1412–1425. http://dx.doi.org/10.1111/j.1365-2699.2007.01701.x Morrow, J. 2000. Shelf−to−basin lithofacies and conodont paleoecology across Frasnian–Famennian (F−F, mid−Late Devonian) boundary, Central Great Basin (Western USA). Courier Forschungsinstitut Senckenberg 219: 1–57. Norris, R. and Vargas, C. de 2000. Evolution all at sea. Nature 405: 23–24. http://dx.doi.org/10.1038/35011162 Racki, G. 2005. Towards understanding Late Devonian global events: few answers, many questions. In: D.J. Over, J.R. Morrow, and P.B. Wignall (eds.), Understanding Late Devonian and Permian–Triassic Biotic and Climatic Events: Towards an Integrated Approach. Developments in Palaeontology and Stratigraphy Series 20: 5–36. Racki, G. 1998. Frasnian–Famennian biotic crisis: undervalued tectonic control? Palaeogeography, Palaeoclimatology, Palaeoecology 141: 177–198. http://dx.doi.org/10.1016/S0031-0182(98)00059-5 Raup, D.M. and Sepkoski, J.J. Jr. 1982. Mass extinctions in the marine fossil record. Science 215: 1501–1503. http://dx.doi.org/10.1126/science.215.4539.1501 Renaud, S. and Girard, C. 1999. Strategies of survival to extreme environmen− tal perturbations: evolution of conodonts in response to the Kellwasser cri− sis (Upper Devonian). Palaeogeography, Palaeoclimatology, Palaeoec− ology 146: 19–32. http://dx.doi.org/10.1016/S0031-0182(98)00138-2 Renaud, S. and Schmidt, D.N. 2003. Habitat tracking as a response of the planktic foraminifer Globorotalia truncatulinoides to environmental fluctuations during the last 140 kyr. Marine Micropaleontology 49: 97–122. http://dx.doi.org/10.1016/S0377-8398(03)00031-8
GIRARD ET AL.—GEOGRAPHIC DIFFERENTIATION OF DEVONIAN CONODONT Rode, A.L. and Lieberman, B.S. 2004. Using GIS to unlock the interactions between biogeography, environment, and evolution in Middle and Late Devonian brachiopods and bivalves. Palaeogeography, Palaeoclimato− logy, Palaeoecology 211: 345–359. http://dx.doi.org/10.1016/j.palaeo.2004.05.013 Rode, A.L. and Lieberman, B.S. 2005. Integrating evolution and biogeo− graphy: a case study involving Devonian crustaceans. Journal of Pale− ontology 79: 267–276. http://dx.doi.org/10.1666/0022-3360(2005)079 %3C0267:IEABAC%3E2.0.CO;2 Roques, S., Sévigny, J.−M., and Bernatchez, L. 2002. Genetic structure of deep−water redfish, Sebastes mentella, populations across the North At− lantic. Marine Biology 140: 297–307. http://dx.doi.org/10.1007/s002270100705 Sandberg, C.A., Morrow, J.R., and Ziegler, W. 2002. Late Devonian sea−level changes, catastrophic events, and mass extinctions. In: C. Koeberl and K.G. MacLeod (eds.), Catastrophic Events and Mass Ex− tinctions: Impacts and Beyond. Boulder, Colorado: Geological Society of America, Special Paper 356 : 473–487. Sandberg, C.A., Ziegler, W., Dreseen, R., and Butler, J.L. 1988. Late Frasnian mass extinction: conodont event stratigraphy, global changes, and possible causes. Courier Forschungsinstitut Senckenberg 102: 263–307. Savage, N.M., Sardsud, A., and Buggisch, W. 2006. Late Devonian and the global Frasnian–Famennian extinction event, Thong Pha Phum, west− ern Thailand. Palaeoworld 15: 171–184. http://dx.doi.org/10.1016/j.palwor.2006.07.005 Schmidt, D.N., Renaud, S., and Bollmann, J. 2003. Reaction of planktic foraminiferal size to late Quaternary climate change. Paleoceanography 18: 1039. doi:10.1029/2002PA000831 Schmidt, D.N., Renaud, S., Bollmann, J., Schiebel, R., and Thierstein, H.
687
2004. Size distribution of Holocene planktic foraminifer assemblages: biogeography, ecology and adaptation. Marine Micropaleontology 50: 319–338. http://dx.doi.org/10.1016/S0377-8398(03)00098-7 Schülke, I. 1998. Conodont community structure around the “Kellwasser mass extinction event” (Frasnian/Famennian boundary interval). Senckenber− giana Lethaea 77: 87–99. http://dx.doi.org/10.1007/BF03043736 Scotese, C.R. and Golonka, J. 1992. PALEOMAP Paleogeographic Atlas, PALEOMAP Progress Report No. 20. 34 pp. Department of Geology, University of Texas at Arlington, Arlington, Texas. Scotese, C.R. and McKerrow, W.S. 1990. Revised world maps and introduc− tion. In: W.S. McKerrow and C.R. Scotese (eds.), Palaeozoic palaeo− geography and biogeography. London: Geological Society of London Memoirs 12: 1–24. Stenseth, N.C., Ottersen, G., Hurrell, J.W., Mysterud, A., Lima, M., Chan, K.−S., Yoccoz, N. G., and Adlandsvik, B. 2003. Studying climate ef− fects on ecology through the use of climate indices: the North Atlantic Oscillation, El Nińo Southern Oscillation and beyond. Proceedings of the Royal Society of London B 270: 2087–2096. http://dx.doi.org/10.1098/rspb.2003.2415 Ta, H.P. 1998. Upper Devonian conodont biostratigraphy in Vietnam. Jour− nal of Geology, Series B 11–12: 76–84. Turan, C. 2004. Stock identification of Mediterranean horse mackerel (Trachurus mediterraneus) using morphometric and meristic charac− ters. Journal of Marine Science 61: 774–781. von Bitter, P.H. and Purnell, M.A. 2005. An experimental investigation of post−depositional taphonomic bias in conodonts. Special Papers in Palaeontology 73: 39–56. Ziegler, W. and Sandberg, C.A. 1990. The late Devonian standard conodont zonation. Courier Forschungsinstitut Senckenberg 121: 1–115.
doi:10.4202/app.2009.0098