RESEARCH ARTICLE
Temporal fitness fluctuations in experimental Arabidopsis thaliana populations Jinyong Hu1☯*, Li Lei2☯, Juliette de Meaux3* 1 Kunming Institute of Botany, Chinese Academy of Sciences, Kunming, Yunnan Province, P.R. China, 2 Dept. of Agronomy & Plant Genetics, University of Minnesota, St. Paul, MN, United States of America, 3 Institute of Botany, University of Cologne Biocenter, Zu¨lpicherstr. 47b, Cologne Germany ☯ These authors contributed equally to this work. *
[email protected] (JM);
[email protected] (JYH)
a1111111111 a1111111111 a1111111111 a1111111111 a1111111111
OPEN ACCESS Citation: Hu J, Lei L, de Meaux J (2017) Temporal fitness fluctuations in experimental Arabidopsis thaliana populations. PLoS ONE 12(6): e0178990. https://doi.org/10.1371/journal.pone.0178990 Editor: Pa¨r K Ingvarsson, Sveriges lantbruksuniversitet, SWEDEN Received: March 20, 2017 Accepted: May 22, 2017 Published: June 12, 2017 Copyright: © 2017 Hu et al. This is an open access article distributed under the terms of the Creative Commons Attribution License, which permits unrestricted use, distribution, and reproduction in any medium, provided the original author and source are credited. Data Availability Statement: Raw phenotypic data are provided in the supplementary files. Funding: This research was supported by the Deutsche Forschung Gesellschaft (DFG) in the realm of SFB680, and by the European Research Council with Grant 648617 “AdaptoSCOPE”. The funders had no role in study design, data collection and analysis, decision to publish, or preparation of the manuscript. Competing interests: The authors have declared that no competing interests exist.
Abstract Understanding the genetics of lifetime fitness is crucial to understand a species’ ecological preferences and ultimately predict its ability to cope with novel environmental conditions. Yet, there is a dearth of information regarding the impact of the ecological variance experienced by natural populations on expressed phenotypic and fitness differences. Here, we follow the natural dynamics of experimental A. thaliana populations over 5 successive plantings whose timing was determined by the natural progression of the plant’s life cycle and disentangle the environmental and genetic factors that drive plant ecological performance at a given locality. We show that, at the temperate latitude where the experiment was conducted, a given genotype can experience winter-, spring- or summer-annual life cycles across successive seasons. Lifetime fitness across these seasons varied strongly, with a fall planting yielding 36-fold higher fitness compared to a spring planting. In addition, the actual life-stage at which plant overwinter oscillated across years, depending on the timing of the end of the summer season. We observed a rare but severe fitness differential coinciding with inadequate early flowering in one of the five planting. Substrate variation played a comparatively minor role, but also contributed to modulate the magnitude of fitness differentials between genotypes. Finally, reciprocal introgressions on chromosome 4 demonstrated that the fitness effect of a specific chromosomal region is strongly contingent on micro-geographic and seasonal fluctuations. Our study contributes to emphasize the extent to which the fitness impact of phenotypic traits and the genes that encode them in the genome can fluctuate. Experiments aiming at dissecting the molecular basis of local adaptation must apprehend the complexity introduced by temporal fluctuations because they massively affect the expression of phenotype and fitness differences.
Introduction There is overwhelming evidence that local selection pressures have shaped the genetic composition and ecological performance of natural populations [1–3]. But in the context of rapid climate change, greater attention must be devoted to the detailed ecological events to which
PLOS ONE | https://doi.org/10.1371/journal.pone.0178990 June 12, 2017
1 / 17
Temporal fitness fluctuations in experimental A. thaliana populations
species have had to evolve to best adjust to their ecological niche [4–6]. The phenotypes that plants manifest in nature, i.e. their timing of germination, their growth rate, and their timing of reproduction, are plastically regulated by environmental conditions that vary both temporally and geographically [7]. Much is known about the molecular mechanisms of many plastic plant traits [8–10]. This plasticity may buffer the effect of environmental fluctuations on fitness and thereby decrease year-to-year fluctuations in selective pressures [5]. Yet, we know little about how environmental fluctuations influence the amount of phenotypic variation that is actually expressed in natural conditions, nor do we know how it impacts population levels of fitness variance, an elemental requirement for adaptive evolution [11]. Here we document seasonal variation in expressed plant life cycles and measurements of fitness in Arabidopsis thaliana, a plant species that stands as a model for the dissection of the molecular underpinnings of local adaptation [12]. In this species, analyses of genetic variation along altitudinal transects often revealed patterns of local adaptation [13–15]. Patterns of nucleotide variation uncovered the population genetics signatures of local adaptation on diverse traits [16–20]. Reciprocal transplants of a Swedish and an Italian population suggested phenotypic trade-offs evolved in Scandinavian populations [21,22] and common garden experiments in four different climatic zones highlighted the hundreds of nucleotide variants that associate with local measures of fitness [23]. While these studies reveal the pervasive impact of local selective pressures, we asked ourselves what really these selective pressures are in nature. Because both the environmental conditions and the genetics of specific individuals can vary, the prediction of which plastic traits will be displayed by any one individual and whether it will impact fitness is far from straightforward [24–26]. This question is especially relevant in monocarpic species that target their seasonal growth window with an array of lifehistory traits (e.g. germination, flowering) that are themselves greatly plastic [27]. In most field experiments, the seasonal window was imposed by the experimenter [21,27,28]. Yet, in climatic regions were summers are sufficiently mild and wet to allow the completion of multiple generations on some years, it is unclear whether seasonal fluctuations can cause fluctuations in the seasonal window a genotype might choose. This in turn can dramatically alter the selective pressures exerted and thus the type of adaptive traits required. Does seasonal variance have cascading effects on the choice of successive seasonal windows? Does it impact the magnitude of phenotypic and fitness differences manifested by diverse genotypes? Does life history plasticity tend to buffer differences? How does the effect of temporal variance compare with the magnitude of microgeographic or genetic variance? To answer these questions, we designed an experiment that dissects how environmental factors affect fitness profiles in natural populations at temperate latitude. We report the monitoring of lifetime fitness in experimental populations over 5 natural successions of plant cycles in conditions differing in soil substrate and water availability. We monitored 4 genotypes, including two genomic backgrounds, one of local and one of Southern origin (Col-0 and C24), and the reciprocal chromosome 4 (Chr 4)-introgressions of several polymorphisms previously reported to associate with differential fitness in various locations [23]. We expected that the Southern genotype would perform comparatively better in summer conditions and that these differences would be modulated by the Chr4-introgression and the substrate. We show that at the temperate latitude of our experiment, genotypes can complete multiple cycles per year, alternating summer, winter and spring cycles. Our experiment documents how overall fitness results from complex interactions between seasonal oscillations, soil composition, genomic background and genotypes. As a consequence, both the choice of successive growth seasons and the expressed phenotypic and fitness differences between genotypes fluctuate markedly at a given locality under natural conditions.
PLOS ONE | https://doi.org/10.1371/journal.pone.0178990 June 12, 2017
2 / 17
Temporal fitness fluctuations in experimental A. thaliana populations
Material and methods Genetic plant material Arabidopsis thaliana is an annual weed growing across a broad geographic range [29]. The fruits it produces are called siliques, a character of the Brassicaceae family. In this study, we monitored field performance of two wild type genotypes, Col-0 and C24. Genomic information for these two lines suggest that the Col-0 genotype is typical of Western European populations whereas C24 is more related to Southern European genotypes [30]. We further included in our experiment two reciprocal near-isogenic lines (NILs). The two sets of NILs contained either an introgression of chromosome 4, between 11.8 to 13.8Mb, of C24 accession in Col-0 genomic background or a genomic fragment between 5.1 and 15.3Mb of Col-0 accession in C24 background [31]. Seeds were provided by T. Altmann (IPK, Gatersleben, Germany). Our experiment thus includes genomic background and chromosome-4 introgression as two separate genetic factors. In total, Col-0 and C24 differed for 284 of the 867 SNPs reported to associate with survival and seed production in at least one of 4 locations throughout the range of the species [23]. Of those, 25 (8%) and 38 (13%) SNPs mapped to the introgressed fragments in Col-0 and C24 backgrounds, respectively. They associated with enhanced survival in Finland and silique number in Spain for the Col-0 genotype [23].
Field plantings In this study, we monitored germination, flowering time and fitness of the 2 wild type genotypes, Col-0 and C24 and their reciprocal Chr4 introgressions in the field over five consecutive generations that followed a quasi-natural population establishment dynamics. Fifty field-collected seeds of the two NILs and their wild-type parents were placed in 12 replicate pots (e.g. the experimental unit of this study), for each of the two soil compositions and 4 genotypes. Seeds were taken from a pool of 500 seeds collected from 5 plants per pot in the previous planting. There were two exceptions to this scheme: planting 1 was started with 200 seeds and conducted in only four replicates (32 pots), and planting 5 was performed with only Col-0 and ColNIL due to limitation in personnel (48 pots). The timing of the different plantings is given in Fig 1. The field was located in the middle of a flat grass meadow and fenced with iron nets to prevent grazing by rabbits. No vegetation protected it from sun or wind. We filled large flat pots (30cmx40cmx12cm) with two soil types: Arabidopsis turf soil (Einheitserde Typ Minitray, plus 1kg Osmocote Start per m3, Einheitserde Werkverband, Sinntal-Jossa) or a soil mixture enriched in sand (a 1:3 mixture of the turf described above and sand). Pots thus dried faster in the sand mixture compared to turf. Pots were randomized and placed on a large plastic cover that prevented germination from the soil below (S1 Fig). Each replicate population was prepared in a pot by sowing seeds mixed with 5 g silicon dioxide (Sigma-Aldrich, S5631). Pots had been watered to saturation to facilitate seed adhesion to the soil. After sowing, seeds were left exposed to natural conditions in the field and no watering other than natural rain was done. The first planting was started with seeds fully ripened in the greenhouse. All other plantings were started with seeds collected in the field in the previous planting, with the exception of C24 seeds in planting 4, which were taken from planting 2 (the C24 genotype did not survive winter in planting 3). At complete senescence, plants were collected and dried in paper bags, seeds were harvested so that the following planting could be initiated within 8 days after harvest. For all plantings, seedlings other than A. thaliana were immediately removed when they appeared. Our experiment included empty pots to evaluate whether migration occurred
PLOS ONE | https://doi.org/10.1371/journal.pone.0178990 June 12, 2017
3 / 17
Temporal fitness fluctuations in experimental A. thaliana populations
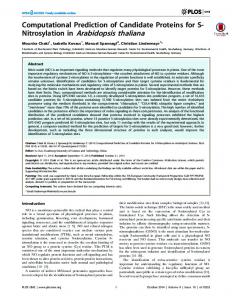
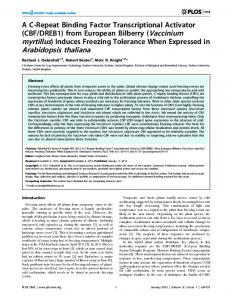
Fig 1. Time plan of the field experiments along five consecutive life-cycles and local meteorological conditions. Meteorological parameters were retrieved from the nearby weather station at airport No¨rvenich. Relative air humidity is shown in blue, maximum day temperature in red, minimum day temperature in pink and average day temperatue in orange. Black arrows on the lower panels mark the starting date of each planting. Gray boxes mark the duration of each planting. White, green, red and orange rectangles stand for winter, spring, summer and fall, respectively. Blue and green arrows mark the approximate germination and flowering time, respectively. C24 and Col-0 had different flowering times only at planting 3. https://doi.org/10.1371/journal.pone.0178990.g001
between pots. After detecting migrants in control pots, we verified the genotype of each seedling. Individuals with the C24 background display glabrous leaves whereas those of individuals with the Col-0 background are hairy. The genomic background could thus be verified visually. A leaf was collected from each single plant to extract DNA and genotype the individual at Chr4 by PCR with primers mi05 (5’-CTCTTGCTGCGTAGGGTTCCC-3’) and mi06 (5’-AT CTCCCCACTCCCCAATTTT-3’), which generate a length polymorphism at AT4G24415 within the chromosome 4 introgression [32]. We detected 26 heterozygotes in 453 individuals in planting 4, suggesting an outcrossing rate in the field of about 5%. These individuals were removed from further analysis. The field study was conducted on the experimental land area of the Max Planck Institute for Plant Breeding Research (Cologne, Germany). This field study did not require specific permission because it did not include transgenic plant material and did not involve endangered or protected species.
Fitness and phenotype scoring For the first planting, early, intermediate and late germinants were observed but the exact germination date was not scored. Germination time was scored for plantings 2–5, flowering time (date of the first open flower) was scored for all five plantings. Silique number was counted for a sample of 3–8 randomly chosen plants in each population. In total, fitness was scored for 96, 401, 583, 301 and 691 plants in plantings 1 to 5, respectively (for a total of 2072 plants distributed in a total of 368 pots). In addition, in plantings 2, 3 and 4, the number of seeds was determined for three siliques in each of 3 randomly chosen plants per population. For fruit number flowering time and germination time, an average was computed for each population (e.g. each pot). The average fruit number per pot was taken as an estimate of lifetime fitness. Variation in average seed number per silique did not change the conclusions based on fruit number (not shown). When plants in a pot failed to germinate or survive until reproduction, lifetime fitness
PLOS ONE | https://doi.org/10.1371/journal.pone.0178990 June 12, 2017
4 / 17
Temporal fitness fluctuations in experimental A. thaliana populations
was set to zero. To account for variation in germination rates, we included plant density as a covariate in the analyses (see below). Raw phenotypic and fitness data is shown in S1 Table.
Statistical analysis All statistical analyses and figures were performed in R. A generalized linear model (GLM) was used to establish the minimal model explaining phenotypic or fitness variation. For this, we followed the procedure described in [33]. A first model with average lifetime fruit production as a dependent variable and including, as explanatory variables, the main factors planting, soil type, genomic background and chromosome 4 region, as well as the 2-way, 3-way and 4-way interactions between these factors was run. To take into account variation in fruit number that may result from competition in densely populated pots, the total number of plant in each population was also included as an explanatory covariate. Non-significant interaction terms were removed one by one, from the most complex to the least complex, using the F-test implemented in the R function drop1. To control for the non-Gaussian error distribution, we used a negative binomial distribution of error (implemented in R Package MASS) and tuned its free parameter to adjust the residual deviance to the degrees of freedom of the model. This adjustment was performed at each step of the procedure, until the minimum model was determined. The resulting “minimal” model included the four main factors and the significant interaction terms. Interpreting the effect of a single experimental factor is not straightforward in the presence of interactions between factors, especially when the 4-way interaction is significant. We thus broke down the factors and conducted separate ad-hoc GLM for each genomic background or for subsets of plantings. The fold-change attributed to experimental factor was calculated by taking the exponential of the log estimates given by the model (GLM with negative binomial distribution of error used the natural log as a link function). This measure corresponds to the odds ratio associated with the factor. The proportion of variance explained by each factor or interaction term, was calculated as the ratio of the deviance calculated for a given factor against the total deviance. To compute the fitness fold-change attributed to the chromosome 4 introgression within each combination of experimental factor (planting, soil composition and genomic background), we ran a separate GLM analysis with introgression as a factor nested within a factor called “setting”, which combined soil condition, planting and genomic background in 16 levels. Fitness fold-change attributed to variation in the chromosome 4 region was calculated as described above. The product of day length (h) by mean temperature (˚C) was calculated for each day and summed for the time windows covering date of sowing to average germination (or flowering) date to compute the cumulated Photo-Thermal Units (PTU) for each planting, following Brachi et al. 2010 [19].
Results Effect of experimental factors on lifetime fitness We monitored average silique (fruit) production in experimental A. thaliana populations over five naturally consecutive plantings by counting the average number of siliques produced per pot (Fig 1). Climatic differences between successive plantings are summarized in Table 1. A generalized linear model with a negative binomial distribution of error adjusted to minimize overdispersion revealed that all factors of the experiment interacted with each other to alter this measure of fitness (Table 2). The average number of siliques (fruits) produced in each population was significantly affected by the number of germinants (or survivors) in each replicate population, i.e plant density (p = 1.03e-11, Table 2, Spearman coefficient r = -0.30, p = 3.7e-07, S2 Fig). This
PLOS ONE | https://doi.org/10.1371/journal.pone.0178990 June 12, 2017
5 / 17
Temporal fitness fluctuations in experimental A. thaliana populations
Table 1. Description of length and climatic differences between plantings and mean fruit production per plant for each background. Total number of days of rain during the planting excludes the days where temperature was below 4˚C. Cumulative photo-thermal units (PTU, expressed in h.˚C) were calculated as in Brachi et al. 2010 for the mean germination day and the mean flowering day for each planting. Planting
1
2
Duration (days)
3
4
5
208
88
280
126
79
44
107
64
52
Cumulative PTU until germination
2944
7349
5369
12608
2316
Cumulative PTU from germination to flowering
Number of days with rain (temp. above 4˚C)
202
4566
6364
9462
11387
4550
Mean Fruit Number Col-0
136
333
1139
382
34
Mean Fruit Number C24
87
474
17
308
NA
https://doi.org/10.1371/journal.pone.0178990.t001
correlation, however, was present only in experimental plots in which germination and survival rates were high, especially plantings 2, 3 and 5 (S2 Fig). Focusing on planting 2, where both backgrounds could be compared, the decrease of silique production associated with increased plant density was only effective for the Col-0 background (S2 Fig). The C24 background, instead, did not yield high density because of a lower germination rate, especially in sand for the planting initiated in the summer (not shown). In the remaining of the analysis, plant density was included as a cofactor, so that the genetic and environmental effect reported below are independent of population density. The largest part of variance was explained by variation across plantings (36% of the variance, p F) 5.25E-10 ***
45.9537 (1,183)
1.91E-10 ***
169.4389 (4,179)
2.20E-16 ***
Chr4 Genotype
0.4167 (1,178)
0.519465
Soil Composition:Planting
4.7902 (4,174)
0.001097 **
Planting:Chr4 Genotype
3.1058 (4,170)
0.016909 *
Signif. codes: 0 ’***’ 0.001 ’**’ 0.01 ’*’ 0.05 ’.’ 0.1 ’ ’ 1 –Residual deviance: 172.56 for 170 degrees of freedom. Dispersion parameter for Negative Binomial (r = 2.8) family taken to be 0.94596. GLM final formula: formula = (silique number + 1) ~ Plant density + Soil Composition + Planting + Chr4 Genotype + Soil Composition: Planting + Planting: Chr4 Genotype. https://doi.org/10.1371/journal.pone.0178990.t003
(F = 9.7, p