Atmospheric Chemistry and Physics Discussions
|
This discussion paper is/has been under review for the journal Atmospheric Chemistry and Physics (ACP). Please refer to the corresponding final paper in ACP if available.
1
3
2
1,4
1
Correspondence to: D. E. Heard (
[email protected]) Published by Copernicus Publications on behalf of the European Geosciences Union.
|
4533
Discussion Paper
Received: 24 January 2011 – Accepted: 27 January 2011 – Published: 8 February 2011
|
School of Chemistry, University of Leeds, LS2 9JT, UK 2 Institute of Environmental Physics, University of Heidelberg, Germany 3 School of Geography, Earth and Environmental Sciences, University of Birmingham, B15 2TT, UK 4 National Centre for Atmospheric Science, University of Leeds, Leeds, LS2 9JT, UK * now at: School of Engineering and Applied Sciences, Harvard University, MA, USA
,
Discussion Paper
2
ACPD 11, 4533–4568, 2011
Temporal variability and spatial distribution of IO R. Commane et al.
Title Page Abstract
Introduction
Conclusions
References
Tables
Figures
J
I
J
I
Back
Close
|
1,*
Discussion Paper
Iodine monoxide at a clean marine coastal site: observations of high frequency variations and inhomogeneous distributions R. Commane , K. Seitz , C. S. E. Bale , W. J. Bloss , J. Buxmann , T. Ingham 2 2 1,4 ¨ U. Platt , D. Pohler , and D. E. Heard
Discussion Paper
Atmos. Chem. Phys. Discuss., 11, 4533–4568, 2011 www.atmos-chem-phys-discuss.net/11/4533/2011/ doi:10.5194/acpd-11-4533-2011 © Author(s) 2011. CC Attribution 3.0 License.
Full Screen / Esc
Printer-friendly Version Interactive Discussion
5
Discussion Paper |
4534
|
25
Discussion Paper
20
The important role of iodine chemistry in the marine boundary layer has been highlighted by a number of studies (e.g., Alicke et al., 1999; O’Dowd et al., 2002). The iodine monoxide (IO) radical is involved in the catalytic destruction of ozone in the marine boundary layer (Davis et al., 1996). This destruction can be initiated by the reaction of IO with itself or BrO as well as with the HO2 radical or NO2 . The reaction of IO with HO2 alters the OH/HO2 ratio (Bloss et al., 2005) and affects the oxidising capacity of the atmosphere, both directly (through HOx ) or indirectly through impacts ¨ a¨ et al., 2002) and on O3 and NOx . Iodine has been found in ultrafine particles (Makel observations in the MBL have shown peaks in gas phase I2 concentrations coincide with new particle bursts (O’Dowd et al., 2002; Sellegri et al., 2005). The self-reaction of
ACPD 11, 4533–4568, 2011
Temporal variability and spatial distribution of IO R. Commane et al.
Title Page Abstract
Introduction
Conclusions
References
Tables
Figures
J
I
J
I
Back
Close
|
1 Introduction
Discussion Paper
15
|
10
The first in situ point observations of iodine monoxide (IO) at a clean marine site were made using a laser-induced fluorescence instrument deployed at Mace Head, Ireland in August 2007. IO mixing ratios of up to 49.8 pptv (1 s) were observed at day-time low tide, well in excess of previous observed spatially-averaged maxima. A strong anti-correlation of IO with tide height was evident and the high time resolution of the observations showed IO peaked in the hour after low tide. The temporal delay in IO peak compared to low tide has not been observed previously but coincides with the time of peak aerosol number previously observed at Mace Head. A long path-differential optical absorption spectroscopy instrument (with a 2 × 6.8 km folded path across Roundstone Bay) was also based at the site for 3 days during the point measurement observation period. Both instruments show similar temporal trends but the point measurements of IO are a factor of ∼6–10 times greater than the spatially averaged IO mixing ratios, providing empirical evidence of the presence of inhomogeneities in the IO mixing ratio near the intertidal region.
Discussion Paper
Abstract
Full Screen / Esc
Printer-friendly Version Interactive Discussion
hν
IO −→ I + O
| Discussion Paper
25
|
In coastal areas, iodine atoms can be formed by the photolysis of molecular iodine or iodocarbons, which have been emitted from macroalgae in the intertidal zone and high concentrations of iodine atoms have been directly measured at a coastal site (Bale et al., 2008). IO was first observed at the site Mace Head Atmospheric Research Station (MH), located on the west coast of Ireland, in 1997 by Long Path Differential Optical Absorption Spectroscopy (LP-DOAS) (Alicke et al., 1999) and has since been measured a number of times, with varying concentrations of IO observed, up to a maximum of 7 pptv (Saiz-Lopez et al., 2006a). These previous spatially-averaged observations of IO at MHARS have provided important information about the role of macroalgae in initiating iodine chemistry through the emission of molecular iodine (e.g., McFiggans et al., 2004) and, to a lesser extent, iodocarbons (e.g., Carpenter et al., 2001). These studies also linked iodine species to new particle formation (O’Dowd et al., 2002) and initiated chamber studies into the role of specific macroalgae in the emission of iodine (Bale et al., 2008; Dixneuf et al., 2009; Ball et al., 2010). Most field observations of IO have been made by LP-DOAS instruments, which use path lengths of several kilometres to improve the LP-DOAS sensitivity. This significant 4535
Discussion Paper
20
(R2)
ACPD 11, 4533–4568, 2011
Temporal variability and spatial distribution of IO R. Commane et al.
Title Page Abstract
Introduction
Conclusions
References
Tables
Figures
J
I
J
I
Back
Close
|
15
(R1)
Discussion Paper
I + O3 −→ IO + O2
|
10
Discussion Paper
5
IO is also thought to lead to the formation and growth of these new particles, through the formation of higher iodine oxides (McFiggans et al., 2004; Kaltsoyannis and Plane, 2008). If these new particles grow to form cloud condensation nuclei (CCN), they can influence cloud properties and have an impact on climate (Rosenfeld et al., 2008). Laboratory and modelling studies by Burkholder et al. (2004) suggested point mixing ratios of IO between 50 and 100 pptv were required to explain the particle bursts observed in coastal areas (O’Dowd et al., 2002). IO radicals are formed through the reaction of atomic iodine with ozone. A steady state between IO and I atoms is formed during the day, with the reformation of ozone in the absence of other reactions:
Full Screen / Esc
Printer-friendly Version Interactive Discussion
◦
|
4536
Discussion Paper
25
The Mace Head Atmospheric Research Station (MH) (53.32 N, 9.90 W) is a clean marine site located on the west coast of Ireland (Fig. 1). The research station has been the subject of extensive halogen studies in the past (e.g., Alicke et al., 1999; Saiz-Lopez et al., 2006a) and is described extensively in Heard et al. (2006). Mace Head experiences semi-diurnal tides, with extensive beds of macroalgae exposed in narrow strips along the coast at low tides. A log of the approximate low and high tide times at the site was maintained during August 2007 and the high and low tide times were found to agree well with the tide times predicted for Roundstone Bay (7 km
|
20
◦
Discussion Paper
2.1 Site description
ACPD 11, 4533–4568, 2011
Temporal variability and spatial distribution of IO R. Commane et al.
Title Page Abstract
Introduction
Conclusions
References
Tables
Figures
J
I
J
I
Back
Close
|
2 Instrumentation
Discussion Paper
15
|
10
Discussion Paper
5
spatial averaging can conceal the presence of an inhomogeneous distribution of the target species along the LP-DOAS light-path (Saiz-Lopez et al., 2006a), which can make the interpretation of point observations of short-lived species (e.g. OH and HO2 ) difficult. A factor of 10 increase in the IO concentration observed by LP-DOAS was required to reproduce [HOx ] observed during the North Atlantic Marine Boundary Layer Experiment (NAMBLEX) campaign (Sommariva et al., 2006). A recent LP-DOAS study with various path lengths found similar IO column densities for both a 2 km and 10 km path length above beds of macroalgae, indicating the presence of significant inhomogeneities within the light path (Seitz et al., 2010). We present point observations of IO made using a portable and compact LaserInduced Fluorescence (LIF) instrument developed for the detection of IO. The instrument and calibration method are described. The temporal and tidal related variations of the in situ point observations of IO are discussed and the short-term variability investigated. The point observations of IO are compared to the spatially-averaged IO observations made by the LP-DOAS instrument and the extent of the inhomogeneity of the IO concentrations is examined.
Full Screen / Esc
Printer-friendly Version Interactive Discussion
Discussion Paper
2.2 Laser-induced fluorescence instrument
|
The laser-induced fluorescence (LIF) instrument uses radiation at λ = 444.885 nm (generated by a tunable solid state laser) to excite the (2,0) band of the A2 Π3/2 ← X 2 Π3/2 electronic transition (R1 bandhead), which consists of several overlapping rotational lines (Gravestock et al., 2010). Off-resonance fluorescence in the (2,5) band is detected at λ = 520.3 nm. The instrument is a more compact version of an instrument described in Whalley et al. (2007) and Furneaux et al. (2010) and was constructed around the Leeds aircraft
Discussion Paper
4537
|
25
ACPD 11, 4533–4568, 2011
Temporal variability and spatial distribution of IO R. Commane et al.
Title Page Abstract
Introduction
Conclusions
References
Tables
Figures
J
I
J
I
Back
Close
|
20
Discussion Paper
15
|
10
Discussion Paper
5
north) by the UK Hydrographic Office (UKHO) Poltis program. During the measurement period, the intertidal height in Roundstone Bay varied between 1 m at Neap Tide and 4.5 m at Spring Tide, which corresponds to a horizontal distance of between ∼ 50 m (high tide) and ∼ 100 m (low tide) in front of the site. During the observation period, the wind direction varied from west to north-west, with wind speeds varying from 11 m s−1 ´ to 0.5 m s−1 (data courtesy of B. Kelly, Met Eireann). 24 h back trajectory calculations show this air had travelled at low level over the ocean for most of the previous 24 h. Point measurements of IO were made on eight days between 15 and 30 August 2007 with short breaks in data collection due to restrictions on the deployment of the sampling cell i.e. observations were only possible when the station was attended and were not possible during inclement weather conditions. The instrument was installed in a van located ∼ 5 m north of the site buildings. The portable fluorescence cell was extended 10 m away from the van, towards the sea (upwind), giving it ∼ 5 m clearance in front of the site buildings, approximately 100 m from the low tide line and exposed macroalgae. Simultaneous spatially-averaged measurements were made by the LPDOAS instrument for the final three LIF observation days (28–30 August 2007). The LP-DOAS instrument was located in the site buildings with the light-path passing 5 m behind the LIF fluorescence cell to a retro-reflector located across Roundstone Bay (total path length 13.6 km).
Full Screen / Esc
Printer-friendly Version Interactive Discussion
4538
|
Discussion Paper | Discussion Paper
25
ACPD 11, 4533–4568, 2011
Temporal variability and spatial distribution of IO R. Commane et al.
Title Page Abstract
Introduction
Conclusions
References
Tables
Figures
J
I
J
I
Back
Close
|
20
Discussion Paper
15
|
10
Discussion Paper
5
instrument for OH and HO2 measurements (Commane et al., 2010). Details of the laser excitation and fluorescence spectra, and the photophysical and collisional processes 2 occurring in the A Π3/2 state of IO can be found in Gravestock et al. (2010). Installed on two aircraft racks, with a separate pump set, calibration system and portable fluorescence cell, the instrument was characterised prior to, and calibrated during, deployment at Mace Head. The optical cell is similar in design to that described in Commane et al. (2010), with an extended inlet to reduce solar scattered light. The inlet was pointed vertically upwards and consisted of a 45 mm internal diameter stainless steel cylinder, with a 25 mm internal diameter solid nylon cylinder of 21.5 cm length inserted between a stainless steel cap and base, giving a total length of 33 cm. A maximum of ≈ 5 cts s−1 of solar scattered light was observed within the cell at solar noon. A 0.8 mm pinhole was centered on a flat disc, drawing ambient air into the fluorescence cell at a flow rate of 8.5 slm, giving an cell pressure of ∼ 150 Torr. A Nd:YAG laser (9.1–9.5 W of λ = 532 nm radiation) was used to pump a Ti:sapphire laser cavity, generating up to 1.1 W of λ ≈ 890 nm radiation (∼ 35 ns pulse width −1 (FWHM), 0.065 cm laser linewidth). The incident angle of the intra-cavity diffraction grating was tilted using a stepper motor to vary the wavelength. The λ ≈ 890 nm light was passed through a cerium lithium borate (CLBO) doubling crystal producing up to 100 mW of blue light at λ ≈ 445 nm. The beam was split using dielectric coated beam splitting plates on a fibre launcher contained within the laser casing and 96% of the λ ≈ 445 nm light was delivered to the fibre with ∼ 75% transmitted to the IO fluorescence cell through the 15 m fibre optic cable. The remaining λ ≈ 445 nm light (4%) was delivered to a photodiode shielded from ambient light, which was calibrated to the laser power exiting the cell, allowing continuous measurement of laser power. A wavemeter (Coherent Wavemaster, resolution ± 0.001 nm, accuracy ± 0.005 nm) was used to determine the wavelength of detected light. Laser radiation was delivered to the cell through a 15 m fibre optic cable (Oz Optics) and the light exiting the fibre was collimated and focussed through a baffled side-arm
Full Screen / Esc
Printer-friendly Version Interactive Discussion
(1)
CIO
|
4539
Discussion Paper
SigIO
|
[IO] =
Discussion Paper
25
ACPD 11, 4533–4568, 2011
Temporal variability and spatial distribution of IO R. Commane et al.
Title Page Abstract
Introduction
Conclusions
References
Tables
Figures
J
I
J
I
Back
Close
|
20
Discussion Paper
15
|
10
Discussion Paper
5
into the fluorescence region. Fluorescence was detected on an axis perpendicular to both the laser beam and ambient airflow, and passed through a 50.2 mm diameter window (with λ = 521 nm anti-reflection coating), was collimated and filtered by a λ = 521 nm centred interference filter (Barr Associates, 2 nm FWHM, 52% transmission) and focussed through two lenses (50.2 mm diameter, 52 mm focal length, antireflection coated for λ = 521 nm) onto the photocathode of a yellow sensitive channel photomultiplier (CPM) (Perkin Elmer, C993 P). The signal from the CPM was sent to a photon-counting card (Becker and Hickl, MSA 300) in the data-acquisition computer before the signal was processed. The photon-counting card was triggered by a timedtransistor logic (TTL) pulse from the delay generator 50 ns prior to the laser pulse. Photons at λ = 521 nm from the laser focal volume were recorded during two time gates: i) Gate A: a 100 ns wide collection gate centred directly over the laser pulse to −1 −1 collect the LIF signal, laser scattered (∼ 0.8–1 cts s mW ) and solar scattered light −1 (maximum ∼ 5 cts s ) and ii) Gate B: a 1000 ns wide collection gate, delayed 50 µs after the laser pulse to collect the signal due to solar scattered light and CPM dark counts (the latter ∼ 0.01 cts s−1 ). The difference in signal (cts s1 ) between gates A and B is recorded as the 1 s averaged IO fluorescence signal and can be integrated to longer time periods as required. During all field measurements, a 1:1 duty cycle was adopted: the laser wavelength was tuned to the online wavelength (444.887 nm) for 60 s, producing a one minute online point (or 300 000 laser shots), then tuned offline (444.882 nm) for 60 s, producing 60 one second offline points. From these 1 s data, the data were usually averaged to generate a 1 min data point. The signals are normalised for laser power and the mean offline signal is subtracted from the mean online signal −1 −1 to give the laser normalisesd signal (SigIO , cts s mW ). Finally, this signal is divided by the sensitivity to give the IO concentration ([IO], molecule cm−3 ):
Full Screen / Esc
Printer-friendly Version Interactive Discussion
−1
−1
3
2.2.1 IO calibration
N2 O −→ N2 + O( D) 1
(R3) 1
3
The photolysis product O( D) is rapidly quenched to O( P) by N2 O and N2 as well as reacting with N2 O:
R5 O(1 D) + N2 O −→ O(3 P) + N2 O
k
R6 O(1 D) + N2 O −→ products
1
(R5)
Discussion Paper
k
20
(R4)
|
k
R4 O(1 D) + N2 −→ O(3 P) + N2
(R6) 3
The fraction of O( D) quenched to O( P) (Ω) is calculated as: Ω=
kR4 [N2 ] + kR5 [N2 O]
(2) 4540
|
kR4 [N2 ] + kR5 [N2 O] + kR6 [N2 O]
Discussion Paper
hν
ACPD 11, 4533–4568, 2011
Temporal variability and spatial distribution of IO R. Commane et al.
Title Page Abstract
Introduction
Conclusions
References
Tables
Figures
J
I
J
I
Back
Close
|
15
Discussion Paper
10
Laser-induced fluorescence spectroscopy is not an absolute technique and the sensitivity of the instrument to IO must be determined by calibration. A turbulent-flow calibration system was developed to produce known concentrations of IO. The sensitivity of the instrument did not found to vary throughout the measurement period and a sensitivity of 0.039(± 0.001) cts s−1 mW−1 pptv−1 was used for all data analysis. A variable flow of N2 O (BOC, 98% N2 O in N2 -medical grade; ∼ 375 sccm) was mixed with excess CF3 I (Aldrich, 99%) in a 50 slm (standard litres per minute) flow of nitrogen (BOC, OFN) at atmospheric pressure. The gas mixture was passed through a square aluminium tube (1.27 cm × 1.27 cm × 30 cm) and the N2 O in the turbulent flow was photolysed (λ = 184.9 nm) using a mercury lamp to produce a known concentration 1 of O( D):
|
5
Discussion Paper
−1
where CIO is the instrument sensitivity to IO (cts s mW molecule cm ). Using the ambient temperature and pressure recorded during the IO measurement period, the IO mixing ratio was then calculated.
Full Screen / Esc
Printer-friendly Version Interactive Discussion
k
R7 O(3 P) + CF3 I −→ IO + CF3
[IO]=[N2 O] σN2 O φIO Ω F184.9nm ∂t
(3)
where σN2 O is the absorption cross-section of N2 O at 184.9 nm (σN2 O = 1.43 ×
10
Discussion Paper |
4541
|
25
Discussion Paper
20
ACPD 11, 4533–4568, 2011
Temporal variability and spatial distribution of IO R. Commane et al.
Title Page Abstract
Introduction
Conclusions
References
Tables
Figures
J
I
J
I
Back
Close
|
15
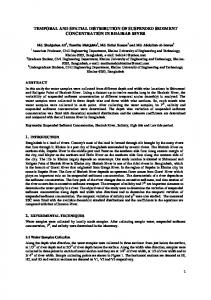
10−19 cm2 molecule−1 , Sander et al., 2006), φIO is the chemical yield of IO from Reaction R7 (φIO = 0.83, Gilles et al., 1996), F184.9nm is the photon flux of the lamp at λ = 184.9 nm and ∂t is the irradiation time. The product F184.9nm ∂t is determined by N2 O actinometry (Commane et al., 2010). Figure 2 shows a calibration over a range of ambient concentrations from 2.2 pptv (5.4 × 10⁷ molecule cm−3 ) to 37.2 pptv (9.2 × 10⁸ molecule cm−3 ), which can be gen16 −3 erated by varying both [N2 O] (1.2–8 × 10 molecule cm ) and the lamp flux at 12 13 −2 −1 λ = 189 nm (9.5 × 10 –2.5 × 10 photon cm s ). The total uncertainty in the IO calibration was found to be 23.5% at 1σ. This is the sum in quadrature of the uncertainty in the laser power (1%), the lamp flux (11%), the absorption cross-section of N2 O (< 1%), the chemical yield of IO from Reaction R7 (11%), the concentration of N2 O (1%) and the reproducibility of the wavemeter to accurately find the excitation wavelength of IO (18%), which was determined from experimental tests with a constant calibration source. The limit of detection (LOD) of the instrument is determined by both the sensitivity to IO (CIO ) and the instrumental noise. For equal online and offline sample sizes with equal variance, the minimum detectable IO signal, IOSigmin , for a given confidence interval (CI) can be calculated:
Discussion Paper
With CF3 I in excess in Reaction R7 ensuring pseudo-first-order conditions, the rate of production of IO was determined by the rate of generation of O(3 P). In the photolysis region, the concentration of IO is given by:
|
5
(R7)
Discussion Paper
3
Quenching to O( P) occurs in less than 1.6 ns and under most conditions, over 98% 1 3 of O( D) is quenched to O( P), which reacts with CF3 I to produce IO:
Full Screen / Esc
Printer-friendly Version Interactive Discussion
IOSigmin = TCI
IOmin =
IOSigmin CIO PIO
(6) −1
−1
mW
−1
pptv ) and PIO is the laser
20
NO2 exhibits a pressure-broadened absorption spectrum in the wavelength range used for IO excitation (λ = 444–445 nm) and fluorescence from NO2 excited in this region includes the wavelength region transmitted through the band-pass interference filter (λ = 521 nm). Tests were conducted on the instrument to determine the effect of NO2 .
|
4542
Discussion Paper
2.2.2 Influence of NO2
|
where CIO is the instrument sensitivity to IO (cts s power in the IO cell (mW).
Discussion Paper
where Slb is the signal due to laser scatter, Ssb is the signal due to solar background and Sdc are the dark counts of the CPM and Slb + Ssb + Sdc is the mean of the sum of these (SBG ). For a 60 s measurement cycle at noon on 29 August, the limit of detection was calculated to be 1.25 pptv (composed of T95% = 2, PIO = 44.8 mW, −1 −1 −1 −1 −1 CIO = 0.039 cts s mW pptv , SBG = 35.7 cts s , Solar Signal = 1.8 cts s , m = 60). IOSigmin is converted into a minimum detectable mixing ratio of IO (pptv) by:
ACPD 11, 4533–4568, 2011
Temporal variability and spatial distribution of IO R. Commane et al.
Title Page Abstract
Introduction
Conclusions
References
Tables
Figures
J
I
J
I
Back
Close
|
15
where TCI is the T value for a given confidence interval (T95% = 2), m is the sample size defined by the sampling frequency and σIO is the standard deviation of the background, which is assumed to be representative of the standard deviation of the online sample. Assuming the background signal obeys Poisson Statistics (Whalley et al., 2007), the standard deviation of the total background signal is defined as the square root of the mean: q σIO = (Slb + Ssb + Sdc ) (5)
Discussion Paper
10
(4)
|
5
2 σ m IO
Discussion Paper
r
Full Screen / Esc
Printer-friendly Version Interactive Discussion
Discussion Paper
5
It was found that no response in signal above the calculated instrumental LOD was observed for NO2 mixing ratios below 500 ppbv, which is far less than the sub-ppbv levels of NO2 observed at clean marine sites. With the addition of over 500 ppbv NO2 , the instrument recorded a response of −0.004 pptv of false IO per ppbv of NO2 , again much less than the instrument uncertainty. Thus, any interference from constant background NO2 mixing ratios would result in only a small underestimate of IO recorded.
|
10
3.1 Temporal variability of IO
|
Figure 4(a) shows a short section of IO data (over 2 min) recorded at 1 s resolution close to low tide with both online and background signal (also recorded at 1 s resolution). Up to 49.7 (± 8.6) pptv of IO was observed over a 1 s integration time at the lowest tide on 29 August, the highest mixing ratio of IO observed at Mace Head to date. Within this 60 s measurement period, the online IO mixing ratio (red) varies between −1 10.0 pptv and 49.7 pptv. The variation in the offline signal (cts s ; black) illustrates the
Discussion Paper
4543
|
25
Discussion Paper
20
11, 4533–4568, 2011
Temporal variability and spatial distribution of IO R. Commane et al.
Title Page Abstract
Introduction
Conclusions
References
Tables
Figures
J
I
J
I
Back
Close
|
15
Point observations of IO were made over eight days in August 2007 and encompassed diel cycles of high and low tides. Figure 3 shows the observed time series of the IO mixing ratio (pptv) for 60 s time integration, where the IO mixing ratio showed a strong dependance on tide height. The highest IO mixing ratio of 29.3 pptv (60 s integration time) was observed at low spring tide around noon on 29 August (spring tide; tidal height range of 4.5 m over 24 h). At the neap tide (tidal height range of 1 m in 24 h), a maximum IO mixing ratio of 4 pptv was observed. The lowest neap tides occurred at dawn and dusk so the photolysis rate of photolabile sources of I atoms will be significantly lower than at mid-day and result in reduced I atom production. It is possible, and indeed probable, that neap tides at mid-day would result in greater IO mixing ratios than observed here.
Discussion Paper
3 Point observations of IO
ACPD
Full Screen / Esc
Printer-friendly Version Interactive Discussion
Kaltsoyannis and Plane (2008) suggest the growth of particles proceeds through higher oxide formation and Furneaux et al. (2010) found that point observations of IO by LIF 4 −3 were correlated with sub-10 nm particle number (up to 15 pptv IO and 18 × 10 cm particle number). Figure 4b shows the 60 s data around spring tide with the standard deviation of the 1 s data within this mean shown as a ± error bar. The variability of the 1 s IO data at daytime low tide is much greater than during the night or high tide and suggests that the nearby macroalgae (a source of halocarbons and molecular iodine) are not steadily emitting IO precursor species, perhaps as a result of wave action or changing wind speeds.
Discussion Paper
20
(R9)
|
25
The tidal variation of IO shows two distinct modes associated with the diel cycle (Fig. 5). During the day, a clear anti-correlation of IO with tide height can be seen and the highest IO mixing ratios were observed around daytime low tide. These daytime data were highly variable on all days with IO mixing ratios between 3 and 29 pptv (60 s integration time) observed at low tide.
|
4544
Discussion Paper
3.2 Diel and tidal dependance of IO
ACPD 11, 4533–4568, 2011
Temporal variability and spatial distribution of IO R. Commane et al.
Title Page Abstract
Introduction
Conclusions
References
Tables
Figures
J
I
J
I
Back
Close
|
15
−→ −→ Ix Oy
Discussion Paper
10
(R8)
|
k
R8 IO + IO −→ OIO + I
Discussion Paper
5
range of instrumental variation expected (converted to an equivalent IO mixing ratio), which is much less than that observed in ambient observations. The offline signal is below the 1 s (2σ) instrumental limit of detection (blue line). IO mixing ratios of up to 50 pptv are significantly greater than any spatially-averaged IO mixing ratio reported to date and provide further evidence of the role of IO in new particle formation. Modeling studies suggested that IO mixing ratios of the order of 50 pptv would be required to explain new particle formation initiated by the IO self reaction (Burkholder et al., 2004):
Full Screen / Esc
Printer-friendly Version Interactive Discussion
Discussion Paper
3.2.1 Temporal offset from low tide
|
10
Discussion Paper
5
Seaweed surveys at Mace Head over various tide heights found that macroalgae are widely distributed in narrow tidal strips a few metres wide directly in front (and upwind) of the research station. A visual inspection of the area in front of the LIF observation point showed no macroalgae were exposed at tide heights greater than ∼ 3 m (high tide). The observed IO mixing ratios were of a similar range during day and night for these high tides heights. This suggest that any open ocean iodine sources were not sufficient to allow detection of IO at the LIF sampling point. At tide heights between 3 and 1 m macroalgae species such as Palmaria palmata, Ascophyllum nodosum and various type of Fucus were present and a maximum IO mixing ratio of 8.2 pptv was observed during the day. At low tides below 1 m, large beds of Laminaria digitata were exposed directly in front of the LIF sampling point and mixing ratios of IO up to 29.3 pptv were observed.
ACPD 11, 4533–4568, 2011
Temporal variability and spatial distribution of IO R. Commane et al.
Title Page Introduction
Conclusions
References
Tables
Figures
J
I
J
I
Back
Close
|
Abstract
20
| Discussion Paper
25
Discussion Paper
15
|
Defining a common time basis based on hours from low tide (Tidal Time) allows the continuous 60 s IO data series on the final three days of measurements (as shown in Fig. 4b) to be considered together. Figure 6 shows the 60 s IO data on this common time basis. Overall the time of the IO enhancement (IO greater than the limit of detection) averages to about five hours around daytime low tide. Although the maximum observed IO occurred before low tide (29 August), overall the mean IO detected in the hour after low tide (13.7 pptv) is greater than before low tide (8.4 pptv) and most of the IO above 12 pptv (peak IO) is concentrated in the hour after low tide. The time delay between low tide and peak IO coincides with the sharp increase in sub-10 nm particle number observed in the hour after low tide during the PARFORCE and BIOFLUX campaigns at Mace Head (O’Dowd and Hoffmann, 2005), suggesting IO plays a key role in new particle formation. Unfortunately, aerosol measurements were not made at Mace Head during the observation period of this study precluding direct correlation with the IO data. At Mweenish Bay, 6 km south of Mace Head Seitz et al. (2010) found that nucleation events coincided with peak IO, while, at a polluted site 4545
Full Screen / Esc
Printer-friendly Version Interactive Discussion
| Discussion Paper |
4546
Discussion Paper
25
ACPD 11, 4533–4568, 2011
Temporal variability and spatial distribution of IO R. Commane et al.
Title Page Abstract
Introduction
Conclusions
References
Tables
Figures
J
I
J
I
Back
Close
|
20
Discussion Paper
15
|
10
Discussion Paper
5
in Roscoff, France, Furneaux et al. (2010) found that ultra fine particles were generally observed around the same time as the highest IO mixing ratios, with the IO mixing ratio showed a temporally broader peak. However with multiple locations of macroalgae and variable wind directions, determining the exact relationship between IO and new particles was difficult during the Roscoff study. At mid-latitude coastal marine boundary layer sites, molecular iodine emission from macroalgae in the intertidal zone has previously been identified as a major source of ¨ IO (McFiggans et al., 2004). Kupper et al. (2008) propose that the ozone-scavenging reactivity of iodide on kelp surfaces at low tide leads to the direct release of molecular iodine from Laminaria into the coastal atmosphere. The emission of iodine from Laminaria has also been linked to dessication and physical agitation (Bale et al., 2008; Ball et al., 2010). Therefore, the time delay between low tide and the peak IO observed here could be attributed to the time required for the Laminaria to dry out and emit I2 . The physical agitation caused by wave motion as the tide returns could contribute to the large variability seen in the 1 s IO data. Although recent chamber studies have suggested iodine emission from Laminaria may also occur in cycles independently of physical agitation (Dixneuf et al., 2009). At times of highest IO, macroalgae were located a maximum of ∼ 100 m upwind of −1 the LIF sampling point and, with mean wind speeds of ∼ 5 m s at this time, the mean chemical processing time between emission and sampling was ∼ 20 s. This suggests that I2 (with a photolysis lifetime of 10 s at mid-day) is the dominant source of I atoms and the major precursor to IO at Mace Head. However, with a prevailing westerly wind −1 and wind speeds of 5–10 m s typical in the area, it is possible that the maximum IO mixing ratio, greatest O3 destruction and peak in particle formation all occur inland from the observation point at Mace Head.
Full Screen / Esc
Printer-friendly Version Interactive Discussion
5
(R10)
k
R11 I + O3 −→ IO + O2 10
3
−1 −1
| Discussion Paper |
4547
Discussion Paper
20
−12
where kR10 = 1.5 × 10 cm molecule s , (Chambers et al., 1992) and kR11 = 1.2 × −12 3 −1 −1 10 cm molecule s at 298 K (Sander et al., 2006). During the LIF measurement period, mixing ratios of NO3 were found to be below the LP-DOAS limit of detection of 4.8 pptv, while a maximum I2 mixing ratio of 65 pptv was observed at night by LP-DOAS. Saiz-Lopez et al. (2006b) showed that the spatiallyaveraged I2 observed by LP-DOAS was concentrated in a short distance over the intertidal area and mixing ratios of greater than 65 pptv are probable and up to 100 pptv I2 is possible Bitter et al. (2005). Given typical ozone mixing ratios of ∼ 30 ppbv, an upper limit of 4.8 pptv of NO3 and an estimated 200 ppt of I2 , the IO formation rate is about −1 0.03 pptv s . This requires a minimum of 40 s to form sufficient IO for detection by the −1 LIF instrument (2σ LIF limit of detection = 1.46 pptv). With windspeeds of 5–10 m s at the site, the transit time of air passing between the macroalgae exposed at low tide to the LIF sampling point is between 10 and 20 s, which is insufficient time for detectable mixing ratios of IO to be formed.
ACPD 11, 4533–4568, 2011
Temporal variability and spatial distribution of IO R. Commane et al.
Title Page Abstract
Introduction
Conclusions
References
Tables
Figures
J
I
J
I
Back
Close
|
15
(R11)
Discussion Paper
k
R10 I2 + NO3 −→ IONO2 + I
|
At night, there is no tidal dependance evident in the IO mixing ratios. Figure 7 shows the probability distribution of the IO mixing ratio observed at night. The observations are distributed around zero, within the mean instrumental limit of detection (2σ), with a slight negative bias (−0.49 pptv). Previous observations of IO at night at Mace Head were associated with high NO3 mixing ratios and the only known IO production pathway at night is through the reaction of I2 with NO3 :
Discussion Paper
3.2.2 Night-time IO
Full Screen / Esc
Printer-friendly Version Interactive Discussion
5
10
Discussion Paper |
4548
|
25
Discussion Paper
20
ACPD 11, 4533–4568, 2011
Temporal variability and spatial distribution of IO R. Commane et al.
Title Page Abstract
Introduction
Conclusions
References
Tables
Figures
J
I
J
I
Back
Close
|
15
Differential Optical Absorption Spectroscopy (DOAS) (Platt and Stutz, 2008) is a well established technique to identify and quantify trace gases by their narrow band absorption structures. The setup of the active long-path DOAS (LP-DOAS) systems used was a further development of the coaxial mirror system introduced by Axelson et al. (1990). A detailed description of the Fibre LP-DOAS can be found in Merten et al. (2009). The light path (6.8 km one-way) crossed Roundstone Bay to Roundstone about 10 m a.s.l. at high tide (Fig. 1), where a reflector consisting of 76 quartz prisms (63 mm diameter) was located. The reflected light was analyzed by a spectrometer (Acton Spectra Pro −1 300, f = 4.1, 1900 gr mm ). The detector used was a 1024 pixel photodiode array detector (type Hamamatsu S3904-1024). IO was measured in the 416–439 nm wavelength range, with a 10 min integration time. For the analysis the software DOASIS (Kraus, 2005) was used to simultaneously fit the different references to the atmospheric spectrum using a non-linear least-squares method (e.g., Stutz and Platt, 1996). In addition, a polynomial of 5th order was included to account for broad band structures due to scattering in the atmosphere. As well as the IO cross section (Spietz et al., 2005), references of NO2 (Voigt et al., 2002), and H2 O (Rothman et al., 2005) were included in the fitting procedure. NO3 was analysed between 618 and 626 nm and 657 and 664 nm and fitted using NO3 (Yokelson et al., 1994) and H2 O vapour cross sections. Over the three days discussed here, NO3 mixing ratios were not observed above the detection limit of 4.8 pptv.
Discussion Paper
4.1 Long path – DOAS instrument
|
For three days around low tide at Mace Head, IO was measured by a long-path Differential Optical Absorption Spectroscopy (LP-DOAS) instrument from the University of Heidelberg (Huang et al., 2010). The wind was consistently arriving at the site from the west to north-west for all three days, allowing direct comparison of spatially-averaged and point measurements of IO.
Discussion Paper
4 Comparison of spatially-averaged and point observations of IO
Full Screen / Esc
Printer-friendly Version Interactive Discussion
5
| Discussion Paper |
4549
Discussion Paper
25
ACPD 11, 4533–4568, 2011
Temporal variability and spatial distribution of IO R. Commane et al.
Title Page Abstract
Introduction
Conclusions
References
Tables
Figures
J
I
J
I
Back
Close
|
20
Discussion Paper
15
|
10
Figure 8 shows the time series of both the LIF and LP-DOAS IO mixing ratios. The general trend of higher IO at daytime low tide is reproduced by both instruments but the LIF IO mixing ratios are much greater than the spatially averaged LP-DOAS IO mixing ratios. Over this 10 min integration time, the maximum IO measured by LP-DOAS was 4.4 pptv. The ratio of IO point measurements to spatially averaged measurements indicates the extent of the spatial distribution throughout the DOAS light beam. This ratio was found to change over the three days of measurements as the tidal structure changed. An increase in IO at low tides is present in the spatially averaged LP-DOAS observations but to much less of an extent than that seen in the point observations. Figure 8c shows the anti-correlation of the LIF/LP-DOAS ratio with tide height. On 28–29 August, the maximum ratio reaches 9.8. Back-trajectory analysis shows the air arriving at the site on these days was north-westerly. On 30 August, the ratio reaches a maximum of 5.5 and coincides with the highest IO observed by LP-DOAS. Back-trajectory analysis showed the wind was more westerly on 30 August, resulting in the air spending less time traveling over the macroalgae beds before being sampled by the LIF instrument. Below tide heights of ∼ 0.3 m, additional Laminaria was also exposed at the retro-reflector end of the LP-DOAS light path, that had not been exposed on previous days. This increased inhomogeneity in IO sources may account for the sharp decrease in the LIF/LP-DOAS ratio observed below these tide heights on 30 August. The point observations of IO presented in this study provide the first direct experimental evidence of the extent of the spatial inhomogeneity of IO along the DOAS light path at Mace Head. Evidence of inhomogeneities in IO have been observed at coastal sites previously. At Mweenish Bay (6 km south of Mace Head), Seitz et al. (2010) found inhomogeneities in IO mixing ratios from LP-DOAS light paths of various lengths positioned directly above beds of macroalgae. Comparison of spatially averaged I2 observed by LP-DOAS and point measurements by CRDS have already highlighted the
Discussion Paper
4.2 Data comparison
Full Screen / Esc
Printer-friendly Version Interactive Discussion
15
The daytime point observations of IO by LIF were found to be anti-correlated with tide and can be quantified as: IO=17.75e−TH/1.08 + 0.02,
Discussion Paper
25
|
where IO is in pptv and TH is tide height in metres. This is a stronger correlation with tide height than seen previously at Mace Head. The LP-DOAS light beam sampled over ocean for more than 90% of the light path so a weaker correlation of IO with tide height −TH/1.29 is expected. Figure 9 shows how a relationship of IO = 3.07e + 0.44 observed by the LP-DOAS during this study compares to a previous study by Carpenter et al. (2001), which found a exponential correlation of IO = 2.6e−TH/1.7 . The LP-DOAS pathlength during Carpenter et al. (2001) was 14.6 km compared to the LP-DOAS pathlength of 13.6 km used here, resulting in greater spatial averaging in the Carpenter 4550
|
20
(7)
Discussion Paper
4.3.1 Evolution of IO with tide height
ACPD 11, 4533–4568, 2011
Temporal variability and spatial distribution of IO R. Commane et al.
Title Page Abstract
Introduction
Conclusions
References
Tables
Figures
J
I
J
I
Back
Close
|
The presence of high concentrations of iodine monoxide leads to a number of effects on the local chemistry, including oxidative capacity and the potential for new particle formation.
Discussion Paper
4.3 Implications of inhomogeneities in IO
|
10
Discussion Paper
5
inhomogeneity in the iodine distribution along the LP-DOAS light path at Mace Head (Saiz-Lopez et al., 2006b). Model calculations suggested that all the I2 was located in a narrow coastal band of less than 10% of the total light-path. Due to a lack of point observations of IO at that time, it was not possible to prove this hypothesis for IO, but local IO mixing ratios of up to 47 pptv were suggested from the I2 /IO ratio observed by LP-DOAS. This predicted inhomogeneity is in good agreement with the point observations of IO presented here. Another study at Roscoff, France found point observations of IO were only a factor of 2–3 higher than spatially averaged IO (Furneaux et al., 2010; Wada et al., 2007). This study will be discussed in detail in Sect. 4.3.1.
Full Screen / Esc
Printer-friendly Version Interactive Discussion
Discussion Paper
4.3.2 Impact on oxidation
|
10
Discussion Paper
5
et al. (2001) study. Both paths were to Roundstone to the north of Mace Head. It is probable that the high mixing ratios of IO observed by the LIF instrument here were previously masked by both the long time (30 min) and spatial averaging (14 km) of LPDOAS measurements. At a polluted site in Roscoff, Northern France (mentioned above), Furneaux et al. (2010) found that point measurements of IO by LIF were only a factor of 2–3 greater than spatially averaged LP-DOAS measurements. The IO by LIF relationship with tide was determined to be IO = 10.05e−TH/2.8 − 0.34. This slightly weaker correlation than observed by LIF at Mace Head may be due to the more dispersed sources of IO and the titration of IO by the higher NOx mixing ratios present at Roscoff. IO may also have been chemically consumed or lost to new particle formation during the long transit time between the widely dispersed macroalgae and the sampling point.
ACPD 11, 4533–4568, 2011
Temporal variability and spatial distribution of IO R. Commane et al.
Title Page Introduction
Conclusions
References
Tables
Figures
J
I
J
I
Back
Close
|
Abstract 1
20
Discussion Paper |
4551
|
25
Discussion Paper
15
During the day, O3 can be photolysed to form O( D) (leading to OH formation) and studies at a coastal site in France found that ozone deposition peaked during low tide (Whitehead et al., 2009). O3 can also be destroyed by reaction with I atoms to form IO (Reaction R1). The combination of these processes may explain the 5 ppbv reduction in ozone observed around low tide on 30 August 2007 (Fig. 10). It is unlikely that the macroalgae located within 10–20 s transport time of the sampling cell was the source of ozone-depleting iodine, as the reaction of O3 with I atoms to produce IO is too slow for O3 to be appreciably depleted within this time. McFiggans et al. (2004) calculated an O3 depletion rate of 0.1 ppbv h−1 from the self-reaction of 5 pptv of IO. This, while significant, is too slow for the depletion to be observed so close to the iodine emission point. For the greater than 10 pptv of IO observed at the site at low tide (linked to the emission of iodine from macroalgae directly in front of the observation point), O3 destruction is likely to take place significantly downwind and, given the wind direction, inland from the site. This suggests that the ozone depletion
Full Screen / Esc
Printer-friendly Version Interactive Discussion
(R12)
j
R13 HOI + hν −→ OH + I
(R13)
was found to be the dominant HO2 → OH pathway, more than an order of magnitude greater than the normally dominant HO2 + NO→OH + NO2 pathway. The point observations of IO presented here show that mixing ratios of IO greater than 10 pptv are only present at tide heights below 1 m. This suggest that iodine related chemistry dominates the HOx budget at Mace Head during the low tide periods of spring tides.
Discussion Paper |
25
5 Conclusions Point measurements of IO were made at Mace Head Atmospheric Research Station, a clean marine site on the west coast of Ireland. IO was found to be highly variable, with up to 49.8 pptv IO observed (1 s). IO showed a strong anti-correlation with daytime low tide and the associated local macroalgae exposure. IO peaked in the hour after low tide, an offset which may be due to the time required for dessication and oxidative
|
4552
Discussion Paper
20
ACPD 11, 4533–4568, 2011
Temporal variability and spatial distribution of IO R. Commane et al.
Title Page Abstract
Introduction
Conclusions
References
Tables
Figures
J
I
J
I
Back
Close
|
15
Discussion Paper
k
R12 IO + HO2 −→ HOI
|
10
Discussion Paper
5
observed here may be the result of iodine emission from macroalgae beds located further away. Indeed, back-trajectory calculations of the path of the airmass arriving at the site show that the air spent significant time travelling along the coast to the northwest of the site, where large macroalgae beds are located. Models of fast photochemistry at Mace Head have highlighted the impact of halogens on HOx . Sommariva et al. (2006) used an in situ box model to show that observed HO2 could be reproduced by increasing the maximum spatially-averaged IO concentrations observed by an order of magnitude. In the presence of 50 ppt IO, the modelled HO2 concentration was reduced by 50% and the modelled OH increased by 30%, in close agreement with observed values. The formation (Reaction R12) and photolysis of HOI (Reaction R13):
Full Screen / Esc
Printer-friendly Version Interactive Discussion
| Discussion Paper
10
Discussion Paper
5
stressing of macroalgae, as well as mechanical agitation from returning waves. This is consistent with previous aerosol observations, which saw a peak in < 10 nm particle number in the hour after low tide. No IO mixing ratios above the instrumental limit of detection were observed at night. A comparison of spatially-averaged long-path Differential Optical Absorption Spectroscopy (LP-DOAS) observations of IO with point observations of IO by LIF showed similar temporal trends. However LP-DOAS reported a factor of between 6 and 10 times less than the LIF observations of IO, consistent with the assumption of inhomogeneities of IO along the LP-DOAS light-path used to explain previous radical point measurements. Overall the observations presented here found that coastal areas influenced by macroalgae contain high concentrations of IO but only for short periods of time (daytime low tide). While these high concentrations of IO may significantly perturb local oxidation chemistry, this large effect will be relatively short-lived.
ACPD 11, 4533–4568, 2011
Temporal variability and spatial distribution of IO R. Commane et al.
Title Page Introduction
Conclusions
References
Tables
Figures
J
I
J
I
Back
Close
|
Abstract
15
| Discussion Paper |
4553
Discussion Paper
20
Acknowledgements. The authors would like to thank the staff at the Mace Head Atmospheric Research Station and NUI Galway, in particular Prof. G. Jennings and Dr. G. Spain. Meteorological and supporting measurements were provided by G. Spain (University of Bristol) and ´ B. Kelly (NUIG/Met Eireann). Support for access to Mace Head was given by the European Community – Research Infrastructure Action under EUSAAR TNA programme. The LP-DOAS deployment was conducted under the MAP Project funded by the European Commission (under FP6 project number 018332). Tidal data reproduced by permission of the Controller of Her Majestys Stationery Office and the UK Hydrographic Office (www.ukho.gov.uk). We are grateful for the expert technical support from the workshops in the School of Chemistry at the University of Leeds.
Full Screen / Esc
Printer-friendly Version Interactive Discussion
5
Discussion Paper |
4554
|
30
Discussion Paper
25
ACPD 11, 4533–4568, 2011
Temporal variability and spatial distribution of IO R. Commane et al.
Title Page Abstract
Introduction
Conclusions
References
Tables
Figures
J
I
J
I
Back
Close
|
20
Discussion Paper
15
|
10
Alicke, B., Hebestreit, K., Stutz, J., and Platt, U.: Iodine oxide in the marine boundary layer, Nature, 397, 572–573, 1999. 4534, 4535, 4536 Axelson, H., Galle, B., Gustavson, K., Ragnarsson, P., and Rudin, M.: A transmitting/receiving telescope for DOAS-measurements using retroreflektor technique, Techn. Dig. S., 4, 641— 644, 1990. 4548 Bale, C. S. E., Ingham, T., Commane, R., Heard, D. E., and Bloss, W. J.: Novel measurements of atmospheric iodine species by resonance fluorescence, J. Atmos. Chem., 60, 51–70, doi:10.1007/s10874-008-9108-z, http://www.springerlink.com/content/ k6j323266406772j, 2008. 4535, 4546 Ball, S. M., Hollingsworth, A. M., Humbles, J., Leblanc, C., Potin, P., and McFiggans, G.: Spectroscopic studies of molecular iodine emitted into the gas phase by seaweed, Atmos. Chem. Phys., 10, 6237–6254, doi:10.5194/acp-10-6237-2010, 2010. 4535, 4546 Bitter, M., Ball, S. M., Povey, I. M., and Jones, R. L.: A broadband cavity ringdown spectrometer for in-situ measurements of atmospheric trace gases, Atmos. Chem. Phys., 5, 2547–2560, doi:10.5194/acp-5-2547-2005, 2005. 4547 Bloss, W. J., Lee, J. D., Johnson, G. P., Sommariva, R., Heard, D. E., Saiz-Lopez, A., Plane, J. M. C., McFiggans, G., Coe, H., Flynn, M., Williams, P., Rickard, A. R., and Fleming, Z. L.: Impact of halogen monoxide chemistry upon boundary layer OH and HO2 concentrations at a coastal site, Geophys. Res. Lett., 32, L06814, doi:10.1029/2004GL022084, 2005. 4534 Burkholder, J. B., Curtius, J., Ravishankara, A. R., and Lovejoy, E. R.: Laboratory studies of the homogeneous nucleation of iodine oxides, Atmos. Chem. Phys., 4, 19–34, doi:10.5194/acp4-19-2004, 2004. 4535, 4544 Carpenter, L. J., Hebestreit, K., Platt, U., and Liss, P. S.: Coastal zone production of IO precursors: a 2-dimensional study, Atmos. Chem. Phys., 1, 9–18, doi:10.5194/acp-1-9-2001, 2001. 4535, 4550, 4567 Chambers, R. M., Heard, A. C., and Wayne, R. P.: Inorganic gas-phase reactions of the nitrate radical: iodine + nitrate radical and iodine atom + nitrate radical, J. Phys. Chem., 96, 3321– 3331, doi:10.1021/j100187a028, 1992. 4547 Commane, R., Floquet, C. F. A., Ingham, T., Stone, D., Evans, M. J., and Heard, D. E.: Observations of OH and HO2 radicals over West Africa, Atmos. Chem. Phys., 10, 8783–8801,
Discussion Paper
References
Full Screen / Esc
Printer-friendly Version Interactive Discussion
4555
|
| Discussion Paper
30
Discussion Paper
25
ACPD 11, 4533–4568, 2011
Temporal variability and spatial distribution of IO R. Commane et al.
Title Page Abstract
Introduction
Conclusions
References
Tables
Figures
J
I
J
I
Back
Close
|
20
Discussion Paper
15
|
10
Discussion Paper
5
doi:10.5194/acp-10-8783-2010, 2010. Davis, D., Crawford, J., Liu, S., McKeen, S., Bandy, A., Rowland, D. T. F., and Blake, D.: Potential impact of iodine on tropospheric levels of ozone; other critical oxidants, J. Geophys. Res.Atmos., 101, 2135–2147, 1996. 4538, 4541 4534 Dixneuf, S., Ruth, A. A., Vaughan, S., Varma, R. M., and Orphal, J.: The time dependence of molecular iodine emission from Laminaria digitata, Atmos. Chem. Phys., 9, 823–829, doi:10.5194/acp-9-823-2009, 2009. 4535, 4546 Furneaux, K. L., Whalley, L. K., Heard, D. E., Atkinson, H. M., Bloss, W. J., Flynn, M. J., Gallagher, M. W., Ingham, T., Kramer, L., Lee, J. D., Leigh, R., McFiggans, G. B., Mahajan, A. S., Monks, P. S., Oetjen, H., Plane, J. M. C., and Whitehead, J. D.: Measurements of iodine monoxide at a semi polluted coastal location, Atmos. Chem. Phys., 10, 3645–3663, doi:10.5194/acp-10-3645-2010, 2010. 4537, 4544, 4546, 4550, 4551, 4567 Gilles, M. K., Turnipseed, A. A., Talukdar, R. K., Rudich, Y., Villalta, P. W., Huey, L. G., 3 Burkholder, J. B., and Ravishankara, A. R.: Reactions of O( P) with alkyl iodides: rate coefficients and reaction products, J. Phys. Chem., 100, 14005–14015, 1996. 4541 Gravestock, T. J., Blitz, M. A., and Heard, D. E.: A laser induced fluorescence study relating to physical properties of the iodine monoxide radical, Phys. Chem. Chem. Phys., 4, 823–834, 2010. 4537, 4538 Heard, D. E., Read, K. A., Methven, J., Al-Haider, S., Bloss, W. J., Johnson, G. P., Pilling, M. J., Seakins, P. W., Smith, S. C., Sommariva, R., Stanton, J. C., Still, T. J., Ingham, T., Brooks, B., De Leeuw, G., Jackson, A. V., McQuaid, J. B., Morgan, R., Smith, M. H., Carpenter, L. J., Carslaw, N., Hamilton, J., Hopkins, J. R., Lee, J. D., Lewis, A. C., Purvis, R. M., Wevill, D. J., Brough, N., Green, T., Mills, G., Penkett, S. A., Plane, J. M. C., Saiz-Lopez, A., Worton, D., Monks, P. S., Fleming, Z., Rickard, A. R., Alfarra, M. R., Allan, J. D., Bower, K., Coe, H., Cubison, M., Flynn, M., McFiggans, G., Gallagher, M., Norton, E. G., O’Dowd, C. D., Shillito, J., Topping, D., Vaughan, G., Williams, P., Bitter, M., Ball, S. M., Jones, R. L., Povey, I. M., O’Doherty, S., Simmonds, P. G., Allen, A., Kinnersley, R. P., Beddows, D. C. S., Dall’Osto, M., Harrison, R. M., Donovan, R. J., Heal, M. R., Jennings, S. G., Noone, C., and Spain, G.: The North Atlantic Marine Boundary Layer Experiment(NAMBLEX). Overview of the campaign held at Mace Head, Ireland, in summer 2002, Atmos. Chem. Phys., 6, 2241–2272, doi:10.5194/acp-6-2241-2006, 2006. 4536 ¨ Huang, R.-J., Seitz, K., Buxmann, J., Pohler, D., Hornsby, K. E., Carpenter, L. J., Platt, U., and
Full Screen / Esc
Printer-friendly Version Interactive Discussion
4556
|
| Discussion Paper
30
Discussion Paper
25
ACPD 11, 4533–4568, 2011
Temporal variability and spatial distribution of IO R. Commane et al.
Title Page Abstract
Introduction
Conclusions
References
Tables
Figures
J
I
J
I
Back
Close
|
20
Discussion Paper
15
|
10
Discussion Paper
5
Hoffmann, T.: In situ measurements of molecular iodine in the marine boundary layer: the link to macroalgae and the implications for O3 , IO, OIO and NOx , Atmos. Chem. Phys., 10, 4823–4833, doi:10.5194/acp-10-4823-2010, 2010. 4548 Kaltsoyannis, N. and Plane, J. M. C.: Quantum chemical calculations on a selection of iodinecontaining species (IO, OIO, INO3 , (IO)2 , I2 O3 , I2 O4 and I2 O5 ) of importance in the atmosphere, Phys. Chem. Chem. Phys., 10, 1723–1733, doi:10.1039/b715687c, 2008. 4535, 4544 Kraus, S.: DOASIS: a framework design for DOAS, Ph.D. thesis, Combined Faculties for Mathematics and for Computer Science, University of Mannheim, 2005. 4548 ¨ Kupper, F. C., Carpenter, L. J., McFiggans, G. B., Palmer, C. J., Waite, T. J., Boneberg, E.-M., Woitsch, S., Weiller, M., Abela, R., Grolimund, D., Potin, P., Butler, A., Luther, G. W., Kroneck, P. M. H., Meyer-Klaucke, W., and Feiters, M. C.: Iodide accumulation provides kelp with an inorganic antioxidant impacting atmospheric chemistry, P. Natl. Acad. Sci. USA, 105, 6954–6958, doi:10.1073/pnas.0709959105, http://www.pnas.org/content/105/19/6954. abstract, 2008. 4546 ¨ a, ¨ J. M., Hoffmann, T., Holzke, C., Vakev ¨ ¨ M., Suni, T., Mattila, T., Aalto, P. P., Tapper, U., Makel a, Kauppinen, E. I., and O’Dowd, C. D.: Biogenic iodine emissions and identification of endproducts in coastal ultrafine particles during nucleation bursts, J. Geophys. Res., 107, 8110, doi:10.1029/2001JD000580, 2002. 4534 Merten, A., Tschritter, J., and Platt, U.: Novel design of DOAS-long-path telescopes based on fiber optics, Appl. Optics, in press, 2009. 4548 McFiggans, G., Coe, H., Burgess, R., Allan, J., Cubison, M., Alfarra, M. R., Saunders, R., Saiz-Lopez, A., Plane, J. M. C., Wevill, D., Carpenter, L., Rickard, A. R., and Monks, P. S.: Direct evidence for coastal iodine particles from Laminaria macroalgae – linkage to emissions of molecular iodine, Atmos. Chem. Phys., 4, 701–713, doi:10.5194/acp-4-701-2004, 2004. 4535, 4546, 4551 O’Dowd, C. D. and Hoffmann, T.: Coastal new particle formation: a review of the current stateof-the-art, Environ. Chem., 2, 245, doi:10.1071/EN05077, 2005. 4545 O’Dowd, C. D., Jimenez, J. L., Bahreini, R., Flagan, R. C., Seinfeld, J. H., Hameri, K., Pirjola, L., Kulmala, M., and Jennings, S. G.: Marine aerosol formation from biogenic emissions, Nature, 417, 632–636, 2002. 4534, 4535 Platt, U. and Stutz, J.: Differential Optical Absorption Spectroscopy, Principles and Applications, Physics of Earth and Space Environments Volume, Springer-Verlag Berlin Heidelberg,
Full Screen / Esc
Printer-friendly Version Interactive Discussion
4557
|
| Discussion Paper
30
Discussion Paper
25
ACPD 11, 4533–4568, 2011
Temporal variability and spatial distribution of IO R. Commane et al.
Title Page Abstract
Introduction
Conclusions
References
Tables
Figures
J
I
J
I
Back
Close
|
20
Discussion Paper
15
|
10
Discussion Paper
5
ISBN:978-3-540-21193-8, 2008. 4548 Rosenfeld, D., Lohmann, U., Raga, G., O’Dowd, C., Kulmala, M., Fuzzi, S., Reissell, A., and Andreae, M.: Flood or drought: how do aerosols affect precipitation?, Science, 321, 1309– 1313, 2008. 4535 Rothman, L. S., Jacquemart, D., Barbe, A., Benner, D., Birk, M., Brown, L. R., Carleer, M. R. C. C. J., Chance, K., Coudert, L. H., Dana, V., Devi, V. M., Flaud, J.-M., Gamache, R. R., Goldman, R., Hartmann, J.-M., Jucks, K. W., Maki, A. G., Mandin, J.Y., Massie, S. T., Orphal, J., Perrin, A., Rinsland, C. P., Smith, M. A. H., Tennyson, J., Tolchenov, R. N., Toth, R., Auwera, J. V., Varanasi, P., and Wagner, G.: The HITRAN 2004 molecular spectroscopic database, J. Quant. Spectrosc. Ra., 96, 139–204, 2005. 4548 Saiz-Lopez, A., Shillito, J. A., Coe, H., and Plane, J. M. C.: Measurements and modelling of I2 , IO, OIO, BrO and NO3 in the mid-latitude marine boundary layer, Atmos. Chem. Phys., 6, 1513–1528, doi:10.5194/acp-6-1513-2006, 2006a. 4535, 4536 Saiz-Lopez, A., Plane, J. M. C., McFiggans, G., Williams, P. I., Ball, S. M., Bitter, M., Jones, R. L., Hongwei, C., and Hoffmann, T.: Modelling molecular iodine emissions in a coastal marine environment: the link to new particle formation, Atmos. Chem. Phys., 6, 883–895, doi:10.5194/acp-6-883-2006, 2006b. 4547, 4550 Sander, S. P., Friedl, R. R., Golden, D. M., Kurylo, M. J., Moortgat, C. K., Keller-Rudek, H., Wine, P. H., Ravishankara, A. R., Kolb, C. E., Molina, M. J., Finlayson-Pitts, B. J., Orkin, V. L., and Huie, R. E.: Chemical kinetics and photochemical data for use in stratospheric studies, Evaluation number 15, NASA Jet Propulsion Laboratory, Publication 06-2, 2006. 4541, 4547 ¨ Seitz, K., Buxmann, J., Pohler, D., Sommer, T., Tschritter, J., Neary, T., O’Dowd, C., and Platt, U.: The spatial distribution of the reactive iodine species IO from simultaneous active and passive DOAS observations, Atmos. Chem. Phys., 10, 2117–2128, doi:10.5194/acp-102117-2010, 2010. 4536, 4545, 4549 Sellegri, K., Yoon, Y. J., Jennings, S. G., O’Dowd, C. D., Pirjola, L., Cautenet, S., Chen, H., and Hoffmann, T.: Quantification of Coastal New Ultra-Fine Particles Formation from In situ and Chamber Measurements during the BIOFLUX Campaign, Environ. Chem., 2(4), 260-270, doi:10.1071/EN05074, 2005. 4534 Sommariva, R., Bloss, W. J., Brough, N., Carslaw, N., Flynn, M., Haggerstone, A.-L., Heard, D. E., Hopkins, J. R., Lee, J. D., Lewis, A. C., McFiggans, G., Monks, P. S., Penkett, S. A., Pilling, M. J., Plane, J. M. C., Read, K. A., Saiz-Lopez, A., Rickard, A. R., and Williams, P. I.: OH and HO2 chemistry during NAMBLEX: roles of oxygenates, halogen ox-
Full Screen / Esc
Printer-friendly Version Interactive Discussion
Discussion Paper | Discussion Paper |
4558
ACPD 11, 4533–4568, 2011
Temporal variability and spatial distribution of IO R. Commane et al.
Title Page Abstract
Introduction
Conclusions
References
Tables
Figures
J
I
J
I
Back
Close
|
20
Discussion Paper
15
|
10
Discussion Paper
5
ides and heterogeneous uptake, Atmos. Chem. Phys., 6, 1135–1153, doi:10.5194/acp-61135-2006, 2006. 4536, 4552 Spietz, P., Gomez-Martin, J., and Burrows, J. P.: Spectroscopic studies of the I2 /O3 photochemistry. Part 2. Improved spectra of iodine oxides and analysis of the IO absorption spectrum, J. Photoch. Photobio. A, 176, 50–67, 2005. 4548 Stutz, J. and Platt, U.: Numerical analysis and estimation of the statistical error of differential optical absorption spectroscopy measurements with least-squares methods, Appl. Optics, 35, 6041–6053, 1996. 4548 Voigt, S., Orphal, J., and Burrows, J. P.: The temperature and pressure dependence of the absorption cross-sections of NO2 in the 250–800 nm region measured by Fourier-transform spectroscopy, J. Photoch. Photobio. A, 149, 1–7, 2002. 4548 Wada, R., Beames, J. M., and Orr-Ewing, A. J.: Measurement of IO radical concentrations in the marine boundary layer using a cavity ring-down spectrometer, J. Atmos. Chem., 58, 69–87, 2007. 4550 Whitehead, J. D., McFiggans, G. B., Gallagher, M. W., and Flynn, M. J.: Direct linkage between tidally driven coastal ozone deposition fluxes, particle emission fluxes, and subsequent CCN formation, J. Geophys. Res., 36, L04806, doi:10.1029/2008GL035969, 2009. 4551 Whalley, L. K., Furneaux, K. L., Gravestock, T., Atkinson, H. M., Bale, C. S. E., Ingham, T., Bloss, W. J., and Heard, D. E.: Detection of iodine monoxide radicals in the marine boundary layer using laser induced fluorescence spectroscopy, J. Atmos. Chem., 58, 19–39, 2007. 4537, 4542 Yokelson, R. J., Burkholder, J. B., Fox, R. W., Talukdar, R. K., and Ravishankara, A. R.: Temperature dependence of the NO3 absorption spectrum, J. Phys. Chem., 98, 13144–13150, 1994. 4548
Full Screen / Esc
Printer-friendly Version Interactive Discussion
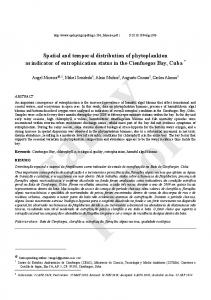
LP-‐DOAS light path
6.8 km
LP-‐DOAS retro-‐reflector
Discussion Paper
LP-‐DOAS LIF Sample light source & spectrometer Point
|
Low Tide
Roundstone
Laminaria digitata, L. saccharina
Laminaria hyperborea
Discussion Paper
6.8 km
| |
4559
Discussion Paper
Fig. 1. (Top): Schematic representation of the position of the in situ LIF sampling point and LP-DOAS light path. Extensive Laminaria beds were observed in the inter-tidal areas under the LP-DOAS light path. (Bottom): Map of Mace Head showing the 6.8 km LP-DOAS light path between Mace Head and Roundstone.
11, 4533–4568, 2011
Temporal variability and spatial distribution of IO R. Commane et al.
Title Page Abstract
Introduction
Conclusions
References
Tables
Figures
J
I
J
I
Back
Close
|
Mixture: Ascophyllum nodosum, Palmaria palmata, Fucus vesiculous, F. serratus, F. spiralis, etc.
Discussion Paper
Mace Head
ACPD
Full Screen / Esc
Printer-friendly Version Interactive Discussion
Discussion Paper | Discussion Paper
1.2 0.8 0.4
11, 4533–4568, 2011
Temporal variability and spatial distribution of IO R. Commane et al.
Title Page Abstract
Introduction
Conclusions
References
Tables
Figures
J
I
J
I
Back
Close
|
IO Signal / cts s
-1
mW
-1
1.6
ACPD
0
10
20 IO / pptv
30
40
Fig. 2. Calibration of IO for mixing ratios between 2.2 and 37.2 pptv. From this fit, the sensitivity −1 −1 −1 of the instrument (CIO ) is 0.039 (± 0.001) cts s mW pptv , with a slight negative intercept (−0.002(± 0.01) cts s−1 mW−1 ), R = 0.999.
Discussion Paper
0.0
| Discussion Paper |
4560
Full Screen / Esc
Printer-friendly Version Interactive Discussion
30
25
25
20
15
|
15
10
10
5
5
0
0
227.5
228.0 DOY
228.5
233
234
235 DOY
236
237
30
Discussion Paper
IO / pptv
20
227.0
Discussion Paper
30
25
ACPD 11, 4533–4568, 2011
Temporal variability and spatial distribution of IO R. Commane et al.
Title Page Introduction
Conclusions
References
Tables
Figures
J
I
J
I
Back
Close
|
Abstract
15 10 5 0 239
240
241 DOY
242
243
Discussion Paper
IO / pptv
20
| |
4561
Discussion Paper
Fig. 3. IO mixing ratio (pptv) observed by LIF for a 60 s time integration period (black) for the Day of Year (DOY) in 2007; IO instrument 60 s limit of detection (∼ 1.4 pptv at 2σ) (red); predicted tide height at Roundstone Bay (blue) scaled to fit the graph. Shaded areas indicate night-time observations. Data were collected between 15 (DOY 227) and 30 August (DOY 242) 2007.
Full Screen / Esc
Printer-friendly Version Interactive Discussion
25
|
IO / pptv
1s IO Online / pptv 1s IO Offline / pptv 1s Limit of Detection (2σ)
0 12:00:00
12:00:45
August 29
th
12:01:30
2007
30 10 0 12:00 28/Aug
00:00 29/Aug
12:00
00:00 30/Aug
12:00
Discussion Paper
20
| |
4562
Discussion Paper
Fig. 4. (a) 1 s IO mixing ratio (pptv) (red) at noon on 29 August (DOY 241) in 2007. The 1 s background signal converted to an equivalent IO mixing ratio is indicated as “offline” and shown in black. The 1 s limit of detection (2σ) shown in blue. Up to 49.7(± 8.6) pptv IO was observed over this short time scale. (b) 60 s IO mixing ratio (pptv; black) with the standard deviation of the 1s data within the 60 s block average shown as error bars (grey). Tide height is shown as a blue line.
11, 4533–4568, 2011
Temporal variability and spatial distribution of IO R. Commane et al.
Title Page Abstract
Introduction
Conclusions
References
Tables
Figures
J
I
J
I
Back
Close
|
5 4 3 2 1 0
Tide Height / m
(b) 40
Discussion Paper
11:59:15
IO / pptv
Discussion Paper
(a) 50
ACPD
Full Screen / Esc
Printer-friendly Version Interactive Discussion
Discussion Paper |
Day (60s) Night (60s)
IO / pptv
25 20 15 10
Discussion Paper
30
5
|
0
Discussion Paper
0
1
2 3 Tide Height /m
4
|
Fig. 5. IO mixing ratio observed by LIF (60 s integration time) against tide height: day (red), night (black). A clear anti-correlation of IO with tide height can be seen during daylight hours but there is no tidal dependance at night.
Discussion Paper |
4563
ACPD 11, 4533–4568, 2011
Temporal variability and spatial distribution of IO R. Commane et al.
Title Page Abstract
Introduction
Conclusions
References
Tables
Figures
J
I
J
I
Back
Close
Full Screen / Esc
Printer-friendly Version Interactive Discussion
Discussion Paper |
30
Discussion Paper
IO / pptv
25 20
Pre-Tide
Post-Tide
15 10
ACPD 11, 4533–4568, 2011
Temporal variability and spatial distribution of IO R. Commane et al.
Title Page Introduction
Conclusions
References
Tables
Figures
J
I
J
I
Back
Close
|
Abstract
0 -10
-5
0 Tidal Time / Hours
5
10
Discussion Paper |
4564
|
Fig. 6. IO mixing ratio as a function of time from daytime low tide for all data between 28– 30 August. Data are separated between before (red) and after (black) daytime low tide. The hour before and after low tide is indicated by black dashed lines.
Discussion Paper
5
Full Screen / Esc
Printer-friendly Version Interactive Discussion
Discussion Paper
60 s integration time Night-time IO data Gaussian Fit 2σ Limit of Detection 1σ Limit of Detection
80 60 40
Discussion Paper
Frequency
|
100
20
11, 4533–4568, 2011
Temporal variability and spatial distribution of IO R. Commane et al.
Title Page Abstract
Introduction
Conclusions
References
Tables
Figures
J
I
J
I
Back
Close
|
-2
-1
0
1
2
3
Night-time IO / pptv Fig. 7. Histogram of night-time IO data (60 s integration time; grey boxes), ± LOD (2σ = 1.4 pptv; red dash-dot lines, 1σ = 0.78 pptv; blue dashed lines). A Gaussian fit to these data (black line) shows a slight negative bias (−0.49 pptv).
Discussion Paper
0 -3
ACPD
| Discussion Paper |
4565
Full Screen / Esc
Printer-friendly Version Interactive Discussion
1.0
1.5 2.0 Tide Height / m
2.5
3.0
DOAS IO / pptv LIF IO / pptv
IO LIF / DOAS
Discussion Paper
0.5
11, 4533–4568, 2011
Temporal variability and spatial distribution of IO R. Commane et al.
Title Page Abstract
Introduction
Conclusions
References
Tables
Figures
J
I
J
I
Back
Close
|
August 28, 29 August 30
10 8 (c) 6 4 2 0 0.0
30
Discussion Paper
29 August 2007
|
28
Discussion Paper
4 3 2 1 0
Tide Height / m
5 4 (a) 3 2 1 0 30 25 (b) 20 15 10 5 0
ACPD
| Fig. 8. Observation of LP-DOAS and LIF IO between 28–30 August. (a) LP-DOAS IO (pptv, red, 10 min), tide height (blue), (b) LIF IO (pptv, black, 1 min), (c) anti-correlation of the LIF/LPDOAS IO ratio with tide height down to 0.3 m. 30 August (red triangles) shows a lower ratio than 28–29 August (black dots). This corresponds to increased IO detected by the LP-DOAS on 30 August.
Discussion Paper
4566
|
Full Screen / Esc
Printer-friendly Version Interactive Discussion
Discussion Paper
Day IO
(60s Observations - This study - LIF)
IO = 10.05 e
20
IO = 3.07 e
IO = 2.6 e
(-TH / 2.8)
- 0.34
(-TH / 1.7) (-TH / 1.29)
IO = 17.75 e
(Furneaux et al. 2010 - LIF) (Carpenter et al. 2001 - DOAS)
+ 0.44
(-TH / 1.08)
+ 0.02
(This study - DOAS) (This study - LIF)
15 10 5
Discussion Paper
25
|
IO / pptv
30
ACPD 11, 4533–4568, 2011
Temporal variability and spatial distribution of IO R. Commane et al.
Title Page Introduction
Conclusions
References
Tables
Figures
J
I
J
I
Back
Close
|
Abstract
0
1
2 Tide Height /m
3
4
Discussion Paper |
4567
|
Fig. 9. IO as a function of tide compared to other studies. Point observations of IO by LIF presented in this study (one minute data: grey points, tidal dependance: yellow triangles), Furneaux et al. (2010) point observations by LIF at Roscoff, France (green points), Carpenter et al. (2001) LP-DOAS observations at Mace Head (red squares), LP-DOAS observations from this study (black diamonds). Point observations of IO (by LIF) show the strongest dependance on tide height.
Discussion Paper
0
Full Screen / Esc
Printer-friendly Version Interactive Discussion
Discussion Paper |
25
4 28 3 26
15 2 24 1 22
0 06:00
0 20 09:00
12:00
15:00
18:00
th
August 30 2007
Fig. 10. Time series of IO and O3 (60 s) and tidal height (m) for 30 August, 2007.
Discussion Paper
5
| Discussion Paper |
4568
11, 4533–4568, 2011
Temporal variability and spatial distribution of IO R. Commane et al.
Title Page Abstract
Introduction
Conclusions
References
Tables
Figures
J
I
J
I
Back
Close
|
10
Tide Height / m
IO / pptv
20
Discussion Paper
5 30
O3 / ppbv
30
ACPD
Full Screen / Esc
Printer-friendly Version Interactive Discussion