CEES Working Paper No. 13
June 1998
Ten Years of Direct Foreign Investment in the Former Soviet Union: A Survey with Special Focus on Kazakhstan.
Klaus E. Meyer
Christina Pind
Center for East European Studies Copenhagen Business School
2
Ten Years of Foreign Direct Investment in the (former) Soviet Union: A Survey with special focus on Kazakhstan1
Klaus E. Meyer Christina Pind
Working Paper #13 Center for East European Studies Copenhagen Business School
June 1998 Abstract This paper reviews the statistical evidence of FDI in the countries of the former Soviet Union for the period 1987 to 1997 taking into account data both from the host countries and from the countries of origin. The main characteristics of this FDI and its variation among the successor states of the Soviet Union are established. The paper gives special attention to Kazakhstan, the second most successful country in attracting FDI. The paper starts with the historical context for foreign investment. Then the current foreign investment inflow is assessed, along with information on the source countries and the sectoral pattern of investments. The paper provides a rich selection and evaluation of data that can form the basis for further research. Furthermore, key motives and obstacles are discussed through a review of survey evidence. On the basis of the evidence, explanations are proposed on why FDI has, for most parts, entered the region far slower than the potential of the region would have suggested.
1 This study has been made possible with the help of many persons who helped us finding the relevant data. Inter alia, we wish to acknowledge Ken Charman, Maiko Miyake, Madina Dushimova and John Wysham. We also thank Niels Mygind, Sergei Sutyrin and participants of the Workshop “Privatisation, Enterprise Development and Change in Business Culture - The Kazakh Case in Perspective”, Almaty, June 1998 for their helpful comments. 3
4
1. Introduction More than 10 years ago, the then Soviet Union created the legal foundations permitting foreign direct investment (FDI) into the hitherto closed Soviet Economy. Since then, the surge of investment flows has repeatedly been reported, but almost as frequently been discredited by alternative sources of data. Since the break-up of the Soviet-Union, the successor state have followed very diverse policies towards foreign investment and consequently the FDI received varies greatly. The Baltic states have received per capita inflows of FDI comparable to those of, e.g. Poland and Czech Republic. Yet most other states of the region received despite occasional success stories minimal amounts of FDI-capital. Even huge potential of the markets and natural resources could not induce potential investors to accept the high investment risk still associated with business in those countries. The evidence of the FDI over the ten-year period is rather incomplete due to inconsistent and changing methods of data collection, and low reliability of some of the important primary sources. Therefore, a clear picture of the trends, even of the total FDI volume, is not available. Based on available empirical evidence, the annual inflow in the early 1990s was estimated to be between US$ 0.5 billion and US$ 1 billion (Meyer 1995, 1998). At that time, McMillan (1994) concluded that due to the “deep political divisions ... and widespread Russian ambivalence toward foreign investment ... a foreign investment boom in Russia is not just around the corner” (1994:51). Since then, however, FDI has accelerated. Official statistics report a major turnaround especially in Kazakhstan and more recently in Russia. Foreign investors now play a substantive role in several sectors in these transition economies, even though the capital stock of FDI is still low. This research has three related objectives. Firstly, we review the statistical evidence of FDI in the countries of the former Soviet Union for the period 1987 to 1997 taking into account data both from the host countries and from the countries of origin. In this working paper, we provide the statistical evidence that we could establish, hoping that it may form a foundation for further research. Secondly, we aim at establishing the main characteristics of this FDI and its variation among the successor states of the Soviet Union. This enables us to see the experience of Kazakhstan, where we were asked to present this research, in perspective to developments across the former Soviet Union. On this basis, we will attempt to explain why FDI has, for most parts, entered the region far slower than the potential of the region would have suggested. 5
The paper is structured as follows: section two outlines the historical context for foreign investment in the Soviet Union. Section three assesses the foreign investment inflow in recent years under special consideration of the quality of the data available. Section four looks at the source countries for FDI, and section five at the sectoral pattern of investments. In section six, the key motives and obstacles are discussed, and section seven offers some economic explanations for the slow growth of FDI in the region. Section eight concludes.
2. Historical Context There has been virtually no FDI in the Soviet Union from the 1930's to the 1980's. However, Russia had attracted considerable FDI prior to World War I. Russian industrial policy succeeded in attracting foreign investment in key industries in the period 1891-1914. At some stage, 91% of all mines were foreign owned, and also the chemicals, metal processing, timber and wood, and textile industry received major foreign investments. Analysts attribute these foreign investors a major contribution to the rapid industrialisation and take-off in economic development that Russia achieved at the turn of the century (Blackwell 1974, Kuznetsov 1994, Swetzer 1996). Most of this foreign involvement came to an end with World War I and the Russian revolution in 1917. In the 1920's, foreign investors were invited in the context of the ‘New Economic Policy’ (1921-26). The Bolshevik government gave a small number of ‘concessions’ that permitted foreign firms to engage in resource extraction projects, notably timber, and to a lesser extent in manufacturing (Sutton 1968, Nove 1970, Gutman 1992, Kuznetsov 1994). The period of experimentation with foreign capital came to an end with Stalin’s rise to power and the creation of a tight system of central planning and state-ownership.2 Foreign investors, motivated by capitalistic profit seeking and taking economic decisions at the level of enterprises could not be integrated into the logic of the central-plan economy. Beyond this, it could have become a Trojan horse for capitalist ideology. Some attempts were undertaken to co-operate with multinationals (see e.g. McMillan 1994), but they mostly failed because of both the ideological conflict and the incompatibility of the decision making systems under plan 2 One of the few companies that maintained its presence, though without expatriate staff, throughout the central-plan period was the Danish Great Nordic Telegraph (Jacobsen 1997). The Soviet authorities had a vital interest in the continuation of telegraph services, and Great Nordic was based in a small country, which was not perceived as a threat (albeit becoming member of NATO). In this way, the only West European Telecommunication Company to stay private during the wave of nationalisation in the 1950s and 1960s remained a business partner of Soviet Russia throughout its existence.
6
and market economy. The decisive break with this isolationist policy came with Michael Gorbachev policy of ‘perestroika’. In January 1987, several decrees were published that opened the Soviet Union to foreign investors. The regulations for FDI were initially rather restrictive, permitting e.g. only investment in minority joint-ventures and constraining profit repatriation, while being ambiguous on many details (Gutman 1992, McMillan 1994). The inherent conflict between the necessities of a central plan system and the economic freedom expected by foreign investors led to a regulatory framework that was not considered attractive by foreign investors. Gradually, the Soviet Union, and later its successor states, move towards a market economy; and the legal framework for foreign investors evolves towards market principles. During 1990-91, the move towards a more flexible exchange rate system and convertible currency, in combination with the increasingly uncertain political and economic conditions in the country, raised the exchange risk associated with foreign investment in the Soviet economy. The "war of laws" (McMillan 1994) between republics and regions in the Soviet Union inhibited foreign investors' ability to judge from which authority to seek guidance and approval. In July 1991 both the Russian Soviet Federated Socialistic Republic3 and Soviet Union simultaneously issued laws on foreign investment consolidating previous existing regulations issued since 1987. However, the laws did not diverge significantly in their underlying principles. Both allowed enterprises to be wholly foreign owned and granted foreign investors the right of access to land and other natural resources. Both guaranteed national treatment to enterprises with foreign capital participation. However, investor response was cautious and results far below expectations. This 1991 legislation is still the foundation for the regulation of FDI in Russia. It has been extended to the three level judicial and legislative system (federal, regional and local) where regional authorities are given great autonomy when it comes to attracting foreign investors. Although most legal barriers to doing business in Russia have been removed, "the absence of sufficiently developed civil, commercial and criminal codes is a major constraint. In addition, high and unstable taxation, the prevalence of violent crime, capital flight and a lag in development of local long-term capital are problems for foreign (and Russian) business. Bureaucratic requirements can be confusing and burdensome to investors and bureaucratic 3 Law on Foreign Investments, signed July 4, 1991 by the Chairman of the Supreme Soviet of the Russian Federated Socialist Republic, Boris Yeltsin. The Russian legislative act was to serve on as the governing law in Russia, following the dissolution of the USSR a few months later (McMillan 1994). 7
discretion may be capricious in awarding tenders or development rights to companies" (US Government 1997, also see Murrell 1996). Foreign ownership of real estate is not permitted everywhere in Russia, and still subject to continuous legal changes. In Kazakhstan, the legal foundations for foreign investment were laid in 1990 by the Supreme Soviet of the then Kazakh Soviet Socialist Republic.4 Foreign investments were permitted, yet the evolving legal framework was considered unsatisfactory by investors because it lacked stability, clarity, consistency and predictable enforcement (Charman 1996a). The new law on foreign investment issued in 1995 aimed to overcome these obstacles by establishing 'national treatment' to investors, and by guaranteeing investors would not be negatively affected by legal changes implemented after the investment. This legal foundation offers one of the most favourable conditions of FDI in the former Soviet Union. However, it does not resolve all concerns by investors because its application in practice remains unclear. Confusion has been caused for instance by contradictory regulations, and by the abolition of tax privileges at the same time (Charman 1996a).
3. Assessment of the Investment Situation Brewer (1994) and Meyer (1995) have reviewed the available data on foreign investment in transition economies and concluded that they all have their respective shortcomings, but jointly may appropriately depict the actual developments. Reliability of data on FDI in post-Soviet countries is inhibited not only by the general problems in defining and measuring FDI, but also by the traditionally low quality of data provided by state statistical offices in the Soviet Union and its successor states.5
4 Law on Foreign Investments, issued on 7th December 1990, amended on 8th April 1993. 5 Improvements are coming slowly as the following news message illustrates: "The director of the State Statistics Committee, Yurii Yurkov, was arrested on 9 June, along with an unspecified number of senior workers in charge of data processing, ITAR TASS reported that ... they were charged with 'systematic distortion of statistical data on big companies, which allowed those companies to evade taxes'. … [They] are accused of manipulating economic data to hide the real output of companies and reduce their tax liability. They are also alleged to have sold classified information about rival companies' performance" [Radio Free Europe, Radio Liberty, Newsline, 9.6.98]. 8
Table 1: FDI in the Soviet Union: Registration Data by capital, in million US$
1987
1988
1989
1990
1991
1992
1993
UNECE(1)
89.3
416,6
1692,2
953.6
2,498.3
...
...
EEIM (2)
…
…
…
400
3,000
18,000
3,200
PlanEcon (3)
43.7
153.7
640.6
480.1
…
…
…
net FDI, balance of payments (4)
-250
502
-250
-700
-200
…
…
…
…
…
-8
17
188
508
PlanEcon (3)
38.6
124.4
453.8
342.7
…
…
…
UNECE (6)
…
…
1249.8
2485.5
…
…
…
1987
1988
1989
1990
1991
1992
1993
23
168
1083
1632
3349
…
…
UNECE (6)
…
…
689
1535
…
…
…
Goskomstat (7)
...
...
...
...
1227
1305
3749
OECD-DAC database (5) Russia only
number of new projects, USSR UNECE(1) Russia only
(1) UNECE Joint-Venture data base used, among other in the World Investment Directory 1992 (p. 115), by World Bank (1992), and by McMillan (1994) who added the 1991 information. (2) East European Investment Magazine, a commercial database used by Bradshaw (1994). Its authors collected information from a variety of newspapers and other sources. (3) PlanEcon database on joint ventures, as cited in World Bank (1992). (4) Net FDI recorded in the balance of payments, as cited in World Bank (1992), p. 9-11. The net outflow is explained in the source by payments made to other CMEA countries to settle their investment in Russian facilities. (5) Balance-of-Payment data reported by the source countries. The OECD-DAC database covers ‘DACcountries’, which covers most OECD countries but not, e.g. Korea and Poland. (6) UNECE Joint Venture database used in the World Investment Directory 1992 (p. 324). Data for Russia and the CIS as a whole are inconsistent for unknown reasons. (7) Goskomstat, as cited by Bradshaw (1994).
For cross-country comparison, the balance of payments data of the IMF may be most suitable because they have, hopefully, been collected applying the common definitions of FDI established by the OECD and the IMF. These data are based on the capital transfers as it is reported in the balance of payments. They may understate actual FDI if a major transfer is made not in cash but ‘in kind’, that is through the provision of machinery or technology. Investors who establish major operations without transferring capital may in this way become underestimated. For instance, Western business service provider such as accountants, banks and engineering consultants are very active in the region (e.g. OECD 1994, Charman 1996). Often they initially follow their multinational customers, but through their interaction with local firms and authorities (e.g.
9
consultancy for privatisation-agencies) they may have a major impact on the evolution of local business. However, such contributions are generally difficult to quantify. A possible alternative measure would be "employees in foreign-controlled firms", but such data are to our knowledge not collected. The number of firms registered is similarly unsatisfactory, such that the capital transfer remains the only suitable available measure for actual FDI.
The Last Years of the Soviet Union For the first years after opening to FDI, even balance-of-payments data are unfortunately not available for the Soviet Union. Some of the successor states have been included in the IMF statistics recently. Yet for the early time period, only a variety of inconsistent data from different sources is available. 6 The magnitude of FDI in the then Soviet Union is hard to establish based on these data (table 1). Different sources use different definitions: The UNECE database uses national data on the registration of new FDI projects which, in emerging markets, tends to overstate actual FDI flows because projects are registered ahead of the actual capital transfer and the start of business operations. Brewer (1994) characterises UNECE data as reflecting potential rather than implemented investment. PlanEcon presented data that are to control for such effects, and report about half the volume of FDI for the period 1987-1990. Both UNECE and PlanEcon report that FDI began in 1987, peaked in 1989, and fell slightly back in 1990. The balance of payment figures reported for this time period are available only on a net-basis, that is deducting FDI outflow. In World Bank (1992) the net FDI is reported to be negative for several years: After the break-up of the trade arrangement of the Socialist bloc, the CMEA, partner countries withdrew from investments they had previously undertaken in Russian industry. These figures thus give no indication of the role of new Western FDI entering Russia. The records provided by Western countries on outflow of FDI suggest a negligible role of FDI in the Soviet Union. Many countries have not reported any investment as the flow was to small to warrant a separate line in the statistical tables, or they were classified confidential because of the small number of projects. Despite the limitations of the data, which are discussed below, the data from the OECD-DAC indicate that the capital flow was too
10
small to be of major interest for the main source countries. Data collected from journalistic sources are also difficult to evaluate as they are based on company announcements. Here, investment intentions are difficult to distinguish from actual investments; and the capital contribution may often be overstated to aid public relations by both firms and governmental agencies. One such source is the database of the East European Investment Magazine cited by Bradshaw (1995). The figure of US$ 18 billion for 1992 is not realistic. Given the weak state of data on capital flows, data on the number of investment projects are occasionally used as substitute. Since many of these projects are very small these figures are of limited value. In addition, firms may be set as joint venture solely to take advantage of preferential tax and import regulation rather than to obtain genuine foreign participation. However, these figures suggest, consistently with the above, that 1989 has been the year when FDI in the Soviet Union accelerated for the first time. The review of statistical evidence on FDI during the last years of the Soviet Union thus leaves an unclear picture. While foreign investors did start entering the region, they were clearly reluctant to transfer capital, which would have appeared in the balance-of-payments statistics of both home and host countries. Including in-kind contributions such as machinery and technology, the investment may have reached the levels suggested by PlanEcon. They suggest that FDI peaked in 1989 at US$ 641 million in the Soviet Union, of which US$ 454 million were in Russia.
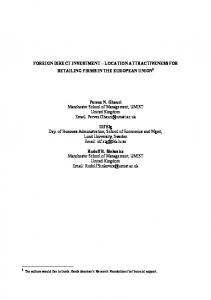
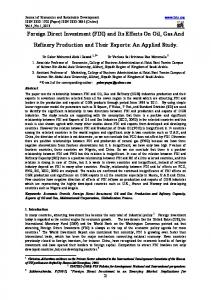
The Newly Independent States In 1991, the Soviet Union ceased to exist and its constituent republics became independent states. This break up of the country inhibits continuity of data series for two reasons: new countries became the relevant reference unit, and statistical offices in the new entities had initially no appropriate procedures to collect the relevant data. Fortunately, balance of payment statistics are now available for most countries, although often as estimates. In table 2, the balance of payment data from the International Financial Statistics have been complemented by data from other IMF publications and from the EBRD. On this basis, an overview of FDI inflow in the period 1992 to 1996 is feasible. It should be kept in mind, however, that the international organisations rely on primary data from the respective countries, which are not free from distortions. 6 Artisien-Maksimenko and Adjubei (1996) have collected country studies and policy debates on this
11
Figure 1: Foreign Direct Investment in the Newly Independent States 2,5
2
Belarus
Kazakhstan
Kyrghystan Turkmenistan
Tajikistan Uzbekistan
Moldova Ukraine
Russia Armenia
Azerbaijan
Georgia
billion US$
1,5
1
0,5
0 1992
1993
1994
1995
1996
1997
-
Sources and specific notes to table 2: Balance of Payments Statistics Yearbook and International Financial Statistics (IMF), except: a separation of Czech and Slovak Republic 1989-92 based on PlanEcon, b net FDI-inflows, estimate by EBRD [1997:126], c Economic Reviews (IMF), d net DFI from World Bank 1992, e includes reinvested earnings, f IMF country report no. 12 Kyrgyzstan (1993:29), g PlanEcon Report, November early period. 12
1997 (Ukraine). h Russian Economic Trends. j Azerbaijan Economic Trends k full year .
13
Table 2: DFI inflows to Transition Economies Balance of payments data, excluding reinvested profits, in million US$ Year
88
89
90
91
92
93
94
95
96
97, Sept.
Kazakhstan Kyrgyzstan
... ...
... ...
... ...
... ...
...
...
...
...
165c 6f 12c
635b 38 12b
941 96 13b
1108b 46 13b
956 ...
Tajikistan
100c ... 9c
70c
103b
233b
...
...
Turkmenistan
...
...
...
...
11c
Uzbekistan
...
...
...
...
40c
4c
73b
-24b
108 50b
Estonia Latvia
... ...
... ...
... ...
... ...
73 29
135 45
172 214
186 180
132 293
... ...
Lithuania Russiae
...
...
...
...
65
128
...
...
...
-100d
30 700c
31
...
10 700c
... ...
... ...
... ...
... ...
12
23
45
... 16
...
...
...
10c 14c 198g
2479 75b
...
7c 17c 170c
2017 7b
5100h
Belarus Moldova Ukrainee
637 10b 159
521
...
Armenia Azerbaijan
... ...
... ...
... ...
... ...
... ...
267 19b
... 1051 jk
... ...
8 b 22
155 6b
18 591 j 25b
j
...
Georgia
...
...
...
...
...
...
8b
Total CIS
...
...
...
...
...
...
1700
3800
5000
...
...
for comparison Albania
...
...
...
-1
20
58
53
70
90
30
Bulgaria
...
...
4
56
42
55
105
90
115
...
Croatia
...
...
...
...
...
74
98
81
349
...
Czech Rep.a
...
171
120
511
983
654
878
2568
1435
841
Hungary
14
215
354 1462
1479
2350
4519
1982
...
Poland
15
11
69
241
524
1516
2771
4254
...
Romania Slovakiaa
...
...
112
40
77
94
341
419
263
...
...
86
53
82
72
199
203
183
280
88
Slovenia
...
...
...
41
111
113
128
176
186
246
Total Region
...
483
712 1927
3308
5113
10877
8954
...
China
... 3393 3487 4366 11156
27515
35849
40180
...
General notes to table 2: 1. Since most countries in the region do not collect data on reinvested profits, we exclude them for better comparability across countries. In the International Financial Statistics only Poland and Estonia report reinvested profits separately. 2. With the exception of Poland, the data from EBRD and IMF do not differ by wide margins where both are available. Differences could be due to the use of different exchange rates, or the deduction of outflowing DFI, different treatment of reinvested earnings and the like. For Poland, the EBRD uses data from the National Bank of Poland, which uses a far narrower definition of FDI than that applied by the IMF worldwide. 3. Data for 1997 refer to the period January to September only (except Azerbaijan).
14
Table 3: DFI inflows to CEE, Adjusted for the Size of the Economy
Year
FDI per capita
FDI in percent
FDI in percent of
in US$
of output (GDP)
investment (GDI)
92-94
95-96
Kazakhstan
18
62
Kyrghyzstan
NA
16
92-94
95-96
92-94
95-96
1.7
4.8
6.9
21.7
NA
2.3
NA
14.7
2
a
0.6
0.6
NA
NA
14
39
a
1.2
3.3
NA
NA
2
1
0.2
0.6
0.8
2.6
Estonia
84
106
2.8
4.0
8.6
14.7
Latvia
38
95
1.7
3.9
18.3
18.7
Lithuania
6
26
0.5
1.4
2.5
7.2
Russia
Tajikistan
2
Turkmenistan Uzbekistan
5
15
0.2
0.7
0.7
2.6
b
1
1
0.0
0.0
0.1
0.1
Moldova
3
8
0.4
1.0
4.8
13.9
Ukraine
3
8
0.2
0.5
NA
NA
NA
5
Belarus
Armenia Azerbaijan
b
NA
NA
0.9
NA
10.0
50
a
NA
10.5
NA
65.8
a
NA
0.8
NA
25.0
Georgia
NA
3
Albania
8
24
1.5
3.7
11.5
22.8
Bulgaria
8
12
0.7
0.8
3.1
3.9
NA
44
NA
1.2
NA
8.4
81
194
2.3
4.5
11.6
17.9
161
319
4.0
7.4
19.1
32.3
31
91
1.3
3.0
8.0
17.6
Romania
8
15
0.6
1.0
2.1
3.7
Slovakia
30
43
1.3
1.3
7.5
4.7
Slovenia
59
91
0.8
1.0
4.0
4.4
20
32
4.6
5.5
11.0
13.6
Croatia Czech Rep. Hungary Poland
China
b
b
b
Sources: Own calculations based on table 2, and World Bank (1996, 1997) tables 1, 12 and 13. Notes: The data are calculated as multiple year averages to overcome the misleading impression that may arise due to high volatility of FDI data. The data for population, GDP and GDI are 1994 (for 1992-94) and 1995 (for 1995-96) unless otherwise indicated. The World Bank reports the data used for the former Soviet Union countries as ‘preliminary estimates’. a calculations used population data for 1994; b GDP components are calculated at purchaser values.
15
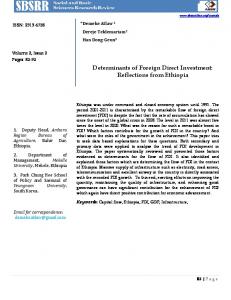
Table 2 suggests that foreign investment in the successor countries of the Soviet Union took off in 1995. FDI inflow in the early 1990's was below the FDI in Central European countries at the time. Among the successor economies, Russia is by far the leading recipient, which is not surprising given the size of the country. The inflow is estimated at US$ 700 million for 1992 and 1993, but it increased in 1995 to more than US$ 2 billion, with further acceleration since. With these inflows, Russia received amounts comparable, in absolute terms, to the Czech Republic but it is still lagging behind Hungary and Poland. Kazakhstan comes second with more than US$ 1 bn in 1996 and 1997. On the other extreme, the small and least reformoriented countries Belarus and Tajikistan received the least FDI. The total balance-of-payments recorded inflow of FDI in the former Soviet Union adds to about US$ 5 billion in 1996. However, the cross country variation shows a vastly different pattern once the size of the respective host economy has been taken into account. We have adjusted FDI figures using three alternative nominators: population, GDP and gross domestic investment (GDI). To control for the high volatility of FDI data, we report multiple year averages (table 3). With US$ 314 per capita, Hungary has established itself among the leading recipients in emerging markets, behind Singapore and Malaysia (Meyer 1996). None of the successor states comes even closeFigure to her2:per inflow.and Estonia reached in US$ 84 per capita in the FDIcapita per capita, the Progress Transition period 1992-94, which is second only to Hungary (US$ 161). In the 1995-96 period, FDI in Hungary the Czech 300 Republic accelerated, but Estonia (US$ 106) and Latvia (US$ 95) still stay ahead of Poland and Slovenia in per capita terms. 250
The least attractive countries are, by this measure, Belarus and Uzbekistan with only
FDI per capita, in US$
US$ 1 per capita. For Uzbekistan, the official data may however be incomplete: According to the Korean National Bank, Korean investment in Uzbekistan amounts to US$ 180 million by Czech Rep.
200of 1996 (table 8). This is far more than Korean investment in Russia, and more than the end
the cumulative total reported by the IMF for Uzbekistan. It can be attributed to the role of the Korean minority in Uzbekistan and other central Asian countries. This ethnic minority 150
established itself after the Korean War, coerced by Stalinist resettlement policy. Estonia Naturally, FDI focuses on the more developed countries with more attractive markets. Latvia
100 On the other hand, a small amount of foreign investment in a small economy Polandcan have a major Kazakhstan impact on the host country. Table 3 therefore reports FDI in relation to the Slovenia size of the Azerbaijan
economy and relative to domestic investment (FDI/GDI). TheSlovakia latter is a suitable 50 (FDI/GDP) Turkmenistan Lithuania
Albania measure to assess the contribution that foreign investment makesCroatia to restructuring and Kyrgystan Uzbekistan
Moldova
developing Tadjikistan the domestic economy (e.g. Desai 1997). 7 0 0
Belarus
Ukraine
5
10
Georgia
16
Russia
15
20
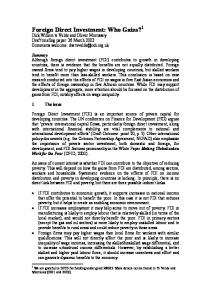
Figure 2: FDI / GDP and the Progress in Transition
12
Azerbaijan
10
8
FDI / GDP
Hungary
6 Kazakhstan
Czech Rep. Estonia
4
Turkmenistan
Latvia
Albania
Poland Kyrgystan
2 Tadjikistan
Moldova Armenia Uzbekistan Ukraine
0 0
Belarus
Georgia
Lithuania
Slovakia
Romania Bulgaria
Croatia
Slovenia
Russia
5 10 15 Rank, based on EBRD transition report indices (1=least advanced, 24 = most advanced)
20
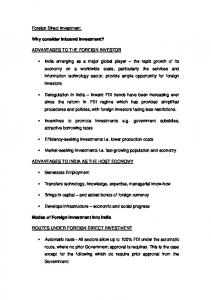
In relation to the GDP, Azerbaijan receives what must be one of the highest inflows world-wide: 10.5% of GDP. This leads to more than 65% of investment in the Azerbaijani economy being controlled by foreigners. The exploration of attractive oil deposits in an underdeveloped economy with few other industries leads to such foreign dominance. The attraction of natural resources also accounts for the strong Kazakh position by these measures, with an FDI over GDP ratio of 4.6%. This is still a very high figure by international standards; Spain and Portugal reached 4% to 5% in the years after they joined the EU. Relative to the size of the economy, several transition countries receive more FDI than comparable economies. 8 On the other hand, other countries are disappointing. FDI in Russia amounts to only 0.7% of GDP, and 2.6% of GDI. Although large countries naturally tend to be more selfsufficient, these figures suggest that FDI-capital contribute little to the economic development
17
economy. An exception is the investment in natural resource exploration already included in these figures. An interesting benchmark for Russia is the neighbouring even larger economy of China: there, FDI reaches to 5.5% of GDP and 13.6% of GDI.9 Several countries report high FDI/GDI ratios although the absolute amounts of FDI are low. This is due to the very low level of domestic investment. This reflects in part the dramatic fall of domestic investment in some of the successor states. In Armenia, GDI accounted only for 9% of GDP, in Moldova for 7% and in Georgia 3% (World Bank 1997, table 13). This explains the high FDI/GDI ratios obtained for these countries. The FDI inflow is often said to be positively associated with progress in economic transition. This is not only because foreign investment may facilitate transition, but also because more advanced countries offer an attractive business environment (World Bank 1996, Desai 1997, Meyer 1998). Figure 2 plots the FDI inflow per capita over a ranking of transition progress. We have used the transition indicators provided by the EBRD to develop this ranking.10 The figure shows that the most advanced transition countries are also attracting most FDI: Hungary, Czech Republic, Estonia and Poland. Yet, this positive association does not hold for the remaining countries. A different group emerges at the lower tail: countries that attracted foreign investment to exploit their natural resources. Using FDI as a percentage of GDP - and thereby controlling for the market attraction of countries with higher levels of income - the outlier situation of the resource-attracting countries becomes even more evident (figure 3). Among the successor states, two groups of countries are thus standing out in their FDI performance: the oil and resource rich Azerbaijan, Kazakhstan and Turkmenistan, and the Baltic countries. The latter have reformed more comprehensively and in addition benefit from good relationships with their Western neighbours. The laggard in the region is Belarus: With 0.03% of GDP or 0.12% of GDI, FDI is negligible. This can be attributed to Belarus’ continued reliance on central planning, ineffective privatisation and lack of operational freedom for domestic and foreign businesses (e.g. EBRD 1997). However, also many areas within Russia are void of foreign investment. The balance of payments disguises the huge variation within Russia shown by Bradshaw (1995). Table 4 reports data on the regional dispersion of FDI in Russia. FDI is concentrated in the capital, Moscow and its surroundings, showing a pattern that is typical for countries with a highly centralised industrial structure, but not for countries spanning a large geographical area. The time trend suggests that the area surrounding Moscow and the Far East are increasingly 18
attracting foreign investors, while the relative position of thinly populated but resource-rich regions of the Far North and Western Siberia declines. In addition to regions, local Russian governments have an important role in creating a business environment that attracts foreign investors. A favourable and predictable bureaucracy, low levels of economic crime and a prosperous local industry make some cities far more attractive than others. In addition to Moscow, St. Petersburg, Nishny Novgorod, Novgorod, Samara and Ekaterinburg are mentioned by investors as attractive locations.
Table 4: Regional distribution of FDI within Russia 1994
1995
Amount
Share
Amount
Share
Amount
Share
(mill
(%)
(mill
(%)
(mill
(%)
US$)
Total FDI of which: Moscow City Other Central St. Petersburg Other Northwest Volga Region Volga-Viatskii Central Black Soil Far North North Caucasus Urals Western Siberia Eastern Siberia Far East Kaliningrad oblast
1996
US$)
US$)
548.9
100.0
1867.9
100.0
2090.0
100.0
155.3 20.8 30.5 2.5 22.7 8.6 16.0 63.8 18.1 16.0 116.2 38.2 36.2 4.0
28.3 3.8 5.6 0.5 4.1 1.6 2.9 11.6 3.3 2.9 21.2 6.9 6.6 0.7
951.5 237.5 143.1 25.7 147.4 13.3 3.8 28.5 38.1 48.7 88.3 22.2 120.5 8.3
50.7 12.7 7.6 1.4 7.9 0.7 0.2 1.5 2.0 2.6 4.7 1.2 6.4 0.4
844.3 461.5 98.2 57.2 75.1 72.9 23.7 32.6 62.7 59.0 78.2 8.4 195.4 20.8
40.4 22.1 4.7 2.7 3.6 3.5 1.1 1.6 3.0 2.8 3.7 0.4 9.3 1.0
Source: OECD 1997a, p. 127, based on Goskomstat data.
4. The Source Countries FDI can be measured in the host country, as is common practice, or in the country of origin. The OECD collects data on FDI outflow from the source countries. These data can be used to estimate the inflow of FDI to the host countries, although this approach has certain limitations: q
The data are not available for all countries. Notably small countries that serve as formal residence for business operating elsewhere, such as Cyprus or Liechtenstein, are not included.
19
q
If individual data-points are classified confidential, an aggregation across countries may count them incorrectly as zeros.11
q
National authorities register projects only above a certain threshold of capital investment. Since many early projects in the Soviet Union were small in terms of capital invested, this may lead to systematic underreporting.
q
These limitations imply that aggregated source country data may under-report FDI, especially if the total FDI in the host country is small. However, this approach provides a lower limit for actual investment that is unlikely to be subject to political biases.
Table 5: FDI flows from OECD countries to the USSR, 1987-1991 in million US$ Year
1987
1988
1989
1990
1991
Belgium/Luxembourg France Germany Italy a Japan Korea b Spain Sweden Turkey United Kingdom United States Total
0.40 ... 2.78 ... 1.00
0.68 7.22 5.13 ... 9.00 ... ... ... ... ... ... 22.00
3.40 1.57 17.02 ... 19.00 0.50
32.47 9.00 20.42 ... 25.00 ... ... ... 3.00 3.57 2.00 95.46
140.83 36.69 -50.02 12.90 51.00 17.80 4.94 0.33 ... -5.31 … 196.26
... ... ... ... ... 4.18
7.00 9.84 4.00 62.33
Sources: OECD (1997), except a Banca d’ Italia, correspondence, b bank of Korea, correspondence. Note: For all other countries, no data entries were provided in the source.
For the period to 1991, the data in table 5 show far less FDI than reported by local Soviet sources or by the UNECE (table 1). Surprising is in particular the low level of FDI reported by the USA, which - according to Soviet sources – was the main country of origin. For the successor states, data are available for Russia from 1992 onwards (table 6). The total FDI that can be traced from OECD countries increases from some US$ 100 million in 1992 to US$ 1 billion in 1995. From the OECD-DAC database, we obtained data that suggest slightly more investment in 1992 and 1993, but less in 1995. The home country data are pleasantly consistent with the host country data for 1994 at about US$ 650 million. Yet in the other years, the Russian balance of payments seems to over-report FDI. In 1995, the OECD data show only half the volume claimed by Russian
20
authorities. This is a large margin of measurement error, even considering the limitations of the data.
Table 6: FDI flows from the OECD to Russia, 1992-1997 in million US$ Year
1992
1993
1994
1995
1996
1997
a
Austria Belgium/Luxembourg Denmark Finland France
5.5 1.4 … 14.5 61.8
6.9 61.2 0.7 -2.8 15.9
7.0 6.8 4.7 13.2 108.0
4.8 26.4 a -0.2 10.5 84.5
10.1 7.3 a 5.7 a … …
53.5 a 97.7 a … … …
Germany Italy
10.9 0.8
17.5 4.5
105.4 3.7
80.9 5.5
150.2 c …
117.1 c …
Japan Korea e
44.0 4.0
22.0 18.0
19.0 83.0
29.0 d 89.0
20.0 d …
10.0 d …
-39.2 a … … 0.2 0.3 … -15.9 19.0
-15.1 … 1.0 1.3 1.0 -5.4 15.0 222.0
-13.7 0.4 1.0 3.8 -17.6 40.9 179.7 142.0
78.5 … 1.0 -2.3 6.7 30.4 62.4 525.0
116.9 a … … … … … 124.9 a …
129.7 a … … … … … … …
107.3
363.8
687.3
1029.1
…
…
188
508
815
750
…
…
Netherlands Norway Poland Spain Sweden Switzerland United Kingdom United States Total NB: OECD-DAC database total g Main Source:
OECD International Direct Inv. Statistics Yearbook 1997 Notes: a correspondence with Austrian National Bank, National Bank of Belgium, Danmarks Nationalbank, De Nederlandse Bank and Office for National Statistics (UK); c Deutsche Bundesbank, Zahlungsbilanzstatistik; Japanese Ministry of Finance, 1997 refers to January to September;
e
d
According to correspondence with the
Bank of Korea, these data reported by OECD actually refer to the C.I.S., about 30% of this amount is in Russia; g
The OECD-DAC database covers ‘DAC-countries’, i.e. most OECD countries but not, e.g., Korea and Poland.
Similar assessments for 1996 or 1997 are not yet feasible as the OECD publishes its data with considerable time lags. However, the data we obtained for individual source countries confirm an upward trend. The OCED data suggest that the USA account for more than 50% of FDI in Russia in
21
1993 and 1995. The dominant role of American FDI is confirmed by local statistics: The USA are reported to be the most important source country in both Russia and Ukraine, followed by Germany (see table 7). Other important investors are the U.K., France and the Netherlands, all of which reported more than US$ 100 million in some years. Data like those reported in table 6 for Russia are partially also available for the Baltic countries and Ukraine. However, the time series is short and important source countries did not report the information. Therefore we abstain from tabulating the data. In the Baltic countries, neighbouring countries Denmark (US$ 72 million in 1995),12 Finland (43), Germany (27) and Sweden (25) appear the most important source countries. In Ukraine, Germany is the only country reporting major investment with a cumulative total of US$ 157 million by 1997. The pattern of FDI in the successor states is affected by two phenomena that can explain some of the discrepancies between data sources: round-tripping and investment withdrawal. Round tripping is the return of flight capital13 through direct investments by Russian firms registered abroad. This is common in the former Soviet Union because joint ventures enjoy certain benefits with respect to taxation, tariffs, and currency convertibility.14 Round-tripping FDI is technically FDI, but brings few of the benefits associated with direct investment. In fact, it may ease further capital flight. Much of this FDI is not covered by the source country statistics because the firm abroad formally undertaking the FDI is too small to be covered by its host’s statistical surveys, and it may be located in a country where outward FDI data are not available. Especially Cyprus has earned a reputation as haven for Russian flight capital, which is reflected in the fact that Cyprus appears as fourth most important source country for FDI in 1996 (table 7). FDI in Russia is further reduced by frequent disinvestments. Table 6 contains several negative entries for FDI flows, which is a rare occurrence for FDI-outflow statistics.15 These reflect a net capital transfer from the affiliate to the parent or a discontinuation of projects. The exit of investors from a project in the former Soviet Union is not a rare occasion. Even globally operating multinational disinvested manufacturing projects, discouraged by the risks of unfavourable local business environments and interference of local bureaucrats (Bridgewater 1998, McCarthy and Puffer 1997). In addition, foreign investors are seeking various ways to reduce their exposure to investment risk by withdrawing capital at an early convenience. Host country surveys, let alone registration data, are not sensitive enough to capture such trends. The cross-country pattern is reported in table 7 based on host country data. The main pattern is one of proximity as firms have a preference for investment in neighbouring countries 22
or for locations with special ethnic or cultural ties. This corresponds to similar observations in Central and Eastern Europe (Meyer 1995). Remarkable is the importance of the USA. The proportion of FDI accounted for by US multinationals is much higher in Russia and Kazakhstan than in other transition countries for which data are available. This may be in part due to globally operating multinationals who experience less obstacles in bridging large distances. It also reflects that the US, like the UK and Norway, is home to major oil companies. The source countries of FDI in Kazakhstan furthermore reflect special historical and cultural relationships with Korea and with Turkey, in addition to oil-industry specific features.16 The most notable absentees in the region are the Japanese, presumably held back by disputes over territory in the Kuriles islands.
23
Table 7: Countries of Origin according to Local Statistics. in % and as a ranking Origin EST % LAT % LIT % RUS % European Union Austria 8 2.0 Belgium ... ... Denmark 9 2.0 Finland 1 23.0 France ... ... Germany 7 3.0 Ireland 5 7.0 Italy ... ... Luxembourg … … Netherlands ... ... Sweden 2 21.0 UK 6 6.0 Eastern Europe Bulgaria ... ... Czech R. ... ... Poland ... ... Hungary. ... ... Russia 3 10.0 Estonia ... ... Other Europe Cyprus ... ... Liechtenstein ... ... Norway … … Switzerland ... ... Turkey ... ... North America USA 4 8.0 Canada ... ... East and South-East Asia Japan ... ... Singapore … … Korea (Rep.) … … Total - 100
UKR
%
KAZ
%
... 9 ... ... ... 2 ... ... … 5 ... 4
1.7 2.5 0 0 1.1 17.0 0 2.2 … 6.3 1.8 7.7
… … … … 4 10 … 6 … 9 … 4
… … … … 5.2 1.1 … 2.5 … 1.3 … 6.7
... ... 1 … ... 5 7 … … ... 8 6
… … 20.0 … … 36.1 4.7 ... … … 23.1 5.1
9 ... 7 6 ... 3 8 ... 5 ... 2 4
2.4 ... 5.1 6.0 ... 11.3 3.5 ... 6.0 … ... 12.2 7.4
3 8 ... ... 8 2 ... 11 10 7 5
6.7 1.8 ... ... 1.8 9.8 ... 0.7 … 1.4 1.9 5.3
... ... ... 2 10
… … … … 10.4 2.8
... ... 12 ... 11 ...
... ... 1.0 ... 1.5 ...
... ... ... ... ...
... ... ... ... ...
... ... 11 12 3 ...
0.9 0.9 2.3 2.3 8.3 0.6
… … … … … …
… … … … … …
... ... … 9 ...
… … … 3.4 ...
... ... 10 ... ...
... ... 2.4 ... ...
4 ... … 6 ...
(6.6)a ... … 5.2 ...
6 8 … 7 ...
6.0 3.5 … 3.8 ...
… … 8 … 3
… … 1.3 … 6.8
3 …
9.1 …
1 ...
27.1 ...
1 ...
40.3 ...
1 ...
20.2 2.0
1 7
45.9 1.6
... 4 … -
… ... 9.0 … … … 100 -
... … … -
... … … 100
... … … 100
... … … -
0.1 … … 100
5 … 2 -
4.1 … 17.0 100
Interpretation: Ranks refer to the relative importance of source countries in the host country. For example in Estonia (EST), Finland is the most important investor, Sweden second, Russia third, etc. Abbreviations and sources: EST = Estonia: registered FDI, July 1995 [Estonian Investment Agency] LAT = Latvia: registered FDI, September 1997 [Central Statistical Office, Latvia]. LIT = registered FDI, October 1997 [Lithuanian Investment Agency]. RUS = Russia: direct and portfolio investment, flow 1996, Goskomstat data reported by US department of commerce and by Russian investment promotion agency on their respective web sites. (The total is US$2.14 billion of which US $0.05 billion are portfolio. Using these as approximation for FDI is thus appropriate.) UKR = Ukraine: stock of registered FDI, July 1996, (Yegorov 1997, citing the Ukrainian Ministry of Statistics). KAZ = Kazakhstan: Cumulative flow 1993-1996, National Statistical Agency of Kazakhstan Note: a = refers to total investment (incl. purchase of govt. securities) - no details given on the kind of foreign
24
investment.
25
Table 8: Preferred Destination Countries within the FSU in million US$ (Source country data) RUS
KAZ UZB
Austria
87.0
0.4 b
Belgium
199.3
6.7
TAJ
0.0
EST
LAT
LIT
5.5 a nil
Denmark
2.0
...
...
...
Finland
31.7
...
...
...
7.8
0.2 41.9
55.6
4.4 a
31.9 41.9
7.5
a
UKR BEL
AZE
Other
Total
16.2
0.2
nil
nil
109.3
-13.9
0.2
-1.1
0.8
204.4
2.0
...
...
...
...
...
...
...
...
126.6
1.4
...
...
...
...
France
91.8
...
...
...
Germany,
680.5
48.9
...
...
...
38.6
21.9 131.2 12.2
...
...
…
392.3
22.2
2.7
nil
11.6
33.8
25.7 135.9 13.8
0.0
2.7
640.6
Sweden
31.8
...
...
...
74.4
32.4
14.8
1.6
...
...
...
155.0
U.K.
315.8
3.4
...
...
3.4
6.8
...
...
...
...
...
...
USA
954.0
...
...
...
...
...
...
...
...
...
...
...
OECD-DAC 2272.0
35.0
13.0
...
8.0
68.0
8.0
46.0
35.0
2660.0
Korea, Rep.
7.8
179.9 29.0
...
4.1
...
...
...
328.4
Stock 96 Germany, Flow 92-96
107.6
89.0 115.0 ...
...
Abbreviations: RUS = Russia; KAZ = Kazakhstan; UZB = Uzbekistan; TAJ = Tajikistan; EST = Estonia; LAT = Latvia; LIT = Lithuania; UKR = Ukraine; BEL = Belarus; AZE = Azerbaijan Notes: a total FDI into the three Baltic countries, b total FDI to Central Asia. Data definitions and sources: Country Austria
Cumulative flow, 1992-1997
Belgium
Cumulative flow, 1993-1997
Denmark
Stock of FDI, end of 1994
Data
Source Austrian National Bank, correspondence. National Bank of Belgium, correspondence. Danish National Bank, correspondence. OECD [1997]
France, USA Stock of FDI, end of 1995 Germany
Stock of FDI, end of 1996; and cumulative flow 1992 to 1996.
Deutsche Bundesbank [1998], and correspondence. Korea Outstanding investment, end of 1996 Bank of Korea, correspondence Sweden Cumulative flow until 9/1997. FDI in Russia was reduced by large scale Sveriges Riksbank, withdrawal of FDI in 1994 and 1997. correspondence U.K. Net book value 1996. Office for National Statistics, correspondence OECD-DAC Cumulative flow until 1995 as reported by source countries. DAC OECD, correspondence includes most OECD member but not those that recently joined such as HU, PL, CR and Korea. Finland Stock of FDI, end of 1996. The stock for Estonia and Russia fell Bank of Finland, enormously in 1995, and in 1996 recovered but not to the previous level. correspondence
26
Table 9: Sectors of Foreign Direct Investment in % of total FDI Largest projects CIS
Registered FDI
Other than CIS
Ukraine
Kazakhstan
(a)
(b)
76.7
2.4
…
…
…
77.0
- Metallurgy
…
…
…
…
…
23.0
- Oil & gas
…
…
...
16.0
…
54.7
19.4
63.2
…
…
34.1
…
- Food & tobacco
…
…
2.6
9.2
12.6
…
- Light industry
…
…
1.3
3.6*
2.9
…
- Chemicals
…
…
19.3
2.7
3.2
…
- Metals
…
…
2.3
2.9
1.0
…
- Engineering
…
…
24.1
4.3
11.9
…
- Other manufacturing
…
…
15.9
...
2.3
...
Construction
0.0
8.0
8.5
…
...
…
Trade
0.0
2.2
...
4.8
26.4
…
Transport &
1.2
12.8
3.2
…
4.1
…
Financial services
0.7
5.2
...
32.5
6.3
…
Other services
0.1
1.3
28.0
10.7
16.6
…
Other, N/A.
1.8
4.8
...
13.3
12.5
…
Mining and Quarrying
Manufacturing
Russia
communications
Sources and Notes: Largest Projects: UNECE 'East-West Investment News', no. 2, summer 1995. Russia (a): UNECE [1996a], data refer to the stock of registered FDI at the end of 1994 . Russia (b): Foreign Investment Promotion Center (www.fipc.ru) citing Goskomstat. Data refer to the total investment registered by the end of 1997. 46% of this investment is registered as direct investment, but no sector break down for this is available. * = the entry refers to the wood industry only. Kazakhstan: National Statistical Agency to Kazakhstan Ukraine: Yegorov [1997] citing Ukrainian Ministry of Statistics, referring to registered FDI, July 1996.
The source country data in table 8 confirm the leading position of Russia as recipient of FDI.17 It is followed by the Baltic countries (for Scandinavian and French Investors) and by the Ukraine (for Germans and Austrians). For Germany, we obtained both stock and flow data
27
from the Bundesbank, which suggest that German FDI is focusing on Russia, followed by Ukraine, the Baltic States and Kazakhstan. Although Germany has few major multinationals in the energy and resource industries, it reports a substantial increase of FDI in 1997 to Kazakhstan of US$ 72 mill. The U.K. and U.S.A. data are incomplete, but it can be presumed that they feature Central Asia more prominently as they are home to mayor oil-exploration multinationals. An outlier is Korea, as its multinationals appear to have focused on Uzbekistan as the door to entry the region. On the other hand, Russia itself is emerging as a major source of FDI in the ‘near abroad’ countries. This is in part due to the reorganisation of firms after the break up of the Soviet Union, but may also have been enhanced by capital flight. 5. The Sectors of Foreign Investment The information received on the sectors of investment in the former Soviet Union is very scarce. They are based on the registration of investment projects with the usual shortcomings of such data. The information we have been able to collect has been assembled in table 9. The UNECE compares the pattern of FDI in the CIS countries with other transition economies based on the investment in the largest investment projects. These data show a remarkably huge difference: Three quarter of major investment projects in the CIS are in mining and quarrying activities, whereas almost two third of major projects in elsewhere are in manufacturing. Also the telecom sector in the CIS received only a fraction of the investment capital attracted to the other transition economies. The actual differences may not be as huge if all the small projects in both services and manufacturing are considered, yet it indicates a major trend. The data obtained for Russia appear very contradictory. The UNECE (1996) reports that investment until 1994 is concentrated in manufacturing. Presumably, this includes exploration of natural resources as well as their processing. Recent data from Goskomstat do not separate between direct, portfolio and other investment. The latter, which accounts for about half of the total, is mainly the foreign acquisition of Russian government bonds (U.S. Government 1997), and appears registered in the financial sector. Of the remainder, the oil and gas industries receive the largest share. This confirms the attraction of Russia resource deposits that are now explored by Russian-International consortia. The food and tobacco industries receive major investment aimed primarily at
28
supplying the local markets throughout the transition economies, including Russia and Ukraine. Also in Kazakhstan a number of major projects have been invested in those consumer goods industries where world-wide oligopolistic competition induces multinationals to seek new markets, and first-mover advantages, in the transition economies (e.g. Estrin and Meyer 1998). The two main projects by Philip Morris (tobacco) and Nabisco (confectionery) are typical examples for such industries. Direct investment in Kazakhstan is aiming primarily at those sectors where the country possesses valuable deposits of natural resources. The main investment capital flows into the natural resource exploitation, at one stage over 80%. More than 50% of FDI in Kazakhstan are aimed at the oil and gas industry. However in 1995, the metallurgy sector temporarily overtook oil and gas receiving 50% of FDI (Charman 1998). Foreign investors aim at exploiting Kazakh resources such as copper, titanium and magnesium, aluminium and zinc [Kazkommertz 1998].18 Data for 1996 indicate that slightly more diversified foreign investment, with manufacturing and telecommunications receiving major investments.19 In Azerbaijan, oil consortiums alone accounted for more than 70% of FDI in both 1996 and 1997.20 Investment in the oil and gas industry appears to have been held back by the slow clarification of property rights and the unsatisfactory policy framework for foreign investment (e.g. Adjubei and Swetzer 1996). The Caspian Shelf agreement regulating the exploitation of the resources in the Caspian Sea appears to have eliminated many obstacles and triggered major investment projects. Oil and gas presumably received an even higher share in 1996 and 1997, for which we have few data. Mayor investors in oil and gas fields are Tengiz-Chevron, British Gas/AGIP and Mobil Oil. The geo-political situation of Kazakhstan, in particular the lack of pipelines to key overseas markets, remain however a major obstacle to export, and thus the investment in exploration and development of the oil and gas fields. For Kazakh economic development, it would be crucial to know if investors process the resources before exporting them. This would increase the local value added, and ensure that a higher and more sustainable share of revenues is kept locally. The current concentration on natural resource exploitation implies a danger of a 'Dutch disease', that is an overdevelopment of that particular sector at the expense of other industrial development. The data we obtained are insufficiently dis-aggregated to analyse the extent of local processing. Yet case evidence suggests that downstream industries are not well prepared to become a driving force in economic development.21 29
6. Motives and Obstacles A number of surveys have been conducted among foreign investors in the transition economies. Most of them focus on Central Europe, as the base population of firms active in Russia is rather small. Some surveys cover several countries and thus permit some inference about the differences between transition countries (e.g. Gatling 1993, Genco et al. 1993, OECD 1994, Meyer 1998, Lankes and Venebles 1996). Other surveys focus on selected successor countries, mainly on Russia (e.g. McMillan 1991, Thornton and Mikheeva 1996) but also on Kazakhstan (Charman 1996), Ukraine (Bridgewater 1998) and the Baltic countries (Borsos 1996, Seyed-Mohamed 1996). The number of respondents to the surveys is mostly small but some patterns emerge consistently across surveys. For instance, they report that firms are investing in Russia as in other transition economies primarily in view of attractive markets. In Russia, investors stress the long-term potential of the market, as many firms appear to make losses for a rather long initial time period. However, small initial projects are often seen as investment to learn about the local business environment, to establish contacts and to recognise future business opportunities. In oligopolistic consumer goods industries firms pursue perceived first-mover advantages and enter at an early stage before the market has grown sufficiently to permit profitable operations (Lankes and Venebles 1996; Meyer and Estrin 1998). However, some investors were able to earn very high rates on return in the highly volatile environment of the first years.22 Labour costs are lower in the former Soviet Union than in Central Europe suggesting a major potential for labour-cost oriented relocation. However, few if any investors appear to invest in labour intensive export oriented projects, even less than in Central Europe. The reasons for this are the higher transportation costs, lower productivity due to dated machinery and inadequate infrastructure, and high social security costs. Also, many considered the quality of locally available supplies as unsatisfactory.23 The most attractive factors of production are, in contrast to Central Europe, natural resources such as oil, gas and timber. The main obstacles to business are found in the general institutional and legal framework. This is in line with global trends as MNEs place greater emphasis on economic and institutional factors that facilitate the efficient utilisation of their core competencies [Dunning 1998]. Investors in the CIS region complain particular about the incompetence or uncooperative bureaucracy, a frequently changing legal framework, lack of acceptable institutions such as independent courts, and last not least business practices ethically not 30
correct in the source countries. In the survey by Thornton and Mikheeva (1996), the ambiguity of the legal system is the most cited deterrent to investment and ‘relations with authorities’ is the most important factor impeding growth.24 Lankes and Venebles (1996) report 'regulatory and legal risks' as the most important source of risk. The weak legal framework implies that firms cannot rely on the courts to enforce contracts or disputes with authorities. The local bureaucracy is implementing federal and regional regulatory law. This results, in most regions, in a huge volume of bureaucratic rules that intrudes into business. In addition, they are "produced by people with no interest in business and often contradict sound business practice. Third, regulations are enforced arbitrarily, corrupt, or not at all. Fourth, regulations often contradict the law they are supposed to implement. Fifth, it is hard to find out about regulations, especially on the local level, because, they are not published in a consistent manner" (Thornton and Mikheeva 1996:95, interviewing an American lawyer). As a consequence of ineffective regulation, corruption and other forms of economic crime galore. In 1997, Corruption International ranked Russia on place 49, ahead of only Colombia, Bolivia and Nigeria.25 The relationships with the authorities dealing with import/export, enterprise registration and taxation are particular difficult. In a survey by Kaufmann (1997:7, also see Raiser 1997) about half of Russian executives interviewed reported paying ‘unofficial fees’ for import licences and border crossings; in Ukraine, the proportion of those admitting side payment was up to 100%. The author estimates that unofficial taxes add up to 9% of firms' turnover to their official tax bill. The informal economy poses particular obstacles for foreign business because local practices conflict with Western ethical standards (e.g. Puffer and McCarthy 1995) and because as outsiders both rent-seeking agents and law enforcement agencies particularly target them. Investors therefore place great emphasis on partner selection and reputation, and on designing self-enforceable contracts. According to Thornton and Mikheeva (1997:105), "the single most important factor in a successful business partnership was the choice of partner. Choosing a potential partner required two kinds of assessment: due diligence, a careful investigation of the reputation and track record of a potential partner, and also an assessment of the relationship capital," that is the personal contacts to Russian business networks and authorities. In fact, political reasons such as smoothing approval of operating licences appear to be a major motive for choosing joint ventures as organisational form (e.g. Charman 1996).
31
7. Explaining the Pattern of Growth In a global perspective, foreign direct investment in the successor states of the former Soviet Union has been evolving very slowly. With few exceptions, the region lags far behind the successful attraction of FDI in Hungary and other Central European countries. Only selected regions and sectors have been able to attract substantial FDI, though the overall trend points upward in many parts of the region. Why did it take the successor states of the Soviet Union more than ten years to reach this level? And why is investment, when it comes, often coming in large concentrations on particular industries? These patterns can be explained by the strategies followed by multinational firms, and explored in recent international business literature. We see three mutually reinforcing factors that inhibit a more rapid attraction of FDI:
Evolution of the Institutional Environment The legislatory framework has gradually opened more sectors for foreign investment, and gradually permitted deeper forms of involvement. While initially only minority joint ventures were permitted, now full ownership is permitted, at least formally. This not only permits more investment in a given project, but also encourages investors who would not be willing to share control with a local partner. In parallel, more very large firms have been offered for direct sale to foreign investors.26 Beyond the establishment of the legal framework, the slow FDI can also be attributed to a poor reputation of local authorities. Foreign investment is subject to high sunk costs. This implies that the bargaining position between host governments and foreign investors drastically changes after the investment has been made. Under circumstances of high legal uncertainty and no track record of local governments, investors were therefore reluctant to commit major capital. This phenomenon has been discussed in the FDI literature under the title of obsolescing bargain (Encarnation and Wells 1985, Kobrin 1984). Incentive-compatible contracts can overcome the problem only partially because governments, as sovereigns, cannot to formally bind themselves. Therefore the reputation of a country, supported by a track record of 'responsible behaviour', is an important consideration for potential investors (Caves 1998). Building a reputation takes time, yet it is quickly lost by single incidents causing negative publicity. In Russia, not only the national government, but also regional governments need to be seen as welcoming foreign investment. The effects of the evolving institutional framework can be observed in particular in
32
sectors that are only attractive if a prudent and credible regulatory framework has been established. This includes financial services, resource exploration and natural monopolies such as (traditional) telecommunication networks. A large share of FDI in the CIS is attracted by natural resources, notably in Kazakhstan. This investment has been dependent on concessions and the privatisation of the sector, which has progressed only slowly. A crucial point appears to have been the Caspian Shelf agreement that opened vast potential for international exploitation of oil and gas in the region. A key component of the institutional environment in transition economies is the privatisation agency, and the policy it pursues for privatisation of state assets. This creates major opportunities for foreign investors, as previously closed sectors of the economy open to international business. However, with the acquisition of a privatised firm, the investor takes over responsibilities for the restructuring of that firm. Often, this includes not only downsizing and structural changes but also the introduction of new management and organisational culture. Privatisation agencies prefer to sell shares in companies to private investors and leave them the obligations of restructuring along with the financial and environmental liabilities of the firm. This, obviously, is not in the interest of investors who prefer to acquire selected assets, and stay away from non-viable firms (e.g. Rekhve et al. 1998). In Russia, there appears to be also a tendency to prefer domestic rather than foreign investors as buyers for key stateowned firms. Specific policies pursued by the privatisation agencies thus have major implications for the attraction of companies offered for sale.
Investment Risk The risks arising from the incomplete institutional framework as well as economic and political risks induce foreign businesses to keep their capital investment low. High uncertainty implies that investment is deterred because new information becoming available permits better decisions. Delay of commitment reduces the downside risk associated with high sunk costs, as has been established in the theory on real options (Dixit 1990, Pindyck 1991). The argument has special relevance for direct investment because it is typically subject to high sunk costs (Buckley and Casson 1998). However, multinationals invest in the collection of information by entering small markets, and by establishing small operations such as representative offices. This can be observed throughout the transition economies, and contributes to the preference for smaller and less distant countries. In addition, investors appear willing to reinvest their profits as part 33
of their long-term commitment (Thornton and Mikheeva 1996). Decisions over reinvestment of profits appear to be taken locally, with headquarters imposing fewer constraints with respect to the firms' country risk profile. Since Russian and Ukrainian balance-of-payments statistics include reinvested profits,27 this contributes to the acceleration of reported FDI.
Internationalization Process Model Last not least, firms generally enter foreign markets in a gradual way, starting in nearby countries and with low levels of investment. As they gather experience on business in the local environment, businesses increase their commitment to the country, and enter new markets that are more distant. This ‘internationalisation process model’ has received considerable empirical support in studies undertaken in various parts of the world (Johanson and Vahlne 1977, 1990) and recently also in transition economies (Engelhard and Eckert 1994). In the case of the postSoviet economies, the learning process is particularly lengthy because of the large differences in business cultures between Western market economies and post-socialist Russia. Many investors in CIS countries have previously gathered experience in the more advanced transition economies. In the country itself, potential investors spend considerably time and effort in developing business relationships prior to forming a joint venture because they appear to succeed only if the parties know and trust each other. However, this entry process takes considerable time. Following their establishment, foreign-owned affiliates gradually become more embedded in the local environment. This leads to a deepening of the local value-chain and to higher order activities, including research and development. Although foreign acquisitions often led initially to a reduction of R&D in transition economies (due to centralisation), this may be reversed in a longer perspective. 8. Outlook A wide diversity of experiences with FDI can be observed in the countries and regions of the former Soviet Union. Three trends emerge: the countries that are most advanced in economic transition receive FDI of more than 3% of GDP, which is above West European average. The resource-rich countries Azerbaijan, Kazakhstan and Turkmenistan receive very large amounts of FDI, which are focused on the exploitation of natural resources. Less reform oriented countries like Belarus and Uzbekistan receive very little FDI so far. Russia's performance varies across regions with some falling in each of these categories.
34
The policy implications are thus different for different countries. Estonia and Latvia appear to be well positioned to take advantage of the potential benefits of FDI and can expect FDI to make a substantial contribution to their economic development. In the resource-rich industries investment appears to be concentrated on a few industries, which limits the spillovers that this investment can have throughout the economy. Their prime task thus is to create linkages between the foreign-dominated sectors and other economic activity and to encourage FDI in processing rather than just in the exploration of natural resources. For both groups of regions it would however be premature to rest on their laurels as their stock of inward FDI is, due to the short history of receiving FDI, not particularly high.28 Also, they should strive to integrate foreign investors into the local economy to obtain optimal benefits from their presence. The received FDI is still minor in most other successor states, and in most of Russia itself. Major improvements of this situation cannot to be expected soon because the main obstacles experienced by foreign investors are due to the weak legal and institutional framework, or even the lack of a civic society. The reform of this general business environment is a daunting task that will take several years to accomplish, even under an optimistic scenario. Foreign investors will continue to observe the evolution of this institutional environment, not just the laws issued but also their track record, before committing major capital investment.
35
References Adjubei, Yuri and Alexandra Swetzer (1996): Kazakhstan, in: P. Artisien-Maksimenko and Y. Adjubei, eds.: Foreign Investment in Russia and Other Soviet Successor States, Basingstoke: Macmillan, p. 208-227. Artisien-Maksimenko, Patrick and Yuri Adjubei, eds. (1996): Foreign Investment in Russia and Other Soviet Successor States, Basingstoke: Macmillan. Azerbaijan Economic Trends (1998): Universite Paris XIII/Tcc. INSEE/Planstat for the European Comission, Brussels, quarterly issues. Blackwell, William (1974): Russian Economic Development, New York: New Viewpoint Press. Bogieva and Lozhenchkina (1998): Which Forces and to What Extent Do They Influence the Situation on Dairy Market in the Republic of Kazakhstan, Paper presented at the Conference "Privatisation, Enterprise Development and Change in Business Culture - the Kazakh Case in Perspective" in Almaty, Kazakhstan, June. Borsos-Torstila, Julianna (1998): Finnish FDI in Russia and the Baltics, PhD Dissertation, forthcoming, Helsinki School of Economics and Business. Bradshaw, Michael J. (1995): Regional patterns of Foreign Investment in Russia, London: RIIA. Brewer, Thomas L. (1994): Indicators of Foreign Direct Investment in the Countries of Central and Eastern Europe: A Comparison of Data Sources, Transnational Corporations 3, no. 3, p. 115-126. Bridgewater, Susan (1998): Intra-Company Relationships and International Investment: The experiences of Multinational Corporations in Ukraine, AIB(UK) 25th Annual Conference, April, proceedings, p. 78-90. Buckley, Peter J. and Mark C. Casson (1998): Models of the Multinational Enterprise, Journal of Internatinal Business Studies 29, p. 21-44. Caves, Richard E. (1998): Research on International Business: Problems and Prospects, Journal of International Business Studies 29, p. 5-19. Charman, Ken (1996): Joint Ventures in Kazakhstan: The View from the Foreign Partners, Discussion paper no. 41, CISME Centre, London Business School, October. Charman, Ken (1996a): Kazakhstan: Legislative Background for Foreign Investors including Joint Ventures, Discussion paper no. 40, CISME Centre, London Business School, October. Charman, Ken (1998): Joint-Ventures in Kazakhstan, PhD thesis, draft, London Business School. Desai, Padma (1997): Introduction, in: P. Desai, ed.: Going Global: Transition from Plan to Market in the World Economy, Cambridge: MIT Press. Deutsche Bundesbank (1998): Kapitalverflechtungen mit dem Ausland, Statistische Sonderveroffentlichung 10, Frankfurt, May 1998. Dixit, Avinash (1990): Investment and Hysteresis, Journal of Economic Perspectives 6, p. 107-132. Dunning, John H. (1998): Location and the Multinational Enterprise: A Neglected Factor? Journal of International Business Studies 29, p. 45-66. Encarnation, Dennis J. (1996): Asia and the Global Operations of Multinational Corporations, paper presented at the BRIE ‘Policy Conference on East Asian Networks’, Copenhagen, October. Encarnation, Dennis J. and Louis T. Wells (1985): Sovereignty en Garde: Negotiating with Foreign Investors, International Organization 39, p. 147-71. Engelhard, Johann and Stefan Eckert (1994): Abschlußbericht zum Forschungsprojekt Markteintrittsverhalten deutscher Unternehmen in osteuropäischen Ländern, Bamberger Betriebswirtschaftliche Beiträge nr. 98/1994. European Bank for Reconstruction and Development (1997): Transition Report 1997: Enterprise Performance and Growth, London: EBRD. Gatling, Rene (1993): Foreign Investment in Eastern Europe: Corporate Strategies and Experience, Research Report written in association with Creditanstalt Bankverein, London: Economist Intelligence Unit.
36
Genco, Pietro, Siria Taurelli and Claudio Viezzoli (1993): Private investment in Central and Eastern Europe: Survey Results, Working Paper no. 7, European Bank for Reconstruction and Development, London. Gutman, Patrick (1992): The opening of the USSR to Foreign Capital: From Concessions during NEP to Joint Ventures under Perestroika, in: M. Lavigne (ed.): The Soviet Union and Eastern Europe in the Global Economy, London: Cambridge University Press. Jacobsen, Kurt (1997): The Great Northern Telegraph Company: A Danish Company in the Service of Globalisation since 1869, in: S. Tønnesson, J. Koponen, N. Steensgaards and T. Svensson (eds): Between National Histories and Global History: Helsinki: FHS. Johanson, Jan and Jan-Erik Vahlne (1977): The Internationalization Process of the Firm – A Model of Knowledge Development and increasing Market Commitments, Journal of International Business Studies 8, no. 2, p. 23-32. Johanson, Jan and Jan-Erik Vahlne (1990): The Mechanism of Internationalisation, International Marketing Review 7, no. 4, p. 11-24. Kaufmann, Daniel (1997): The Missing Pillar of a Growth Strategy for Ukraine: Institutional and Policy Reform for Private Sector Development, Harvard Institute of International Development, Cambridge, MA: mimeo. Kazkommertz Securities (1998): General Economic Guide: Kazakhstan, mimeo, Almaty, April. Kobrin, Stephen J. (1987): Testing the bargaining hypothesis in the manufacturing sector in developing countries. International Organization 41, p. 609-38. Kuznetsov, Andrei (1994): Foreign Investment in Contemporary Russia: Managing Capital Entry, London: Macmillan. Lankes, Hans-Peter and Anthony Venebles (1996): Foreign Direct Investment in Economic Transition: The Changing Pattern of Investments, Economics of Transition 4, p. 331-347. McCarthy, Daniel J. and Sheila M. Puffer (1997): Strategic Investment Flexibility for MNE Success in Russia: Evolving Beyond Entry Modes, Journal of World Business 32, p. 293-319. McMillan, Carl H. (1991): Canada-USSR Joint Ventures: A Survey and Analytical Review, Toronto: Canada-USSR Business Council. McMillan, Carl H. (1994): Foreign Investment in Russia: Soviet Legacies and Post-Soviet Prospects, Occasional Paper no. 5, Centre for Research on Canadian-Russian Relations, Carleton University, Ottawa, Canada. Meyer, Klaus E. (1995): Foreign Direct Investment in the Early Years of Economic Transition: A Survey, Economics of Transition 3, p. 31-320. Meyer, Klaus E. (1996): Direct Investment in East Asia and Eastern Europe: A Comparative Analysis. Working Paper no. 34, CISME Centre, London Business School, March. Meyer, Klaus E. (1998): Direct Investment in Economies in Transition, Aldershot: Elgar. Meyer, Klaus E. and Saul Estrin (1998): Opportunities and Tripwires for Foreign Investors in Eastern Europe, Thunderbird International Business Review, May/June. Murrell, Peter (1996): How far has the Transition Progressed? Journal of Economic Perspectives 10, no. 2, p. 25-44. Nove, Alec (1970): An Economic History of the U.S.S.R., London: Penguin. OECD (1994): Assessing Investment Opportunities for Foreign Investors in Eastern Europe, Paris: OECD. OECD (1997): International Direct Investment Statistics Yearbook, Paris: OECD. OECD (1997a): OECD Economic Surveys: Russian Federation, Paris: OECD. Pindyck, Robert S. (1991): Irreversibility, Uncertainty and Investment, Journal of Economic Literature 26, p. 1110-1148. Puffer, Sheila and Daniel J. McCarthy (1995): Finding the Common Ground in Russian and American Business Ethics, California Management Review 37, p. 29-46. Raiser, Martin (1997): Informal Institutions, social Capital and Economic Transition: Reflections on a Neglected Dimensions, Working paper no. 25, European Bank for Reconstruction and Development, December.
37
Rekve, Peter, Janat Syzdykov, and Jens Erik Torp 1998: Privatisation and the Role of the Foreign Investor. A pilot Study of the Kazakhstan Experience. Paper presented at the Conference "Privatisation, Enterprise Development and Change in Business Culture - the Kazakh Case in Perspective" in Almaty, Kazakhstan, June. Rugman, Alan and Alain Verbeke (1998): Multinational enterprises and Public Policy, Journal of International Business Studies 29, p. 115-136. Seyed-Mohamed, Nazeem et al. (1996): Exploring the Business Development process of Swedish Firms on the Baltic States and Poland, Journal of East-West Business 1, no. 4. Sheets, Nathan (1996): Capital flight from the Countries in Transition: Some Empirical Evidence, Journal of Policy Reform 1, p. 259-270. Sutton, Andrew (1968): Western Technology and Soviet Economic Development, 1917 to 1930, Stanford: Hoover Institution. Stern, Richard (1996): Policy Analysis of Foreign Direct Investment into the Russian Federation: A Study of the Current State of Affairs and Prospects for the Future, Institute for Advanced Studies, Vienna, Working Paper no. 34. Swetzer, Alexandra (1996): Foreign Investment and Economic Development in Tsarist Russia, in: P. Artisien-Maksimenko and Y. Adjubei, eds.: Foreign Investment in Russia and Other Soviet Successor States, Basingstoke: Macmillan. Thornton, Judith and Nadezhda N. Mikheeva (1996): The Strategies of Foreign and Foreign-assisted Firms in the Russian Far East: Alternatives to Missing Infrastructure, Comparative Economic Studies 38, no. 4. Tokmukhevoda, Zhulduz (1998): Privatization of the Downstream Refining Industry in Kazakhstan: Is it a solution? Paper presented at the Conference "Privatisation, Enterprise Development and Change in Business Culture - the Kazakh Case in Perspective" in Almaty, Kazakhstan, June. United Nations (1992): World Investment Directory, Geneva: UN United Nations Economic Commission for Europe, UNECE (1996): Economic Survey of Europe in 1996-97, Geneva: UN. U.S. Government (1997): FY 1998 Country Commercial Guides: Russian and the New Independent States of the Former USSR, http://www.state.gov/www/about_state/business/com_guides/ 1997/russia_nis/russia97.html, retrieved March 1998. World Bank (1992): Foreign Direct Investment in the States of the Former USSR, Studies of Economies in Transformation 5, Washington, DC: World Bank. World Bank (1993): Statistical Handbook of the States of the Former USSR, Washington, DC: World Bank. World Bank (1996): World Development Report 1997: From Plan to Market, New York: Oxford University Press. World Bank (1997): World Development Report 1997: The State in a Changing World, New York: Oxford University Press. Yegorov, Igor (1997): FDI in Ukraine: First Results, Tendencies and Prospects, mimeo, SPRU, University of Sussex, Brighton.
38
CEES Working Paper Series No. 1 May 1996
Peter Nørgaard Pedersen
Privatisation in Russia
No. 2 February 1997
Saul Estrin & Klaus Meyer
The East European Business Environment: Opportunities and Tripwires for Foreign Investors
No. 3 March 1997
Klaus Meyer
The Determinants of West-East Business: An Analysis of Ownership Advantages
No. 4 June 1997
Snejina Michailova
Bulgaria in the Process of Systemic Transformation An Overview.
No. 5 June 1997
Niels Mygind
Different Paths of Transition in the Baltics
No. 6 May 1997
Niels Mygind
The Economic Performance of Employee-owned Enterprises in the Baltic Countries
No. 7 June 1997
Klaus Meyer
Enterprise Transformation and Foreign Investment in Eastern Europe
No. 8 June 1997
Snejina Michailova
Interface between Western and Russian Management Attitudes: Implications for Organizational Change
No. 9 January 1998
Snejina Michailova & Graham Hollinshead
Developments in the Management of Human Resources in Eastern Europe -The Case of Bulgaria
No. 10 February 1998
Klaus Meyer & Inger Bjerg Møller
Managing Deep Restructuring: Danish Experiences in Eastern Germany
No. 11 March 1998
Patrick Arens
Strategic Decision Making in the Transitional Economy of Romania: The Case of TAMIV S.A.
No. 12 June 1998
Klaus Meyer
Multinational enterprises and the Emergence of Markets and Networks in Transition Economies
No. 13 June 1998
Klaus Meyer & Christina Pind
Ten Years of Direct Foreign Investment in the Former Soviet Union: A Survey with Special Focus on Kazakhstan
CEES working papers are published by the Center for East European Studies to promote the discussion on economic transition in Eastern Europe and beyond. They can be downloaded via the internet from the CEES homepages: www.econ.cbs.dk/institutes/cees. For further questions please contact Christina Pind (e-mail:
[email protected]; address: Dalgas Have 15, DK-2000 Frederiksberg, tel.: (45) 3815 3033, fax: (45) 3815 3037).
39