A FT-IR Spectroscopic Study of Phytoconstituents of Prepared Formulation of Arjuna (Terminalia arjuna Lin.) and Shilajatu. Satya Prakash Chaudhary1, Anurag ...
International Journal of Science and Research (IJSR)
ISSN (Online): 2319-7064 Index Copernicus Value (2015): 78.96 | Impact Factor (2015): 6.391
A FT-IR Spectroscopic Study of Phytoconstituents of Prepared Formulation of Arjuna (Terminalia arjuna Lin.) and Shilajatu Satya Prakash Chaudhary1, Anurag Mishra2, Kirtika3, Anil Kumar Singh4, K. N. Dwivedi5, B. Ram6 1, 2
Ph.D. scholar, Department of Dravyaguna, IMS, BHU, Varanasi-221005, India 3
M.Sc, Bioinformatics, MMV, BHU, Varanasi-221005, India
4, 5
Professor, Department of Dravyaguna, IMS, BHU, Varanasi-221005, India
6
Associate Professor, Department of Dravyaguna, IMS, BHU, Varanasi-221005, India
Abstract: In the present study we take a formulation of arjuna and shilajatu. The Fourier Transform Infrared (FT–IR) technique was employed to understand the composition, chemical structure and discrimination of biomolecules in Terminalia arjuna and shilajatu. The prepared samples were scanned in mid infrared region (4000–400cm–1) for IR spectroscopic studies. IR spectra thus obtained were analyzed to discriminating and identifying various functional groups present in the prepared formulation The appearance of bending/ stretching modes of various functional groups viz. alkyl, methyl, phenol, alcohols, ethers and carboxylic acids revealed the presence of several biomolecules, amino acids, tannins, flavonoids, amides, lignin, cellulose, hemicelluloses and polysaccharides comprising these groups. These polysaccharides are well known to have antioxidant, antitumor and immunity modulator actions. These polysaccharides also resist the damages due to harmful radiations. FT–IR spectroscopy has been proved an effective and sensitive assay for the detection of biomolecules contained in prepared samples. This reveals that the IR active phytoconstituents of arjuna and shilajatu. Keywords: Terminalia arjuna, shilajatu, FT–IR Analysis
1. Introduction In ancient days the drugs were prepared by the physician himself with the help of experienced assistants in the small pharmacy attached to his clinic over the centuries, the communication gap has tremendously reduced resulting in the large scale manufacturing and wide distribution of Ayurvedic drugs at national and international level. The increasing need for drugs have made it necessary that some sort of uniformity in the manufacturing of Ayurvedic medicines should be brought about. The need has also been felt for statutory control to ensure standards of Ayurvedic drugs in the modern sense. Considering the vast number of such drugs and heir formulations, is a time and money consuming tasks and will take considerable time for its achievements. Chemical study ensures not only chemical constituents but also tells us standards of any preparation. It not only gives the standards of the product but indirectly gives suggestions for further advancement if required. In the corporative era there is an exponential growth in the field of herbal and Ayurvedic medicine in the last few decades. It is getting popularized in developing as well in developed countries owing to its natural origin and side effects. In olden times, Vaidyas used to treat patients on individual basis, and prepare medicines according to the need of the patient. But the situation has changed now; Ayurvedic and herbal medicines are being manufactured on the large scale in Pharmaceutical units, where manufacturers come across many problems such as availability of good quality raw material, authentication of raw material, availability of standards, good standardization methodology
of single drugs and formulation, quality control. It is used by the local practitioners for the treatment of various disorders. The present study was conducted for the evaluation of FT– IR Analysis. The Fourier transform infrared (FT–IR) is one of the most widely used spectroscopic tools to identify the chemical constituents and to elucidate the structure of compounds. It has also been employed world-wide as a requisite method to identify medicines in Pharmacopoeia16. This technique is a well established time–saving method to characterize and to identify the functional groups which are known to be reflecting the fingerprint of a material on the basis of vibrational energy of a particular (bending/stretching) mode of chemical bonds present in the compound/ material obtained synthetically or some natural sources.[1,2,3,4] The active constituents of plants are the major source for the development of new chemotherapeutic agents. In the present investigations, the arjuna and shilajatu formulation are subjected to phytochemical screening by using FT-IR spectroscopic technique to identify phytoconstituents
2. Materials and Methods 2.1 Collection and Identification of Sample Fresh bark of arjuna was collected from the Ayurvedic garden of the Department of Dravyaguna, Faculty of Ayurveda, Institute of Medical Sciences, Banaras Hindu University (IMS-BHU) Varanasi-221005 (U. P.), India. Botanical identification of arjuna Bark was confirmed by the help of Prof. A.K.Singh, HOD of Dravyaguna.and shilajatu was collected for khadi bowali market of Delhi, which was confirmed by the help of Em. Prof. C.B.Jha, the Department
Volume 5 Issue 12, December 2016 www.ijsr.net
Licensed Under Creative Commons Attribution CC BY Paper ID: 29111604
48
International Journal of Science and Research (IJSR)
ISSN (Online): 2319-7064 Index Copernicus Value (2015): 78.96 | Impact Factor (2015): 6.391 of Rasa sashtra, Faculty of Ayurveda, Institute of Medical Sciences, Banaras Hindu University (IMS-BHU) Varanasi-
221005 (U. P.), India.
2.2 Sample Preparation
the mixer. The powder of shilajatu was store in airtight jar. And the ghankwath of arjuna was prepared Complete dry Arjuna also grind in the mixer and both powder was mix in mixer. The mix powder was store in airtight jar.
After purification of impure shilajatu we obtain the pure shilajatu. The pure shilajatu was completely dry in oven up to 60 0C for 5 to 7 days. After complete dry shilajatu grind in
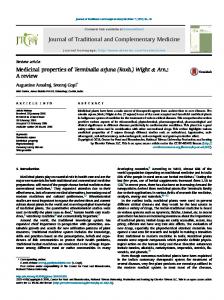
Figure 1: Prepared sample of Terminalia arjuna Lin. and shilajatu 2.3 Sample Characterization
3. Results
Fourier transformed infrared (FT–IR) spectrometer (Perkin Elmer spectrum 65, FT–IR spectrometer; Perkin Elmer). The FT–IR spectra of sample was recorded in the range 4000– 400 cm–1 to study the molecular structure of the sample prepared. The powder sample was diluted by KBr (materials: KBr =1:100) to form pellets for scanning through IR radiation. To improve the signal to noise ratio for each spectrum, 100 interferograms with a spectral resolution of ± 4cm–1 were averaged. Background spectra collected under identical conditions were subtracted from the sample spectra. Therefore, in the present study it is possible to directly relate the intensities of the absorption bands to the concentration of the corresponding functional groups. [3]
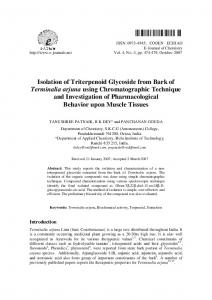
Figs. 2 exhibit the FT–IR spectra of the sample of prepared formulation. The results obtained in FT–IR spectra revealed the existence of various characteristic functional groups of different phytoconstituents contained in prepared formulation. Absorption bands at 3427, 2922, 1621,1402,1311,1042 and 508 cm–1 are found to be appearing in FT-IR spectra of prepared sample. Strong absorption bands are noticed at 3427 and 1621 cm–1 in IR of Prepared sample. A weak peak appears at 1402, 1311 and 1042cm–1 in Figure 2. Fig. also shows a very weak peak at 2922and 508 cm–1 in prepared sample. IR of powder sample contains two weak bands at 931 and 818 cm–1. All the IR active absorption bands of prepared sample are enlisted in Table 1 along with their assignments.
Volume 5 Issue 12, December 2016 www.ijsr.net
Licensed Under Creative Commons Attribution CC BY Paper ID: 29111604
49
International Journal of Science and Research (IJSR)
ISSN (Online): 2319-7064 Index Copernicus Value (2015): 78.96 | Impact Factor (2015): 6.391
Figure 2: Exhibits the FT–IR spectrum of Arjuna (Terminalia Arjuna Lin.) And Shilajatu Table 1: FT-IR active absorption bands of Arjuna (Terminalia Arjuna Lin.) and shilajatu with their assignments Peak positions in wave number (cm-1)
Peak positions in wavenumber (cm-1) 3427 2922 1621 1402 1311 1042 508
Assignments Stretching mode of N-H (Primary Amine / Aromatic Amine / Amids) / O-H (H-bonded) of phenolic compounds (Tannins/ Flavonoids) Stretching mode of C-H (Alkene) Stretching mode C=C (alpha- beta- unsaturated ketone) Stretching mode S=O, C-N (Sulfate / Primary Amine) Stretching mode C-N Aromatic Amine , CF3 attached to a benzenring p-o-c in organophosphorus compound anhydride/ ν(C-O) in cellulose and hemicelluloses and polysaccharides C-N-C in Amines
4. Discussion A strong band at 3427 cm-1 is recorded due to stretching mode of N-H (Primary Amine / Aromatic Amine vibration. Amine bonds play a major role in the elaboration and composition of biological systems, representing for example the main chemical bonds that link amino acid building blocks together to give proteins. Strong band at 1621 cm-1 is recorded is due to Stretching mode C=C (alpha- betaunsaturated ketone) A Weak peak appears at 1402 cm-1 is due to Stretching mode S=O, C-N (Sulfate / Primary Amine), 1311 cm-1 is due to Stretching mode C-N Aromatic Amine , CF3 attached to a benzenring,1042 cm-1 is due to po-c in organ phosphorus compound anhydride and a very
weak peak at 2922 cm-1 is due to Stretching mode of C-H (Alkene) and 508 cm-1 is due to cm–1 C-N-C in Amines.
5. Conclusion After thorough study of FT-IR of prepared sample of arjuna and shilajatu we came to conclusion that there is presence of various groups viz. phenol, methyl groups, carboxylic acid, polysaccharides, amide which may present due to several biomolecules; tannins/flavonoids, amino acids, fulvic acid, amides, lignin, and polysaccharides bearing these groups. Fourier transform infrared (FT–IR) spectroscopy has been found extremely advantageous and easy to identify the IR active phytoconstituents of mixture of arjuna and shilajatu . They lead to anti –inflammatory and antioxidant activity, tannins have anticancer, antidiabetic, antidiarrhoeal activity and improves intestinal disorder. Presence of methyl groups have activity on DNA and switch off to the cancer causing oncogenes. Polysaccharides have immuno - modulating activity, anticoagulant, hypoglycaemic and antiviral activity. So we can conclude that all these groups which are searched in FT-IR analysis of this formulation used as a medicine.
References [1] Saxena M, Saxena J. Evalution of phytoconstuents of Acorus Calmus by FT–IR and UV–Visible Spectroscopic Analysis. Internatinal Journal of Biological and Pharmaceutical Reearch, 2012; 3(3): 498–501. [2] Grube M, Muter O, Strikauska S, Gavare M, Limana B. Application of Ft–IR Spectroscopy for controlle of the medium composition during the biodegradation of nitro aramatiic compounds. Journal of Indian Microbiology and biotechnology, 2008; 35: 1545–1549.
Volume 5 Issue 12, December 2016 www.ijsr.net
Licensed Under Creative Commons Attribution CC BY Paper ID: 29111604
50
International Journal of Science and Research (IJSR)
ISSN (Online): 2319-7064 Index Copernicus Value (2015): 78.96 | Impact Factor (2015): 6.391 [3] Cakmak G, Togan I, Severcan F. 17 β–esteroidal induced compositional structural and functional changes in rainbow trout liver, revealed by FT–IR spectroscopy: A comparative study with nonyphenol. Aquatic Toxicology, 2006; 77: 53–63. [4] Sumathy C, Vijay Kumar N. Anti-Inflamatory activity and FTIR analysis on the ethanolic extract of Musa sapientum on experimental peptic ulcers in rats.WJPR, 2015; 4(7): 710- 721.
Volume 5 Issue 12, December 2016 www.ijsr.net
Licensed Under Creative Commons Attribution CC BY Paper ID: 29111604
51