International Journal of Biodiversity and Conservation Vol. 2(8) pp. 215-224, August 2010 Available online http://www.academicjournals.org/ijbc ISSN 2141-243X ©2010 Academic Journal
Full Length Research Paper
Biogeographic variation in Thecamoebian (Testate amoeba) assemblages in lakes within various vegetation zones of Alberta, Canada Lisa A. Neville1*, David G. Christie1, Francine M. G. McCarthy1 and Michael D. MacKinnon2 1
Department of Earth Studies, Brock University, St. Catharines, ON L2S 3A1, Canada. 2 Department of Earth Sciences, Carleton University, Ottawa, ON K1S 5B, Canada. 3 OSPM Solutions Ltd., 470 Beach Blvd. Hamilton, ON L8H 6X2, Canada. Accepted 7 May, 2010
Thecamoebians (testate amoebae) have proven to be valuable proxies commonly used in environmental and paleoenvironmental studies. A better understanding of their geographic distribution and environmental parameters influencing this distribution is required for further thecamoebian research. Thecamoebians were analyzed from twelve lakes spanning five drainage basins and four vegetation zones, representing a variety of environmental and limnological parameters in Alberta, Canada. Species diversity is low throughout the study sites, ranging from 1.35 to 2.17, with various strains of Difflugia oblonga, Centropyxis constricta and Centropyxis aculeata dominating the fauna. Climate, as reflected in the vegetation zones, appears to be an influencing factor on species and strain distributions. Lowdiversity assemblages strongly dominated by C. aculeata and C. constricta, characterize lakes in the rocky mountain region. Slightly, more diverse assemblages dominated by D. oblonga and Cucurbitella tricuspis characterize lakes in the grassland region. The highest thecamoebian diversity was found in both the Boreal Forest and Parkland zones. The Boreal Forest is dominated by D. oblonga together with C. constricta, C. tricuspis and C. aculeata, while the Boreal Parkland is dominated by D. oblonga along with C. constricta and C. aculeata. Key words: Thecamoebians, Testate amoebae, biogeographic, Alberta.
INTRODUCTION Thecamoebians (also called Testate amoebae) are protists belonging to the phylum Sarcodaria, superclass Rhizopoda. They are a diverse and important component of the microbial trophic level within the benthic community of lakes and wetlands, where they play a critical role in food webs as the intermediate between bacterial and benthic invertebrate communities (Patterson and Kumar, 2002; Beyens and Meisterfeld, 2001). These benthic protozoans, particularly those belonging to the Order Thecolobosa (Arcellinida), superfamily Arcellacea, produce a fossilizable test (shell) of pseudo-chitinous material that is variably agglutinated by different species (Medioli and Scott, 1983). The variable agglutination allows for the differential identification of species and
*Corresponding author. E-mail:
[email protected].
strains. After death, their tests fossilize and are found in all aquatic and moist terrestrial sediments, although the preservation potential varies between species (Boudreau et al., 2005; Patterson and Kumar, 2002). In lacustrine studies, thecamoebians have been successfully applied traditionally to paleoclimatic reconstructions (Boudreau et al., 2005; McCarthy et al., 1995; Patterson and Kumar 2002) and have been more recently used to investigate the impact of sulphide, silver (Reinhardt et al., 1998) and pyrite (Kumar and Patterson, 2000) mining in acid-sensitive lakes in Ontario (Patterson et al., 1996; Reinhardt et al., 1998; Kumar and Patterson, 2000; Patterson and Kumar, 2002; Roe et al., 2010). Also, they have shown usefulness in following aquatic reclamation development at an oil sands facility in northeastern Alberta (McCarthy et al. 2008; Neville, 2010). Processing of sediments for thecamoebian analysis typically follows one of two protocols depending on the
216
Int. J. Biodvers. Conserv.
type of research. One group of researchers follows the “lacustrine”/ “micopaleontological” method (Scott et al., 2001), while the other group follows the “wetland”/ “biological” method of sediment processing (Hendon and Charman, 1997; Tolonen, 1966 and 1986; Warner, 1990). Both methods produce viable numbers of thecamoebians, but unfortunately they do not observe the same species, so researchers cannot compare results. Climate (Collins et al., 1990; McCarthy et al., 1995; Yang et al., 2006; Neville et al. 2010) and lake trophic status (Yang et al., 2009) have been identified as major factors that can be used to explain biogeographic distribution of thecamoebian taxa. The distributions of testate amoebae in wetlands have been well examined globally (Smith 1982, 1996; Wilkinson, 1994; Mitchell et al., 2000; Booth and Zygmunt, 2005), however, few studies have examined the biogeographic distribution of thecamoebians in lakes. The investigation of thecamoebians in lakes employs the “lacustrine”/ “micopaleontological” method of thecamoebian processing. In China, Yang et al. (2005; 2006; 2009) investigated distributional factors related to the Yunnan Plateau. North American studies include broad transects along eastern North America (Collins et al., 1990), lake Erie (Scott and Medioli, 1983) and small lakes in New Brunswick, Nova Scotia and Newfoundland (Patterson et al., 1985; Honig and Scott, 1987; McCarthy et al., 1995). To date, the only distributional study of thecamoebians in Alberta was carried out by Booth and Zygmunt (2005), who use the “wetland”/ “biological” method of sediment processing. Due to the widespread distribution of thecamoebians, Booth and Zygmunt (2005) suggest that dispersal pat-terns are primarily controlled by local environmental conditions. This study compares both the thecamoebian and limnological data to investigate the parameters controlling thecamoebian distribution in natural aquatic systems in Alberta, Canada. Lakes that date back to deglaciation less than 12,000 years ago, are most abundant where the water budget is positive, but are also present even in the most arid region in southeastern Alberta and were included in this study (Figures 1 and 2). The atlas of Alberta Lakes (Crosby et al., 1990) was used to choose sites from a variety of geographical settings representing a range of environmental parameters, including precipitation, temperature, evaporation, water budget, elevation, bedrock geology, surficial sediment and trophic status. The distribution of the lakes studied, ranged norto o heast-southwest from Gregoire Lake (56 27′N, 110 0o o 9′W) to the Spray Lakes Reservoir (50 54′N, 115 20′W). METHODOLOGY Sediment samples were collected from 13 locations across the province of Alberta, from four different vegetation zones (Rocky Mountain, Boreal Forest, Boreal Parkland and Grassland; Dyke et al., 2004) (Table 1, Figure 1) and five different drainage basins (Athabasca River, North Saskatchewan River, Battle River, Red Deer River and Bow River basins) (Table 1). Duplicate samples
(two samples per lake) of approximately 200 mL of surface sediment were collected from each lake over a nine-day period in July 2008, using an Ekman grab sampler. Duplicate samples were collected from within 1 m of each. Water samples (~200 mL) were also collected from each site for later analysis. Field measurements of temperature and conductivity (uS/cm) were taken using a Hach Hydromet and dissolved oxygen (DO) at the sediment water interface was measured using a Hydrolab. To avoid complications introduced by lake stratification (Cole, 1979), all lakes were sampled within the first two meters of the shoreline. The sediment samples were transferred to glass jars and were stored at 4°C prior to shipping to Brock University for thecamoebian analysis. The water samples were transported to Syncrude Canada Ltd. (SCL) Edmonton Research facility where water analysis, including conductivity, pH, major ions, trace metals, ammonia and naphthenic acids, was performed using SCL standard analytical protocols (Syncrude, 2005). Samples were prepared for thecamoebian analysis following the standard micropaleontological methods described in Scott et al. (2001). Subsamples of 5cc were sieved through 500, 63 and 45 µm mesh. Samples were stained with Rose Bengal to determine the presence of cytoplasm in the tests (Scott and Medioli, 1980; Bernhard, 2000). Tests stained using this method are generally reported to have been living at or shortly before the time of collection, while unstained tests indicate that the organism has died and is fossilized. Bernhard et al. (2006) have called this conclusion to question, proposing a new technique, which has not yet become standard (Bernhard et al., 2006). For quantitative analysis, the samples were placed in a gridded Petri dish and wet-counted using a dissecting binocular microscope. Thecamoebians were identified to species and strain, primarily using the key by Kumar and Dalby (1998), although reference was also made to photoplates and descriptions in various publications, notably Medioli and Scott (1983). Specimens were identified and species diversity was calculated using strains because strains have been found to convey useful information on aquatic subenvironments (Kumar and Patterson, 2000; Kauppila et al., 2006). Twelve lakes contained sufficient numbers of thecamoebian tests allow for meaningful comparisons of assemblages. For statistical analysis, the absolute number of specimens examined, ranges from 200 to 1,000 per sample, although most researchers generally count approximately 300 specimens (Patterson and Fishbein, 1989). When the number of thecamoebians counted in the 5cc subsample did not reach 300, an additional 5cc subsample was processed and counted. Species diversity was calculated using the Shannon-Weaver diversity index (SDI) (Shannon and Weaver, 1949). SDI is a measure of faunal diversity and is useful for indicating the relative health of the community from which the sample was taken. Harsh, unfavorable environmental conditions are normally characterized with an SDI between 0.5 –1.5, intermediate conditions range from 1.5 - 2.5 and favorable/stable conditions have an SDI >2.5 (Patterson and Kumar, 2002). The SDI is calculated using the following formula, where S is the species richness for each sample: S Fi Fi SDI = −∑ * ln Ni Ni I
The relative fractional abundance (Fi) was calculated for each taxonomic unit using:
Fi =
Ci Ni
where Ci is the species count and Ni is the number of individuals
Neville et al.
Figure 1. Map of Alberta illustrating the natural region (vegetation zone) boundary divisions and the locations of the study sites within each zone.
217
218
Int. J. Biodvers. Conserv.
Figure 3. Bi-plot of canonical correspondence analysis (CCA) of vegetation zones, environmental and chemical variables and species observed throughout the study. RM=Rocky Mountain, BP=Boreal Parkland, BF=Boreal Forest, Grass=Grassland, Hard=water hardness, Precip=precipitation, W Temp=water temperature, A Temp=air temperature, Evap=evaporation, DO=dissolved oxygen, Con=conductivity (values located in Table 2 and 4). Species name abbreviations can be found in Table 5.
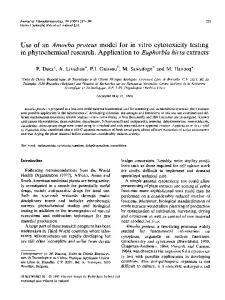
Figure 2. Pie graphs representing thecamoebian community composition within each vegetation zone.
(total population) in the sample (Patterson and Fishbein, 1989). Data analysis was performed using Minitab version 15 (Minitab Inc. USA). Canonical correspondence analysis (CCA) was used to analyze population relationships among lakes. Data input included chemical and environmental parameters as well as thecamoebians abundances by vegetation zone.
RESULTS AND DISCUSSION Climate regions can be identified from the vegetation zones (Table 1), which are a composite of temperature and precipitation together with non-climatic parameters like soil type. Mean annual temperature did not vary greatly across the study area, except for the high altitudes of the Rocky Mountain region, which were substantially cooler (Table 1). Lakes within each vegetation zone are seemingly very different from each other in
terms of chemical composition and trophic status. However, a comparison of thecamoebian assemblages in lakes studied within each vegetation zone generated Pvalues greater than 0.05, suggesting no significant difference between lakes within each zone. There was also no significant difference (P-values greater than 0.05) between duplicate samples collected from the same lake. Yang et al. (2009) suggested that trophic status was the main factor driving thecamoebian distribution in lakes in China however that correlation was not observed in Alberta (Tables 1 and 2). Low-diversity assemblages (shannon diversity index (SDI) av 1.36) strongly dominated by Centropyxis aculeata and Centropyxis constricta with few Difflugia oblonga characterized both lakes in the Rocky Mountain region (Tables 2 and 3, Figure 3). These lakes contained the highest centropyxid/difflugiid ratio of lakes investigated as part of this study (Table 2). Collins et al. (1990) found centropyxids to be ubiquitous across eastern North America, from Florida to Baffin Island. Booth and Zygmunt (2005) also observed low species diversity in the Rocky Mountain region, but further comparison of the research results
Neville et al.
219
Table 1. General characteristics of study sites including site locations, dates sampled, drainage basins and trophic status (Crosby et al., 1990). Sites are grouped by vegetation zone.
Date sampled
Latitude
Spray lakes reservoir Jasper
25/07/08 24/07/08
N50°54′ N52°56′
Baptiste lake Island lake Gregoire lake Lac St. Anne Wabamun lake
Longitude
Trophic status
Drainage basin
W115 20′ o W118 01′
Hypereutrophic -
Bow river Bow river
19/07/08 21/07/08 21/07/08 18/07/08 18/07/08
Boreal forest o N54°45′ W113 33′ o N54°51′ W113 32′ o N56°27′ W110 09′ o N53°42′ W114 25′ o N53°33′ W114 36′
Hypereutrophic Mesotrophic Eutrophic Eutrophic Eutrophic
Athabasca river Athabasca river Athabasca river North Saskatchewan R. North Saskatchewan R.
Isle lake Buffalo lake Miquelon lake
19/07/08 27/07/08 27/07/08
Boreal parkland o N53°38′ W114 44′ o N52°28′ W112 54′ o N53°21′ W112 55′
Hypereutrophic Mesotrophic -
North Saskatchewan R. Red deer river Battle river
Chestermere L. Eagle lake
27/07/08 27/07/08
Grassland o N51°02′ W113 49′ o N51°00′ W113 19′
Mesotrophic Hypereutrophic
Bow river basin Bow river basin
Rocky mountain o
Table 2. Summary of limnological and micropaleontological data for each study site. Sites are grouped by vegetation zone.
Lake temp (°C)
Mean annual precip. (mm)
Mean annual evap. (mm)
Mean temp (°C)
Total # tests (N)
# of species (S)
% of total tests centropxids
Ratio of cent/diff
SDI
Rocky mountain Spray Lakes Reservoir Jasper
18.6
622
621
7.5
321
5
71
2.45
1.36
18.4
620
620
8
303
4
84
5.3
1.35
Boreal forest Baptiste L. Island L. Gregoire L. Lac St. Anne Wabamun L.
22.1 24.0 24.1 16.6 23.2
493 539 504 549 534
638 638 580 642 642
12 12 12 12 12
293 356 312 346 574
9 8 7 9 17
56 35 38 44 28
1.27 0.55 0.61 0.79 0.39
1.83 1.68 1.68 1.78 2.17
Boreal parkland Islet L. Buffalo L. Miquelon L.
21.5 24.2 24.2
423 413 466
660 665 664
14 13 13
417 372 279
6 7 7
69 50 46
2.1 0.95 0.86
1.62 1.80 1.38
Grassland Chestermere L. Eagle L.
20.6 21.8
416 376
712 712
12.5 12.5
351 375
6 9
0 6.4
0 0.07
1.46 1.66
220 Int. J. Biodvers. Conserv.
Table 3. Water chemical analysis for each site, showing water hardness, major ions and metals. Sites are grouped by vegetation zone.
Spray lakes Jasper
pH
Cond. (µ µS/cm)
DO sed/ water interface (mg /L)
7.69 7.59
285 420
7.6 6.6
Hardness Na (mg/L as CaCO3) Rocky mountain 147 2.0 212 4.6
K
Mg
Ca
Cl
1.0 0.5
10.5 18.8
41 54
0.9 6.7
SO4
CO3
HCO3
38 70
0 0
145 175
Baptiste lake Island lake Gregoire lake Lac St. Anne Wabamun lake
8.06 7.32 7.23 7.81 8.06
340 459 147 343 570
12.7 3.9 7.2 8.5 9.8
Boreal forest 117 155 66 122 136
Islet lake Buffalo lake Miquelon lake
7.50 8.75 9.32
318 2350 2690
2.8 10 5.7
Boreal parkland 139 304 726
12 486 356
13 39 63
19.7 66 145
23 11 49
6.0 20 31
9 402 1240
0 117 68
186 915 106
3.2 8
Grassland 164 279
25 269
1.0 16
17.4 55.9
37 19
9.7 52
70 348
0 83
149 355
Chestermere L. Eagle lake
8.23 9.09
400 1548
taxa (Difflugia urens and urceolata) produce higher diversity assemblages (SDI 1.38-1.80, av. 1.60) than in the Grasslands (Tables 2 and 3, Figure 2). Several strains of C. constricta and aculeata typically codominate the with theirs is impeded by the different protocols used for thecamoebian analysis. Booth and Zygmunt (2005) processed their samples using the protocol and taxonomy favored by wetland researchers (Hendon and Charman, 1997; Tolonen, 1966 and 1986; Warner, 1990), in producing very different assemblages. Lakes in the Grassland region contained slightly more diverse assemblages (SDI= 1.56) dominated by various strains of D. oblonga and Cucurbitella tricuspis. Pontigulasia compressa and Difflugia urceolata were also present in both lakes in the Grassland region (Tables 2 and 3, Figure 2). In these lakes, centropyxids comprised less than 10% of the thecamoebian population (Table 2). Several strains of D. oblonga are important components of the assemblage in the Boreal Parkland zone, while C. tricuspis is only present in low quantities. The codominance of C. aculeata and C “aerophila” with D. oblonga and the occasional occurrence of other difflugiid Boreal Forest zone, with various strains of D. oblonga also abundant. C. tricuspis is a more common constituent in the Boreal Forest than in the Parkland and P. compressa, Arcella vulgaris and D. urceolata are also consistently present in the Boreal Forest, unlike in the Parkland (Table 3, Figure 2). The Boreal Forest contains the highest thecamoebian diversity (SDI 1.68-2.17, av. 1.83)
32 44 3.9 30 78
5.1 10 1.0 11 11
13.1 21.8 5.0 12.5 20.5
25 26 18 28 20
4.0 8.9 2.1 7.7 13
15 6 7 15 85
0 0 0 0 0
196 304 75.6 196 251
found in this study. The chemical and physical properties of the lakes studied were examined using CCA to see which properties mostly affected the thecamoebian distribution (Figure 3). Most of Alberta, experiences a negative water budget (Crosby et al., 1990), except for the Rocky Mountain region, which is slightly positive. Several of the lakes, particularly in the Boreal Parkland and Grasslands have high concentrations of ions or conductivities related to the high evaporative potential (Table 4). The CCA analysis revealed that no specific chemical nor environmental parameter overwhelmingly influenced the distribution of thecamoebians within the given vegetation zones. Interestingly, water hardness clusters with the main environmental parameters which are not often referred to in the literature. Hard water is one that has a high content 2+ 2+ of calcium (Ca ) and magnesium (Mg ) and in the Alberta lakes, these ions were balanced by either carbonate or sulphate ions. Chloride levels at all locations were relatively low so that this ion represented only a small fraction of the total anions. Sodium was low at most sites, except for two of the Boreal Parkland lakes (Buffalo and Miquelon Lake) and a Grassland lake (Eagle Lake) where the elevated sulphate ions were balanced predominantly by sodium rather than the calcium and magnesium. These lakes also had the highest conductivities. For this study, calcium and magnesium were used to calculate hardness, which has been expressed in terms of CaCO3 (Table 4, Figure 3). Except for the three lakes
Neville et al.
Table 4. Percent abundance (% A), standard error (error), test per cc and sum of thecamoebians observed at each study location.
Sample Sum Individuals/cc
Arcella vulgaris (Av) Centropyxis aculeata (Ca) Centorpyxis aculeata "discoides" (Cad) Centropyxis constricta "aerophila" (Cca) Centropyxis constricta "constricta" (Ccc) Lesquereusia spiralis (Ls) Pontigulasia compressa (Pc) Cucurbitella tricuspis (Ct) Lagenodifflugia vas (Lv) Difflugia protaeiformis "claviformis" (Dpc) Difflugia bidens (Db) Difflugia corona (Dc) Difflugia urceolata "urceolata" (Duu) Difflugia urceloata "elongata" (Due) Difflugia oblonga “glans” (Dog) Difflugia oblonga "lanceolata" (Dol) Difflugia oblonga "oblonga" (Doo) Difflugia oblonga "tenuis" (Dot)
Spray lakes 321 32 %A 28.97 42.06 3.74 9.35 15.89 -
Error 4.96 5.40 2.08 3.18 4.00 -
Jasper 303 30 %A 20.79 30.69 32.67 15.84 -
Baptiste lake 293 29
Error 4.57 5.19 5.28 4.11 -
%A 0.68 13.65 34.13 7.51 17.06 1.02 4.78 7.51 13.65 -
Error 0.94 3.93 5.43 3.02 4.31 1.15 2.44 3.02 3.93 -
Island Lake 356 36 %A 13.48 21.91 9.55 1.12 2.81 10.11 38.20 2.81
Error 3.55 4.30 3.05 1.09 1.72 3.13 5.05 1.72
Gregoire lake 312 31
Lac St. Anne 346 34
Wabamun lake 574 57
%A 6.73 9.62 21.47 10.26 6.73 39.42 5.77 -
%A 1.16 1.73 14.74 26.59 2.31 19.94 0.58 21.10 11.85 -
%A 1.05 2.44 11.15 3.83 9.76 0.52 2.09 6.62 0.70 1.74 1.05 1.92 0.70 32.06 18.29 2.96 3.14
Error 2.78 3.27 4.56 3.37 2.78 5.42 2.59 -
Error 1.13 1.38 3.74 4.66 1.58 4.21 0.80 4.30 3.41 -
Error 0.83 1.26 2.57 1.57 2.43 0.59 1.17 2.03 0.68 1.07 0.83 1.12 0.68 3.82 3.16 1.39 1.43
Table 4. Contd.
Sample Sum Individuals/cc
Arcella vulgaris (Av) Centropyxis aculeate (Ca) Centropyxis aculeata "discoides" (Cad) Centropyxis constricta "aerophila" (Cca)
Islet lake 425 43 %A 1.88 7.76 22.88 36.00
Error 1.29 2.54 4.56 4.56
Buffalo lake 385 38 %A 3.38 17.14 29.05
Error 1.80 3.76 4.69
Miquelon lake 304 30 %A 8.22 27.30 10.86
Error 3.09 5.01 3.50
Chestermere lake 351 35 %A -
Error -
Eagle lake 375 38 %A 1.60 1.60
Error 1.27 1.27
221
222 Int. J. Biodvers. Conserv.
Table 4. Contd.
Centropyxis constricta "constricta" (Ccc) Lesquereusia spiralis (Ls) Pontigulasia compressa (Pc) Cucurbitella tricuspis (Ct) Lagenodifflugia vas (Lv) Difflugia protaeiformis "claviformis" (Dpc) Difflugia protaeiformis "acuminata" (Dpa) Difflugia bidens (Db) Difflugia corona (Dc) Difflugia urens (Du) Difflugia urceolata "urceolata" (Duu) Difflugia urceloata "elongata" (Due) Difflugia globula (Dg) Difflugia oblonga “glans” (Dog) Difflugia oblonga "lanceolata" (Dol) Difflugia oblonga "bryophila" (Dob) Difflugia oblonga "oblonga" (Doo) Difflugia oblonga "tenuis" (Dot)
7.76 9.88 14.82 -
above, the pH of the various water sources were less than 8.2, which meant that bicarbonate was the main carbonate ion present. Patterson et al. (1985) and Escobar et al. (2008) suggest pH and other water properties to be more influential than climate on the distribution of thecamoebians, but the research findings did not suggest that climate had any more control on distribution than water properties (Figure 3). In contrast to the research findings, in which DO cluster with all other parameters, Smirnov and Thar (2003) suggest that dissolved oxygen does not influence thecamoebian distribution, however many other authors suggest that certain species are very sensitive to dissolved oxygen content (Asioli et al., 1996; Scott and Medioli 1983). Inaddition, recent work by Roe at al. (2010) also
2.54 2.84 3.38 -
10.13 6.23 12.47 18.92 4.68
3.01 2.42 3.30 3.83 2.11
0.66 0.33 4.28 40.79 7.57 -
0.91 0.64 2.27 5.52 2.97 -
found dissolved oxygen to be an important influencing variable. The Boreal Parkland contained the highest proportion of A. vulgaris which is possibly related to the overall high chemical composition, notably conductivity in two of the three lakes found in this region. A. vulgaris is typically considered an indicator of extremely unfavorable environmental conditions. It has been found in low pH, high chemical content environments (Boudreau et al., 2005; Patterson et al., 2000), as well as industrially impacted environments contaminated with Ag, Hg (Patterson et al., 1996) and those associated with oil sands process affected material, created by oil sands mining activity in Northern Alberta (Neville et al., 2010). C. aculeata and C. constricta are typically considered opportunistic (Boudreau et al., 2005)
5.98 45.30 5.13 5.13 17.09 21.37 -
2.48 5.21 2.31 2.31 3.94 4.29 -
3.20 2.40 28.80 5.60 5.60 36.80 14.40
1.78 1.55 4.58 2.33 2.33 4.88 3.55
and tolerant of harsh environmental conditions including cold temperatures, marginally brackish waters and low nutrient availability (Collins et al., 1990; McCarthy et al., 1995) and are the dominant species in many modern Arctic lakes (Collins et al., 1990). C. aculeata and C. constricta were present in high numbers in the Boreal Forest and Parkland and dominated the Rocky Mountain thecamoebian community composition (Table 4). This is likely related to the low temperatures and concentrations of all chemical constituents found in the Rocky Mountain region (Table 3 and 4). D. oblonga was common in all the vegetation zones. It can thrive in almost any climate and tolerates climate extremes, including extreme cold as long as the sediment is sufficiently organic (Collins et al., 1990; McCarthy et al., 1995). The proportion
Neville et al.
223
Table 5. The total number of tests (number of stained tests, interpreted as indicating the presence of cytoplasm in the test at the time of collection) and relative abundance of common thecamoebian species from each vegetation zone.
Rocky mountain Total # of % of tests fauna stained (# stained) A. vulgaris C. aculeata C. constricta D. oblonga D. urceolata C. tricuspis D. bidens P. compressa Other difflugiids
0 (0) 249 (59) 234 (47) 129 (13) 0 (0) 12 (0) 0 (0) 0 (0) 0 (0)
0 24 20 10 0 0 0 0 0
Boreal forest Total # of % of tests fauna (# stained) stained 31 (0) 0 265 (63) 24 437 (93) 21 833 (106) 13 53 (5) 9 219 (50) 23 12 (0) 0 26 (0) 0 5 (0) 0
of the population composed of stained (living) tests remained relatively consistent and comprised only a small portion of the population in comparison to the total (stained + unstained) number of tests observed (Table 5). Hence, total populations were used to define assemblages as outlined by Patterson et al. (1985). Total populations include both stained and un-stained specimens, giving an indication of time-averaged environmental conditions, while living populations only indicate conditions at the time of collection. The total population has been shown to be a good indicator of long-term (duration observed depends on sedimentation rate) as opposed to seasonal conditions (Scott and Medioli, 1980). High percentages of stained C. tricuspis were found in the Boreal Parkland and Grassland zones, and the only stained specimens of D. bidens were found in the Grassland. 50% of the D. bidens observed in the grassland region were alive. D. bidens occurs in environments with increased terrigenous sediment input and high percentages sediment of organic matter (Patterson et al., 1996).
Boreal parkland Total # of % of tests fauna (# stained) stained 44 (3) 227 (24) 234 (43) 541 (105) 3 (0) 49 (33) 6 (0) 0 (0) 10 (2)
7 11 18 19 0 67 0 0 20
Grassland Total # of % of tests fauna stained (# stained) 0 (0) 6 (0) 18 (0) 327 (45) 39 (0) 267 (120) 18 (9) 30 (0) 21 (0)
0 0 0 14 0 45 50 0 0
may be of importance to thecamoebian distribution. Future research should include grain size distribution in order to understand better thecamoebian distributional controlling factors. Understanding environmental controls and the parameters influencing thecamoebian distribution at broader spatial scales will improve our ability to interpret fossil thecamoebian records. The centropyxid/difflugiid ratio appears to be a simple way of identifying a stressed environment. It is a tool that can potentially be expanded to assess stressors to the environment in mining municipal runoffs, oilsands etc. Knowing the natural population stressors may allow us to better develop and increase the sensitivity of this community to follow environmental changes both in terms of degrading (pollution) and improving (reclamation) and increase the likelihood of using thecamoebians as bioindicators during remediation and reclamation efforts, such as those taking place in the Athabasca Oil Sands of Alberta (McCarthy et al., 2007; 2008; Neville, 2010).
ACKNOWLEDGMENTS Conclusion Thecamoebian communities are relatively different in most lakes across Alberta. Chemically, each lake is unique with no trends in terms of major ions across vegetation zones. When thecamoebian populations of lakes are grouped in terms of vegetation zones, identifiable populations appear. In an attempt to establish parameters influencing thecamoebian population distribution in relation to vegetation zones, environmental (temperature and precipitation) and chemical parameters were investigated. This study did not identify any specific population influencing parameters, as all parameters analyzed clustered together. This suggests that the biogeography of the drainage basin and sediment input
This project was partly funded by a Brock University research grant. Logistical support and water analysis were provided by the Edmonton Research Centre of Syncrude Canada Ltd. and their input was greatly appreciated.
REFERENCES Asioli A, Medioli FS, Patterson RT (1996). Thecamoebians as a tool for reconstruction on paleoenvironments in some Italian lakes in the foothills of the southern Alps (Orta Varese and Candia). J. Foraminiferal Res., 26: 248-263. Bernhard JM (2000). Distinguishing live from dead foraminifera: methods review and proper applications, Micropaleontol., 46:(1): 3846.
224 Int. J. Biodvers. Conserv.
Bernhard JM, Ostermann DR, Williams DS, Blanks JK (2006). Comparison of two methods to identify live benthic foraminifera: A test between Rose Bengal and CellTracker Green with implications for stable isotope paleoreconstructions. Paleoceanography, 21: 1-8. Beyens L, Meisterfeld R (2001). Protozoa: Testate amoebae. pp. 121153. In Smol, J.P., Birks, H.J.B., Last, W.M (Eds). Tracking Environmental Change Using Lake Sediments. 3: Terrestrial, Algal, and Siliceous Indicators. Kluwer Academic Publishers. The Netherlands. Booth RK, Zygmunt JR (2005). Biogeography and comparative ecology of testate amoebae inhabiting Sphagnum- dominated peatlands in the Great Lakes and Rocky Mountain regions of North America. Divers. Dis., 11: 577- 590. Boudreau EA, Galloway JM, Patterson RT, Kumar A, Michel FA (2005). A paleolimnological record of Holocene climate and environmental change in the Temagami region, northeastern Ontario. J. Paleolimnol., 33: 445-461. Crosby JM, Bradford ME, Mitchell PA, Prepas EE, McIntyre LG, Hart Buckland-Nicks L, Hanson JM (1990). Atlas of Albert Lakes. Mitchell, P., Prepas, E. (Eds). The University of Alberta Press. Edmonton, Alberta. Collins ES, McCarthy FMG, Medioli FS, Scott DB, Honig CA (1990). Biogeographic distribution of modern thecamoebians in a transect along the Eastern North American coast. In C. Hemleben and others (Eds). Paleoecology, Biostratigraphy, Paleoceanography and Taxonomy of Agglutinated Foraminifera Kluwer Academic Publishers. Amsterdam, pp. 783-792. Dyke AS, Giroux D, Robertson L (2004). Vegetation History, Glaciated North America. Geological Survey of Canada, Open File. Escobar J, Brenner M, Whitmore TJ, Kenny WF, Curtis JH (2008). Ecology of testate amoebae (thecamoebians) in subtropical Florida lakes. J. Paleolimnol., 40(2): 715-731. Hendon D, Charman DJ (1997). The preparation of testate amoebae (Protozoa: Rhizopoda) samples from peat. The Holocene, 7: 199205. Honig CA, Scott DB (1987). Postglacial stratigraphy and sea-level change in southern New Brunswick. Canadian J. Earth. Sci. 24: 354364. Kauppila T, Kihlman S, Makinen J (2006). Distribution of Arcellaceans (testate amoebae) in the sediments of a mine water impacted bay of lake Retunen, Finland. Water, Air, Soil. Pollution, 172: 337-358. Kumar A, Dalby AP (1998). Identification Key for Holocene Lacustrine Arcellacean (Thecamoebian) Taxa. Paleontological Society. Kumar A, Patterson RT (2000). Arcellaceans (thecamoebians): new tools for monitoring long- and short-term changes in lake bottom acidity. McCarthy FMG, Collins ES, McAndrews JH, Kerr HA, Scott DB, Medioli FS (1995). A Comparison of Postglacial Arcellacean (“Thecamoebian”) and Pollen Succession in Atlantic Canada, Illustrating the Potential of Arcellaceans for Paleoclimatic Reconstruction. J. Paleontol. 69: 980-993. McCarthy FMG, Neville LA, MacKinnon MD (2007). Evaluating the potential of thecamoebians (testate amoebae) as proxies of ecosystem health in the Oil Sands wetlands. Report prepared for Syncrude, Canada Ltd. McCarthy FMG, Neville LA, MacKinnon MD (2008). Annual variations in the Suncor Experimental Wetlands and seasonal variations in thecamoebian assemblages in Syncrude’s BPIT test site: implications for biomonitoring. Report prepared for Syncrude Canada Ltd. Medioli FS, Scott DB (1983). Holocene Arcellacea (Thecamoebians) from Eastern Canada. Cushman Foundation for Foraminiferal Research, Special Publication p. 21. Mitchell EAD, Buttler A, Grosvernier P, Rydin H, Albinsson C, Greenup AL, Heijmans MMPD, Hoosbeek MR, Saarinen T (2000). Relationships among testate amoebae (Protozoa), vegetation and water chemistry in five Sphagnum-dominated peatlands in Europe. New Phytologist, 146: 95-106. Neville LA (2010). Investigating the Potential of Thecamoebians (Testate Amoeba) as Bio-indicators of impact of Oil Sands Mining Operations on freshwater environments in Northeastern Alberta, Canada. MSc thesis, Brock University, St. Catharines, ON.
Neville LA, McCarthy FMG, MacKinnon MD (2010). Seasonal environmental and chemical impact on thecamoebain community composition in an oil sands reclamation wetland in northern Alberta. Palaeontologia Electronica 13: 14. Patterson RT, Fishbein E (1989). Re-examination of the statistical methods used to determine the number of point counts needed for micropaleontological quantitative research. J. Paleontol. 63: 245248. Patterson RT, Kumar A (2002). A review of current testate rhizopod (thecamoebian) research in Canada. Palaeogeography, Palaeecolimatol.Palaeoecol., 180: 225-251. Patterson RT, Barker T, Burbidge SM (1996). Arcellaceans (thecamoebians) as proxies of arsenic and mercury contamination in northeastern Ontario lakes. J. Foraminiferal. Res. 26: 172-183. Patterson RT, Guilbault JP, Thomson RE (2000). Oxygen control on foraminiferal distribution in Effingham Inlet, Vancouver Island, British Columbia, Canada, J. Foraminiferal. Res., 30: 321-335. Patterson RT, MacKinnon KD, Scott DB, Medioli FS (1985). Arcellaceans (“Thecamoebians”) in small lakes of New Brunswick and Nova Scotia: modern distribution and Holocene stratigraphic changes. J. Foraminiferal. Res. 15: 114-137. Reinhardt EG, Dalby PA, Kumar A, Patterson T (1998). Arcellaceans as pollution indicators in mine tailing contaminated lakes near Cobalt, Ontario, Canada. Micropaleontol. 44: 131-148. Roe HM, Patterson RT, Swindles GT (2010). Controls on the contemporary distribution of lake thecamoebians (testate amoebae) within the Greater Toronto Area and their potential as water quality indicators. J. Paleolimnol. 43: 955-975. Scott DB, Medioli FS (1980). Living vs. total foraminiferal populations: their relative usefulness in paleoecology. J. Paleontol. 4: 814-831. Scott DB, Medioli FS (1983). Agglutinated rhizopods in Lake Erie: modern distribution and stratigraphic implications. J. Paleontol. 4: 809-820. Scott BD, Medioli FS, Schafer CT (2001). Monitoring in Coastal Environments Using Foraminifera and Thecamoebian Indicators. Cambridge University Press. Cambridge p. 177. Shannon CE, Weaver W (1949). The Mathematical Theory of Communication: University of Illinois Press, Urbana p. 55. Smith HG (1982). The terrestrial protozoan fauna of South Georgia. Polar. Biol. 1: 173-179. Smith HG (1996). Diversity of Antarctic terrestrial protozoa. Biodiversity Conser. 5: 1379-1394. Smirnov A, Thar R (2003). Spatial distribution of Gymnamoebae (Rhizopoda, Lobosea) in brackish-water sediments at the scale of centimeters and millimeters. Protist 154: 359-369. Syncrude Canada Ltd (1995). Syncrude Analytical Methods: Updated 2006. Syncrude Edmonton Centre. Tolonen K (1966). Stratigraphic and rhizopod analyses on an old raised bog, Varrussuo, in Hollola, South Finland. Annales Botanica Fennici, 3: 147-166. Tolonen K (1986). Rhizopod analysis. In Berglund, B.E., editor, Handbook of Holocene palaeoecology and palaeohydrology. Chichester: John Wiley 12: 645-666. Wilkinson DM (1994). A review of the biogeography of the protozoan genus Nebela in the southern temperate are Antarctic zones. Area, 26: 150-157. Warner BG (1990). Testate Amoebae. In: Warner, B.G (ed.). Methods in Quaternary. Ecol. p. 65-74. Yang J, Zhang W, FengW, Shen Y (2005). Freshwater testate amoebae of Nine Yunnan Plateau Lakes, China. J. Freshwater. Ecol., 20: 743750. Yang J, Zhang W, FengW, Shen Y (2006). Geographical distribution of testate amoebae in Tibet and northwestern Yunnan and their relationship with climate. Hydrobiologia 559: 297-304. Yang J, Zhang W, Shen Y (2009). Relationships between Testate Amoebae Assemblages (Protozoa) and Geographic Factors in Yunnan Plateau Lakes, China. J. Freshwater. Ecol. 24: 437-443.