Ecological Applications, 12(2), 2002, pp. 487–497 q 2002 by the Ecological Society of America
TESTING THE FLORISTIC QUALITY ASSESSMENT INDEX AS AN INDICATOR OF WETLAND CONDITION RICARDO D. LOPEZ1,3 1
AND
M. SIOBHAN FENNESSY2,4
The Ohio State University, School of Natural Resources, Columbus, Ohio 43210 USA 2 State of Ohio Environmental Protection Agency, Columbus, Ohio 43216-1049 USA
Abstract. Biological indicators of ecosystem integrity are increasingly being sought for use in ecosystem assessment and goal-setting for restoration projects. We tested the effectiveness of a plant community-based bioassessment tool, the floristic quality assessment index (FQAI) in 20 depressional wetlands in Ohio, USA. A priori, the 20 depressional wetlands were classified by type and ranked to form a disturbance gradient according to the local landscape condition. Ranks were based on surrounding land cover characteristics, vegetated buffer characteristics, and the extent of human-induced hydrologic alteration at the wetland site. The index was negatively correlated with the disturbance rank of a wetland and with the distance to neighboring wetlands (P 5 0.01). Index values were lower for wetlands surrounded by agricultural or urban land use, wetlands with less vegetation on the wetland perimeter, and wetlands with more hydrologic modification, and at sites with greater distances to other wetlands. The wetlands with lower FQAI values tended to be dominated by plants that are typical of heavily cultivated landscapes or urban regions. Thus, the index is interpreted as a measure of environmental factors that maintain and control plant communities. The index was not correlated with differences in wetland surface water chemistry (a 5 0.05) but was positively correlated with soil total organic carbon ( P 5 0.01), phosphorus ( P 5 0.05), and calcium (P 5 0.05). Repeated wetland sampling in the summer and autumn revealed that the floristic quality assessment index could be useful for the assessment and monitoring of wetland ecosystems and for tracking wetland restoration projects over time. Key words: biological indicator; depressional wetland; environmental gradient; floristic quality assessment index (FQAI); human influence; landscape-scale; stressor; wetland condition.
INTRODUCTION Patterns of ecosystem response to landscape change have been postulated (e.g., Harris 1984, Opdam et al. 1993, Forman 1995), but such relationships have usually been studied in terms of an ecosystem’s response to environmental extremes, rather than as a response to a gradual transition in land cover, hydrology, or patchiness. Some of the relationships between landscape stressor and aquatic plant community composition have been explored in lakes of Nova Scotia and the Pyrenees Mountains by measuring stressor gradients among sites, thus relating landscape conditions to the structure of nearby biological communities (Catling et al. 1986, Gacia et al. 1994). The gradient technique, however, requires a priori pairing of ‘‘stressor’’ variables with ‘‘response’’ variables to be ecologically meaningful. This approach may obscure the relationships between the biological components of the landManuscript received 28 February 2000; revised 24 January 2001; accepted 7 February 2001. 3 Present address: U.S. Environmental Protection Agency National Exposure Research Laboratory, Environmental Science Division, Office of Research and Development, P.O. Box 93478, Las Vegas, Nevada 89193-3478 USA. E-mail:
[email protected] 4 Present address: Kenyon College, Department of Biology, Gambier, Ohio 43022 USA.
scape and the embedded ecosystem, particularly when several parameters are simultaneously compared (Yoder 1991, Karr and Chu 1997). As an alternative, some biologists have measured aspects of plant community composition, such as percent native species (Wilhelm and Ladd 1988, Adamus and Brandt 1990). This approach is also inadequate, because it excludes details of plant community structure, such as taxa that have specific physiological requirements. A floristic quality assessment index (FQAI; index, hereafter), developed for prairies by Swink and Wilhelm (1979) offers several features that might improve upon the above indicators of ecosystem integrity. The index is based on expert knowledge of each plant species’ tendency to occur in a range of existing synecological conditions (Andreas and Lichvar 1995). To use the index, each plant species at a site is given a ranking based on the likelihood of that species being encountered at disturbed sites of a region. The index is calculated for a site (e.g., a wetland) by summing these ranks, and dividing by the square root of the number of native plant species at the site (Andreas and Lichvar 1995). We chose to test the ability of the index to characterize depressional wetlands in Ohio, because aquatic plant assemblages in these wetlands receive much of the local runoff from the surrounding landscape and are likely to integrate the effects of stress from the local landscape. A pre-
487
488
RICARDO D. LOPEZ AND M. SIOBHAN FENNESSY
vious study of 10 forested riverine wetlands in central Ohio demonstrates a negative correlation between the index value of a site and the degree of site disturbance (Fennessy et al. 1998a). In this study, we specifically tested the ability of the index to characterize wetland site disturbance and isolation, focusing on plant biomass production, water chemistry, and soil chemistry. The Ohio subsample included depressional wetlands that range from highly impacted (e.g., wetland remnants on farmland) to less impacted (e.g., wetlands within nature preserves). The objective was to compare the index values of 20 wetlands to the type and intensity of local landscape condition. Prior ecological assessments suggest that three fundamental factors are responsible for wetland ecosystem stress: land cover change in the vicinity of a wetland, the presence of a vegetated ‘‘buffer’’ between adjacent land cover and the wetland, and the hydrologic conditions within the wetland (U.S. Environmental Protection Agency 1994). Thus, these three landscape parameters were used to determine the relative site disturbance among the 20 wetland study sites. Prior research also suggests that the distance between ecosystem patches is a limiting factor for wetland plant dispersal (Godwin 1923, Nip-van der Voort et al. 1979, Moller and Rordam 1985, Lopez 1999), so the proximity of wetland study sites to neighboring wetlands was used as a potential landscape-scale wetland stressor. Plant biomass often reflects ecosystem condition, because it integrates the effects of many ecological processes (Vitousek and Reiners 1975, Keddy et al. 1993, Wilcox 1995). Plant biomass production may therefore indicate wetland stress and was specifically tested for correlation with the index. Site physiochemical characteristics are also important to consider when determining landscape-level effects on plants (Chapin 1991, Salisbury and Ross 1992, Larcher 1995). Therefore, water and soil chemistry of depressional wetland study sites were tested for correlation with the index among sites. METHODS
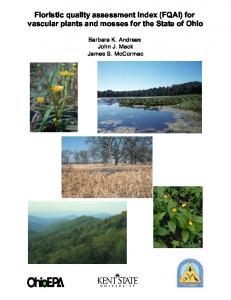
Study area and local landscape assessment Twenty depressional wetlands (Brinson 1993) in central Ohio, labeled A–T, were selected as study sites (Fig. 1) using aerial photographs, U.S. Geological Survey topographical maps (1:24 000), county-level soil survey maps, and national wetland inventory (NWI) maps. Sites were selected such that they generally spanned the gradient of current landscape conditions in central Ohio and represented emergent, scrub/shrub, and forested wetland vegetational structure (per Cowardin et al. 1979). None of the 20 wetland study sites had been converted to nonwetland land cover (e.g., drained and farmed) in the past. Field observations indicated that landscape settings of the selected wetland
Ecological Applications Vol. 12, No. 2
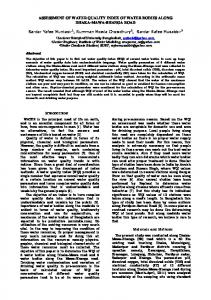
sites included active agricultural, old-field agricultural, suburban, and forested landscapes. A rule-based hierarchy of disturbance factors was developed to quantify the relative levels of disturbance across sites in the most objective way possible. The land cover/land use in a 100 m wide zone on the perimeter of each wetland (buffer, hereafter) was assessed to establish a relative local disturbance level after field sampling was completed. This information was used to construct a numerical classification ranking of wetland sites according to dominant local landscape characteristics (after Karr and Chu [1997], from Fennessy et al. [1998b]). The classification system includes the following: surrounding land cover (either forest and/ or natural grassland, fallow agricultural land, row crops, or urban land cover), the type of vegetation in the buffer (either forest, grass, or none), and evidence of hydrologic modification (Fig. 2). Correlations between the disturbance parameters in Fig. 2 and fragmentation measurements (i.e., nearest neighbor wetland distance) were performed to determine if index responses to these parameters should be tested separately.
Wetland surface water chemistry Water samples were collected during the summer of 1997 at 14 of the study sites (D, E, F, G, H, I, J, K, L, P, Q, R, S, and T). Samples were randomly collected near center, inlet, and (if present) outlets. Each water sample was taken just below the water surface and stored in a sealed, 1-L plastic container. In the field, water samples were preserved in ice at 48C in the sealed plastic containers and returned to the lab for analysis. For each study site, mean surface water chemistry values for total organic carbon, ammonia nitrogen, nitrate 1 nitrite nitrogen, total Kjeldahl nitrogen, total phosphorus, total aluminum, total calcium, total magnesium, and total copper were determined at the Ohio Environmental Protection Agency’s Division of Environmental Services lab, per the Manual of Ohio EPA Surveillance Methods and Quality Assurance Practices (Ohio Environmental Protection Agency 1987).
Wetland soil chemistry Soil samples were collected at 19 of the depressional wetland sites (all sites except C). Soil samples were randomly collected from three locations within each wetland, two at locations between the edge of the wetland and any standing water (i.e., where inundation was intermittent), and the third soil sample from a central location (typically inundated at least through the end of summer). In the vicinity of each sample, all litter material was removed from the soil surface. A plastic trowel was used to excavate soil from the surface to 25 cm. Large roots and pieces of organic material, such as twigs and leaves, were removed by hand in the field. Soil samples were preserved in ice at 48C in sealed plastic containers and returned to the lab for analysis.
April 2002
FQAI AS INDICATOR OF WETLAND CONDITION
FIG. 1.
Twenty depressional wetlands studied in seven Ohio counties in 1996 and 1997, identified by letter.
For each study site, mean soil chemistry values for pH, total organic carbon, ammonia-N, total phosphorus, total calcium, total magnesium, and total copper were determined at the Ohio Environmental Protection Agency’s Division of Environmental Services laboratory, per the Manual of Ohio EPA Surveillance Methods and Quality Assurance Practices (Ohio Environmental Protection Agency 1987).
Wetland vegetation The vegetation of the 20 wetland study sites was sampled in either 1996 or 1997. In 1996, nine sites were sampled in summer and in autumn to test for seasonal variability of the index. Of these nine sites, six sites were resampled in 1997 to test for index variability from year to year. Eleven additional sites were sampled for vegetation in 1997. Only the summer data and data from the most current sampling dates were used for all other calculations in this study. Prior to vegetation sampling, wetland boundaries were determined using hydrologic indicators and the relative presence of wetland flora (Reed 1988) at wetland boundaries. A nested quadrat sampling method (Mueller-
489
Dombois and Ellenberg 1974) was used to sample herbaceous plants, shrubs, and tree species at each of the wetland sites. Approximately 30 circular ‘‘quadrats,’’ each with area 0.45 m2, were sampled along two perpendicular transects that passed through the approximate center of each wetland. Exceptionally small wetlands were sampled with as few as 22 quadrats (at sites G, L, N, and T) to avoid oversampling the site. The quadrats were evenly spaced, ;15–30 m apart, depending on wetland size. Three circular quadrats were nested at each sampling point, and all plants were identified to species as follows: herbaceous plants within 0.45 m2, shrubs within 25 m2, trees within 100 m2. In addition, newly encountered plant species were recorded within a 2 m wide belt transect between each of the quadrats. The relationship between number of species sampled and the cumulative sampling area was analyzed at 12 study sites (D, E, F, G, H, K, L, P, Q, R, S, and T) by determining the plateau point of the cumulative species richness curve (after Mueller-Dombois and Ellenberg 1974) within the 2 m wide belt transect, to assess the adequacy of the sampling effort. Among the sampled sites we estimated that the sam-
490
RICARDO D. LOPEZ AND M. SIOBHAN FENNESSY
Ecological Applications Vol. 12, No. 2
FIG. 2. The three-tiered flow chart used to rank 20 depressional wetlands along a landscape disturbance gradient, from relatively low human impact to relatively high human impact. Tier 1 indicates the adjacent land cover that surrounds the wetland; tier 2 indicates the type and extent of vegetated buffer that encompasses the wetland; tier 3 indicates either (A) little hydrologic modification, or (B) human modified hydrology in the wetland. Numerical ranks are displayed in squares at the bottom of the flow chart (from Fennessy et al. [1998b]).
pling effort was adequate, with ;85% of the plant species collected within the first half of the total transect length (an approximate cumulative sampling area of 400 m2). Aboveground plant biomass was collected at the seven emergent-wetland sites (C, E, L, N, O, P, and S) during peak standing biomass (i.e., early- to mid-August). At ;10–30-m intervals along a single randomly established transect, all of the aboveground plant material in 10 quadrats, each 30 3 30 cm, was clipped at soil level and placed in a storage bag. When present, floating leaves and submersed plant material was included with the emergent vegetation by clipping it at the substrate surface. The sample from each quadrat was individually bagged and oven dried at 608C for $72 h to a constant dry mass.
Spatial calculations, index calculations, and statistical analyses The mean distance of neighboring wetlands was determined by measuring the distance to the three nearest wetlands on NWI map(s). If the three nearest wetlands were not all of the same class as the study site (Cowardin et al. 1979), the distance of the next nearest ‘‘like-type’’ neighboring wetland was determined until three of the same class (i.e., emergent, scrub/shrub, or
forested) were recorded. Mean nearest ‘‘same-class’’ and nearest ‘‘any class’’ wetland were then calculated for each study site (N 5 3). The floristic quality assessment index for a wetland was determined by first establishing the coefficient of conservatism for each plant species encountered at a site (per Andreas and Lichvar 1995): a rank of zero was assigned to non-native and opportunistic invasive plant species; native taxa that are found in disturbed sites were assigned a rank of one to three; native taxa that are typically associated with a specific plant community, but tolerate moderate disturbance to that community were assigned a rank of four to six; taxa in plant communities in an advanced successional stage that have undergone minor disturbance were assigned a rank of seven or eight; plants with high degrees of fidelity to a narrow range of synecological parameters were assigned a rank of nine or 10. Subsequently, the floristic quality assessment index for a study site was calculated as follows: R/ ÏN , R 5 sum of coefficients of conservatism, and N 5 no. native plant species (Andreas and Lichvar 1995). In general, within each study site, a low index value indicates that there is a high relative dominance of plants that are typical of disturbed areas. Because one or both of the assumptions of parametric
April 2002
FQAI AS INDICATOR OF WETLAND CONDITION
statistics tests (normality and equality of variance) are violated in all of the data, paired comparisons were performed with Spearman rank correlation (a 5 0.05) (Zar 1984), except for aboveground biomass analyses in which both a parametric and nonparametric model were applied. All analyses were completed with Statview statistical software (SAS Institute, v.4.51, Cary, North Carolina, USA). RESULTS There were 286 plant species observed among the 20 study sites, of which 58 are non-native plants (Table 1; see the Appendix for a complete listing). Prior to calculating the index value, each study site was assigned a disturbance rank using the three-tiered flow chart in Fig. 2. The disturbance rank, index, sum of the coefficients of conservatism, number of native plant species, and plant species richness at each wetland site are summarized in Table 2. The sites ranked as ‘‘least impacted’’ (e.g., sites D, F, and T) are wetlands in large wooded areas. For example, site D is located in a 200ha forest, the largest remaining forested parcel in northwestern Ohio (Ohio Department of Natural Resources, personal communication). ‘‘Impaired’’ sites are typically surrounded by row crops (e.g., site C) or urban development (e.g., site K). Mean index values are typically higher at sites that are located within forested landscapes and that have a forested or old-field buffer around them. Wetlands without a vegetated buffer (i.e., agricultural fields that reach the edge of the wetland) tend to have some of the lowest index values, hence a greater dominance of plant species that are typical of disturbed Ohio landscapes (e.g., Phalaris arundinacea L., Rosa multiflora Thunb., and Rumex crispus L.). Disturbance rank of a site is positively correlated with the distance to nearest wetlands of any vegetation class (r 5 0.699, P 5 0.002), but not with the distance to nearest neighbor wetlands of the same vegetation class (P 5 0.10). The index is negatively correlated with the disturbance rank of a wetland (r 5 20.695, P 5 0.01; Fig. 3). The index is also negatively correlated with the distance to nearest neighbor wetlands of any vegetation class (r 5 20.609, P 5 0.01) and for wetlands of the same vegetation class (r 5 20.691, P 5 0.01). The ranges of nutrient and mineral concentrations measured in the surface water at the study sites are within the range typical of palustrine wetlands of this region (Mitsch and Gosselink 1993), and the index is not responsive to concentrations of any of the measured surface water chemistry parameters (Table 3). Mean values for soil pH and copper are within the normal ranges for Ohio farmland (Logan and Miller 1983, Ohio State University Extension Office 1996). However, wetland soils at the study sites are enriched in total organic carbon, total calcium, total magnesium, and total phosphorus (Table 4). The index is negatively correlated with soil pH, which may be an artifact of
491
the relatively narrow range of pH among sites. Those sites with greater soil percent total organic carbon content, total phosphorus, and total calcium had relatively higher index values. The index value for a wetland also increased as the proportion of agricultural land surrounding the site decreased, and as the proportion of surrounding forestland/grassland increased. The index is also positively correlated with total phosphorus and calcium in wetland soil (Table 4). The bulk density of the soil at the 20 wetland sites was not measured, thus soil chemistry values are based solely on concentration. Interpretations from the soil chemistry results in this study must therefore be interpreted with caution. Biomass estimates in the seven emergent study sites ranged ;250–1500 g/m2, typical of the range of biomass production found in other similar emergent wetlands (van der Valk and Davis 1978, Mitsch and Gosselink 1993). A linear, nonparametric model of the relationship between index value and biomass production at the seven emergent wetland study sites was not statistically significant (r 5 20.500, P 5 0.17), but an exponential regression model of the same data shows a strong negative correlation (r 5 20.850, P , 0.05). The index values of summer-sampled sites ranged from 14 (site N) to 34 (site B), while the combined summer–autumn values ranged from 15 (site N) to 37 (site B). The total number of plant species recorded at each site increased by a mean value of 15 new species between the two seasons. However, the summer-only and the combined summer–autumn index values were strongly positively correlated (r 5 0.967, P 5 0.006) at these nine sites. Although index values increased by a mean value of three points, between the two seasons there was little change in the relative ranking of the sites. Also, of the nine sites twice-sampled in 1996, the relative index ranking of the top four sites (sites B, F, M, and P) and the bottom two sites (sites C and N) did not change. DISCUSSION There is some criticism of using biological indexes as definitive ecological assessment criteria, primarily because the mechanisms of the ecological relationships described by some indexes have not been fully explored (Keddy et al. 1993). A general criticism of using ecological indicators is that finding an ecological ‘‘reference condition’’ is unlikely (Green 1979), particularly because few ecosystems remain under least-possible-impact conditions. If the least-possibleimpact conditions were found, it has been suggested that we could never be certain that other less impacted sites do not exist (U.S. Environmental Protection Agency 1990). Critics of biological indexes have also expressed concern about comparing too many ecological properties simultaneously and combining them into a single index value, warning that ‘‘noise’’ among multiple ecological measurements may combine and obscure true ecological relationships (Yoder 1991,
492
Ecological Applications Vol. 12, No. 2
RICARDO D. LOPEZ AND M. SIOBHAN FENNESSY
TABLE 1. Plant species present in at least 5 of the 20 wetland study sites and their coefficient of conservatism (from Andreas and Lichvar 1995).
Plant species
Acer negundo L. Acer saccharinum L. Acer saccharum Marshall Alisma subcordatum Raf. Apocynum cannabinum L. Asclepias incarnata L. Asimina triloba (L.) Dunal Bidens frondosa L. Boehmeria cylindrica (L.) Swartz Carex frankii Kunth Carex lupulina Muhl. Carex stricta Lam. Carex tribuloides Wahlenb. Carex vulpinoidea Michex. Carpinus caroliniana Walter Carya laciniosa (Michx. f.) Loud. Celtis occidentalis L. Cephalanthus occidentalis L. Circaea lutetiana L. Cirsium arvense (L.) Scop Cornus amomum Mill. Daucus carota L. Eleocharis obtusa (Willd.) Schultes Elymus virginicus L. Erigeron annuus (L.) Pers. Eupatorium perfoliatum L. Eupatorium rugosum Hautt. Festuca pratensis Hudson Fraxinus pennsylvanica Marshall Galium palustre L. Galium triflorum Michx. Geum canadense Jacq. Gleditsia triacanthos L. Glyceria striata (Lam.) Hitch. Impatiens capensis Meerb. Juglans nigra L. Juncus effusus L. Juncus tenuis Willd. Leersia oryzoides (L.) Swartz Lemna minor L. Lindera benzoin (L.) Blume Lycopus americanus Muhl. Menispermum canadense L. Oxalis stricta L. Parthenocissus quinquefolia (L.) Planchon Phalaris arundinacea L. Pilea pumila (L.) Gray Plantago major L. Polygonum amphibium L. Polygonum hydropiperoides Michx. Polygonum virginianum L. Populus deltoides Marshall Prunus serotina Ehrh. Quercus bicolor Willd. Quercus palustris Muenchh. Quercus rubra L. Ribes americanum Mill. Ribes cynosbati L. Rosa multiflora Thunb. Rosa palustris Marshall Rubus allegheniensis Porter Rubus occidentalis L. Rumex crispus L. Salix nigra Marshall Sambucus canadensis L. Scirpus atrovirens Willd. Scirpus cyperinus (L.) Kunth Scirpus polyphyllus Vahl. Scutellaria lateriflora L.
Coefficient of conservatism
No. sites where species is present
3 3 6 2 3 5 6 2 4 5 3 6 4 3 4 7 6 7 3 0 2 0 2 3 1 3 4 0 6 9 5 2 1 2 2 5 1 1 1 4 6 3 5 0 3 0 4 0 5 5 4 5 3 7 4 7 6 5 0 4 1 1 0 3 3 2 1 4 3
13 16 6 10 7 6 6 7 13 7 6 5 10 10 9 6 7 14 6 7 7 5 6 5 9 6 7 6 19 5 8 15 7 11 12 7 6 7 9 13 9 5 6 7 13 5 8 5 8 7 9 11 12 13 7 5 5 5 16 11 6 8 7 13 9 6 6 7 8
FQAI AS INDICATOR OF WETLAND CONDITION
April 2002 TABLE 1.
493
Continued.
Plant species
Coefficient of conservatism
No. sites where species is present
5 0 1 2 1 2 5 4
6 8 15 7 7 15 5 19
Sium suave Walter Solanum dulcamara L. Toxicodendron radicans (L.) Kuntze Typha latifolia L. Ulmus americana L. Ulmus rubra Muhl. Viburnum prunifolium L. Vitis riparia Michx.
Notes: Boldface taxa are not native. Nomenclature is consistent with Voss (1972, 1985, 1996).
Karr and Chu 1997). To minimize the above-mentioned pitfalls of using biological indexes, we did the following: (1) studied a very narrowly defined hydrogeomorphic class of wetland that can be easily delineated as a distinct patch within the larger landscape (i.e., depressional wetland); (2) selected sites from the entire range of landscape settings of the region and included an even proportion of vegetational wetland classes (i.e., emergent, scrub/shrub, and forested); (3) determined that the index does not respond the same to interwetland distance (i.e., fragmentation) and site disturbance rank and explored these two stressors separately; (4) limited the number of ecological variables with which we attempted to describe the ecosystem by using the floristic quality assessment index, which is a simple calculation consisting of understandable components.
The strong relationship between the index and disturbance rank suggests that the index is responsive to a combination of disturbance factors including dominant adjacent land cover, vegetation buffer characteristics, and hydrologic alterations. Although Fennessy et al. (1998a) did not rank wetlands by the same means as we did in this study, they reported a similar response between the index and local landscape disturbance in forested riverine wetlands. The relationships between index and interwetland distance suggest that the index is responsive to disturbance(s) that results from wetland isolation, independent of vegetation class (i.e., emergent, scrub/shrub, or forested). These results are consistent with those of Lopez (1999) who found that the index is negatively correlated with the areal extent of agricultural land cover within ;1 km of a depressional wetland.
TABLE 2. Disturbance rank, floristic quality assessment index (FQAI), sum of coefficients of conservatism, no. native plant species, and plant species richness at 20 wetland sites in central Ohio.
Wetland site
Wetland vegetation class†
Sample year(s)
Disturbance rank
A B C D E F G H I J K L M N O P Q R S T
forested scrub/shrub emergent scrub/shrub emergent scrub/shrub forested scrub/shrub scrub/shrub scrub/shrub forested emergent forested emergent emergent emergent forested scrub/shrub emergent forested
1996 1996/1997 1996 1997 1997 1996/1997 1997 1997 1997 1997 1996/1997 1997 1996 1996/1997 1996/1997 1996/1997 1997 1997 1997 1997
14 13/13 18 1 11 1/1 2 14 13 18 20/20 17 8 17/17 10/10 13/13 4 7 17 1
Sum of No. coefficient(s) native Index of conserplant value vatism species 26 37/29 18 34 20 37/32 31 23 26 12 28/28 18 30 15/11 28/23 34/22 28 27 18 32
172 323/232 95 268 100 341/273 236 147 180 48 239/217 102 218 81/44 234/171 300/169 234 179 103 244
44 76/64 28 62 25 85/73 58 41 48 16 73/60 32 53 29/16 70/55 78/59 70 44 33 58
Plant species richness 47 78/70 31 66 31 89/75 61 48 51 18 84/73 45 59 39/22 79/65 96/76 78 48 37 62
Note: For twice-sampled sites, 1996 and 1997 results are listed; coefficients of conservatism are from Andreas and Lichvar (1995). † Cowardin et al. 1979.
Ecological Applications Vol. 12, No. 2
RICARDO D. LOPEZ AND M. SIOBHAN FENNESSY
494
FIG. 3. Scatterplot of floristic quality assessment index (FQAI) values and disturbance rank of 20 depressional wetland study sites. The index and disturbance rank are negatively correlated (r 5 20.695, P 5 0.01). Data points are indicated by site identity.
Because soil samples capture a cumulative record of the nutrients and minerals in residence at each of the study sites, soil chemistry values may be a better longterm indicator of site condition than surface water chemistry values. Also, because these study sites are fed primarily by intermittent overland sheet flow from the adjacent landscape, nutrients and mineral concentrations in surface water on discrete dates may not be representative of typical nutrient and mineral loading at a site. Thus, the positive correlations between the index and soil carbon, phosphorus, and calcium concentrations may indicate a stress response by wetlands that have undergone disturbance(s), manifested by a greater presence of plant species with small coefficients of conservatism. Odum (1985) postulates several similar relationships between ecosystem stress and the conTABLE 3. Range of mean values for nine surface water chemical parameters in 14 central Ohio depressional wetlands. Surface water parameter TOC (mg/L) NH3-N (mg/L) NO2 1 NO3-N (mg/L) TKN (mg/L) Total P (mg/L) Total Al (mg/L) Total Ca (mg/L) Total Mg (mg/L) Total Cu (mg/L)
centrations of soil nutrients, suggesting that stressed ecosystems tend to have lower plant diversity, a greater loss of nutrients, and an increase in primary production. O’Neill et al. (1977) demonstrates the correlations between soil fertility (e.g., calcium) and ecosystem stress by applying arsenic, lead, cadmium, copper, and zinc to mesocosms. Boyd (1970) demonstrates that aboveground biomass production of wetland macrophytes is positively correlated with the concentration of nutrients in wetland soil. Others (van der Valk and Davis 1978, Davis and van der Valk 1983) demonstrate that in wetlands dominated by Typha spp. aboveground primary production is positively correlated with soil nutrient concentration. The emergent wetlands with lower index values in our study have a predominance of Typha spp. These results are consistent with observations in other ‘‘stressed’’ ecosystems, where hydrologic alterations, TABLE 4. Soil chemistry parameters and results from Spearman rank correlation with the floristic quality assessment index in central Ohio depressional wetlands.
Range of mean values at sites 7.6–22.7 0.03–0.47 0.05–7.7 0.4–1.6 0.03–0.49 100–745 28–68 8–36 1.0–2.5
Soil parameter
No. sites
Range of mean values at sites
Rho and significance
pH TOC (%) NH3-N(mg/kg) Total P (mg/kg) Total Ca (mg/kg) Total Mg (mg/kg) Total Cu (mg/kg)
19 18 19 19 19 19 19
5.7–7.4 2.3–31.3 24–269 757–3310 2547–16400 2187–7687 20–69
20.250* 0.402**
* P , 0.05; ** P , 0.01;
NS ,
NS
0.271* 0.300* NS NS
not significant (P . 0.05).
April 2002
FQAI AS INDICATOR OF WETLAND CONDITION
nutrient enrichment, and other disturbance conditions exist (Odum 1985, Keddy et al. 1993, Wilcox 1995). In a similar group of emergent depressional wetlands, Lopez (1999) demonstrates that wetland hydroperiod is another important factor in determining whether Typha spp. predominates within the plant community. Among emergent wetlands with a longer duration of flooding, Lopez (1999) observed a substantial decline in the aboveground plant biomass production, which was mainly attributable to the absence of Typha spp. The findings that aboveground biomass production in emergent wetlands may be a good indicator of ecosystem stress and the negative correlation between the index and aboveground plant biomass production suggest that the index has value as an indicator of wetland stress among the study sites. At a landscape scale, the observation that the index value increases as the mean distance to other wetlands decreases suggests that when wetlands are close to each other the predominance of plant species typical of disturbed areas decreases at the site. Plant species that are typically found in disturbed areas have classically been characterized as r-selected, or ‘‘supertramp’’ (Diamond 1974), species and are hypothesized to have a competitive advantage dispersing among isolated ecosystem patches (MacArthur and Wilson 1967, Simberloff and Wilson 1970). These r-selected characteristics are observed in many of the plants that have low coefficients of conservatism, and include greater production of propagules (e.g., Typha spp.) or greater adaptability to fluctuations in environmental conditions (e.g., Phalaris arundinacea L.). Despite the significant negative correlations between the index and interwetland distance, the number of native plant species at a site (a major component of the index) is not significantly correlated with the mean interwetland distance (r 5 20.324, P 5 0.10), nor is species richness significantly correlated (P . 0.10) with the mean interwetland distance (Lopez 1999). Thus, the index may be responsive to a gradient of wetland isolation when measurements of plant community diversity and native dominance are not, because the index principally measures the relative dominance of plant species that are typical of disturbed sites. Prior investigations of land cover conversion in central Ohio strongly implicate agriculturally induced landscape fragmentation (primarily forest fragmentation) as the greatest cause of declining plant species diversity in Ohio’s remaining forested areas (Simpson et al. 1994, Strittholt and Boerner 1995). Strittholt and Boerner (1995) report that, even in the relatively rural and contiguously forested southeastern region of Ohio, the conversion of small patches of land has fragmented the landscape such that human land use is the primary destroyer of forest biological diversity. In central Ohio the area of human-induced fragmentational factors is much more extensive, and the destruction of wetland ecosystems is essentially complete (Dahl 1990). Thus,
495
it may be that human-induced landscape fragmentation in central Ohio has increased the predominance of disturbance-adapted plant species (as measured by the index) in the remnant patches of depressional wetlands. One of the potential disadvantages of using plantbased indexes to assess the effects of landscape stressors is that they may be so temporally variable as to be unreliable, from year to year or from season to season. Based on the relationship between summer-only and summer-autumn index values, and the high degree of correlation between summer and autumn index values in Ohio’s forested riverine wetlands (Fennessy et al. 1998b), the index appears to be consistent with regard to sampling sites at different times of the growing season. The results of this study suggest that there is little advantage to repeated index sampling over a single season in terms of differentiating between sites (i.e., using the index to differentiate relative site quality). However, sampling a larger group of wetlands or resampling sites over several years may yield a different answer. The responsiveness of the index to surrounding land cover characteristics and wetland-specific landscape fragmentation suggests that it may be a useful and versatile biological assessment tool for detecting impacts on a single wetland (temporal studies) or detecting impacts among a set of current wetlands in varied landscape conditions (longitudinal studies). Such studies may be useful for quantifying the relative effects of landscape conditions on natural wetlands or to track wetland restoration projects over time. From such studies, the relationships between the index and landscape stressors may become better understood in different wetland ecosystem types, at which time it could be used to predict general shifts in the biology and chemistry of ecologically vulnerable wetlands. Further understanding of such relationships between landscape-scale stressors and the index is warranted by the results of this study. Presently, the floristic quality assessment index is used by the Chicago district of the U.S. Army Corps of Engineers to set wetland performance standards and to assess compliance with regulations. The index is also used by the State of Ohio Environmental Protection Agency to assess natural wetlands and to track wetland mitigation projects. ACKNOWLEDGMENTS We thank Joy B. Zedler and two anonymous reviewers for their comments regarding this manuscript. We thank Mick Micacchion, Bonny Elifritz, Mike Gray, Robert Geho, and John Mack who provided fieldwork help. This study was funded, in part, by the State of Ohio Environmental Protection Agency and U.S. EPA Grant no. CD995761-01-0. Additional support for the publication of this manuscript was provided, in part, by the U.S. EPA Office of Research and Development, National Exposure Research Laboratory. The research described here was developed prior to the employment of the primary author with the U.S. Environmental Protection Agency’s Office of Research and Development. The manuscript has been subjected to EPA’s administrative review, but the conclusions drawn are solely those of the authors. Mention
496
RICARDO D. LOPEZ AND M. SIOBHAN FENNESSY
of trade names or commercial products does not constitute endorsement or recommendation by EPA for use. LITERATURE CITED Adamus, P. R., and K. Brandt. 1990. Impacts on quality of inland wetlands of the United States: a survey of indicators, techniques, and applications of community level biomonitoring data. EPA/600/3-90/073. U.S. Environmental Protection Agency Environmental Research Laboratory, Corvalis, Oregon, USA. Andreas, B. K., and R. W. Lichvar. 1995. Floristic index for assessment standards: a case study for northern Ohio. Wetlands Research Program Technical Report WRP-DE-8. U.S. Army Corps of Engineers Waterways Experiment Station, Vicksburg, Mississippi, USA. Boyd, C. E. 1970. Production, mineral accumulation and pigment concentrations in Typha latifolia and Scirpus americanus. Ecology 51:285–290. Brinson, M. 1993. A hydrogeomorphic classification for wetlands. Report WRP-DE-4. U.S. Army Corps of Engineers Waterways Experiment Station, Vicksburg, Mississippi, USA. Catling, P. M., B. Freedman, C. Stewart, J. J. Kerekes, and L. P. Lefkovitch. 1986. Aquatic plants of acid lakes in Kejimkujik National Park, Nova Scotia; floristic composition and relation to water chemistry. Canadian Journal of Botany 64:724–729. Chapin, F. S., II. 1991. Integrated response of plants to stress. Bioscience 41:29–36. Cowardin, L. M., V. Carter, F. C. Gollet, and E. T. LaRoe. 1979. Classification of wetlands and deepwater habitats of the United States. FWS/OBS-79/31. U.S. Fish and Wildlife Service, Washington, D.C., USA. Dahl, T. E. 1990. Wetlands losses in the United States, 1780s to 1980s. U.S. Department of the Interior, Fish and Wildlife Service, Washington, D.C., USA. Davis, C. B., and A. G. van der Valk. 1983. Uptake and release of nutrients by living and decomposing Typha glauca Godr. tissues at Eagle Lake, Iowa. Aquatic Botany 16: 75–89. Diamond, J. M. 1974. Colonization of exploded volcanic islands by birds: the supertramp strategy. Science 184:803– 806. Fennessy, M. S., R. Geho, B. Elifritz, and R. Lopez. 1998a. Testing the floristic quality assessment index as an indicator of riparian wetland quality. Final Report to U.S. EPA. Ohio Environmental Protection Agency, Division of Surface Water, Columbus, Ohio, USA. Fennessy, S., M. Gray, R. D. Lopez, and J. Mack. 1998b. An ecological assessment of wetlands using reference sites. Final Report to U.S. EPA. State of Ohio Environmental Protection Agency, Columbus, Ohio, USA. Forman, R. T. T. 1995. Land mosaics. Cambridge University Press, New York, New York, USA. Gacia, E., E. Ballesteros, L. Camarero, O. Delgado, A. Palau, J. L. Riera, and J. Catalan. 1994. Macrophytes from lakes in the eastern Pyrenees: community composition and ordination in relation to environmental factors. Freshwater Biology 32:73–81. Godwin, H. 1923. Dispersal of pond floras. Journal of Ecology 11:160–164. Green, R. H. 1979. Sampling design and statistical methods for environmental biologists. J. Wiley and Sons, New York, New York, USA. Harris, L. D. 1984. The fragmented forest: island biogeography theory and the preservation of biotic diversity. University of Chicago Press, Chicago, Illinois, USA. Karr, J. R., and E. W. Chu. 1997. Biological monitoring and assessment: using multimetric indexes effectively. EPA/ 235/R97/001. University of Washington, Seattle, Washington, USA.
Ecological Applications Vol. 12, No. 2
Keddy, P. A., H. T. Lee, and I. C. Wisheu. 1993. Choosing indicators of ecosystem integrity: wetlands as a model system. Pages 61–79 in S. Woodley, J. Kay, and G. Francis, editors. Ecological integrity and the management of ecosystems. St. Lucie Press, Delray Beach, Florida, USA. Larcher, W. 1995. Physiological plant ecology. Springer-Verlag, Berlin, Germany. Logan, T. J., and R. H. Miller. 1983. Background levels of heavy metals in Ohio farm soils. Research Circular 275. Ohio State University Ohio Agricultural Research and Development Center, Wooster, Ohio, USA. Lopez, R. D. 1999. An ecological assessment of the relationships between landscape structure and depressional– wetland ecosystem status along environmental gradients in central Ohio. Dissertation. Ohio State University School of Natural Resources, Columbus, Ohio, USA. MacArthur, R., and E. O. Wilson. 1967. The theory of island biogeography. Princeton University Press, Princeton, New Jersey, USA. Mitsch, W. J., and J. G. Gosselink. 1993. Wetlands. Second edition. Van Nostrand Reinhold, New York, New York, USA. Moller, T. R., and C. P. Rordam. 1985. Species numbers of vascular plants in relation to area, isolation, and age of ponds in Denmark. Oikos 45:8–16. Mueller-Dombois, D., and H. Ellenberg. 1974. Aims and methods of vegetation ecology. Wiley and Sons, London, UK. Nip-van der Voort, J., R. Hengeveld, and J. Haeck. 1979. Immigration rates of plant succession in three Dutch polders. Journal of Biogeography 6:301–308. Odum, E. P. 1985. Trends expected in stressed ecosystems. Bioscience 35:419–422. Ohio Environmental Protection Agency. 1987. Ohio EPA manual of surveillance methods and quality assurance practices (updated edition). Division of Water Quality Monitoring and Assessment, Evaluation and Standards Section, Columbus, Ohio, USA. Ohio State University Extension Office. 1996. The Ohio agronomy guide: Bulletin 472. The Ohio State University, Columbus, Ohio, USA. O’Neill, R. V., B. S. Ausmus, D. R. Jackson, R. I. Van Hook, P. Van Voris, C. Washburne, and A. P. Watson. 1977. Monitoring terrestrial ecosystems by analysis of nutrient export. Water, Air, and Soil Pollution 8:271–277. Opdam, P., R. V. Apeldoorn, A. Schotman, and J. Kalkhoven. 1993. Population responses to landscape fragmentation. Pages 147–169 in C. C. Vos and P. Opdam, editors. Landscape ecology of a stressed environment. Chapman & Hall, London, UK. Reed, P. B. 1988. National list of plant species that occur in wetlands. Report No. 88(26.3). U.S. Fish and Wildlife Service, Washington, D.C., USA. Salisbury, F. B., and C. W. Ross. 1992. Plant physiology. Fourth edition. Wadsworth, Belmont, California, USA. Simberloff, D., and E. O. Wilson. 1970. Experimental zoogeography of islands. A two-year record of colonization. Ecology 51:934–937. Simpson, J. W., R. E. J. Boerner, M. N. DeMers, L. A. Berns, F. J. Artigas, and A. Silva. 1994. Forty-eight years of landscape change on two contiguous Ohio landscapes. Landscape Ecology 9:261–270. Strittholt, J. R., and R. E. J. Boerner. 1995. Applying biodiversity gap analysis in a regional nature reserve design for the edge of Appalachia, Ohio (U.S.A.). Conservation Biology 9:1492–1505. Swink, F., and G. Wilhelm. 1979. Plants of the Chicago region: a checklist of the vascular flora of the Chicago region, with keys, notes on local distribution, ecology, and tax-
April 2002
FQAI AS INDICATOR OF WETLAND CONDITION
onomy, and a system for evaluation of plant communities. Morton Arboretum, Lisle, Illinois, USA. U.S. Environmental Protection Agency. 1990. Biological criteria: national program guidance for surface waters. EPA440/5-90-004. U.S. Environmental Protection Agency, Washington, D.C., USA. U.S. Environmental Protection Agency. 1994. National water quality inventory. EPA-841-R-94-001. U.S. Environmental Protection Agency, Washington, D.C., USA. van der Valk, A. G., and C. B. Davis. 1978. Primary production of prairie glacial marshes. Pages 21–28 in R. E. Good, D. F. Whigham, and R. L. Simpson, editors. Freshwater wetlands: production processes and management potential. Academic Press, New York, New York, USA. Vitousek, P. M., and W. A. Reiners. 1975. Ecosystem succession and nutrient retention: a hypothesis. Bioscience 25: 376–380. Voss, E. G. 1972. Michigan flora (Part I, gymnosperms and monocots). Cranbrook Institute of Science and University of Michigan Herbarium, Ann Arbor, Michigan, USA. Voss, E. G. 1985. Michigan flora (Part II, dicots, Saurura-
497
ceae–Cornaceae). Cranbrook Institute of Science and University of Michigan Herbarium, Ann Arbor, Michigan, USA. Voss, E. G. 1996. Michigan flora (Part III, dicots, Pyrolaceae–Compositae). Cranbrook Institute of Science and University of Michigan Herbarium, Ann Arbor, Michigan, USA. Wilcox, D. A. 1995. Wetland and aquatic macrophytes as indicators of anthropogenic hydrologic disturbance. Natural Areas Journal 15:240–248. Wilhelm, G., and D. Ladd. 1988. Natural area assessment in the Chicago region. Pages 361–375 in Transactions 53rd North American Wildlife and Natural Resources Conference, Louisville, Kentucky, USA. Wildlife Management Institute, Washington, D.C., USA. Yoder, C. 1991. Answering some concerns about biological criteria based on experiences in Ohio. Pages 95–104 in Proceedings of Water Quality Standards for the 21st Century. U.S. Environmental Protection Agency, Criteria/Standards Division, Washington, D.C., USA. Zar, J. H. 1984. Biostatistical analysis. Prentice Hall, Englewood Cliffs, New Jersey, USA.
APPENDIX For the complete list of plant species present at 20 wetland study sites and their coefficients of conservatism (to supplement the data presented in Table 1), please see ESA’s Ecological Archives: A012-005-A1.