NeuroRegulation
The Acute Electrocortical and Blood Pressure Effects of Chocolate Michelle Montopoli1, Larry Stevens1*, Constance J. Smith1, George Montopoli2, Stephanie Passino1, Somer Brown1, Lena Camou1, Katie Carson1, Shannon Maaske1, Kathleen Knights1, William Gibson1, and Joyce Wu1 1 2
Northern Arizona University, Department of Psychological Sciences, Flagstaff, Arizona, USA Arizona Western College, Department of Mathematics, Yuma, Arizona, USA
Abstract Objective: The present study investigated the effects of consuming chocolate on electroencephalograph (EEG) frequencies and localization and on blood pressure. Method: Across six conditions, 122 participants consumed either higher (60%) cacao chocolate, low (0%) cacao chocolate, higher cacao chocolate + L-theanine, high sugar water, low sugar water, or water. EEGs, blood pressure, and mood were measured before and after a 60-min digestion period. Results: Analyses indicated a decrease in frontal, parietal, and temporal theta and an increase in occipital beta EEG following the consumption of a 60% cacao confection compared with control conditions. Diastolic blood pressure increased with the consumption of higher cacao chocolate when compared to water alone and to higher cacao chocolate + L-theanine. Diastolic and systolic blood pressure decreased following consumption of higher cacao + L-theanine chocolate, averaging 4–8 mmHg. No condition-specific mood changes or gender differences were found. Conclusions: This study suggests an acute stimulating effect of cacao on the human brain and vasoconstrictive effects on peripheral vasculature, the latter of which appear to be offset by an L-theanine additive. Significance: This is the first known study to investigate acute EEG effects of consuming chocolate and suggests a potential attention-enhancing effect. Keywords: chocolate, cocoa, cacao, L-theanine, EEG, blood pressure Citation: Montopoli, M., Stevens, L., Smith, C. J., Montopoli, G., Passino, S., Brown, S., … Wu, J. (2015). The Acute Electrocortical and Blood Pressure Effects of Chocolate. NeuroRegulation, 2(1), 3–28. doi.org/10.15540/nr.2.1.3 *Address correspondence to: Larry Stevens, PhD, Northern Arizona University, Department of Psychological Sciences, NAU Box 15106, Flagstaff, AZ 86011, USA. Email:
[email protected] Copyright: © 2015. Montopoli et al. This is an Open Access article distributed under the terms of the Creative Commons Attribution License (CC-BY).
Introduction Few food products have garnered such attention or have reached such cultural and mythological significance as chocolate. Indeed, chocolate is frequently heralded as an aphrodisiac, a broadspectrum medicinal agent, a mood-altering substance, a nutritional supplement, an antihypertensive, a stimulant, and as the most frequently craved food in the Western world (Bruinsma & Taren, 1999; di Tomaso, Beltramo, & Piomelli, 1996; Dillinger et al., 2000; Hill & HeatonBrown, 1994; Rozin, Levine, & Stoess, 1991; Weingarten & Elston, 1991). Research over the past decades has generally been supportive of these effects, if only of minimal magnitude in some 3 | www.neuroregulation.org
Edited by: Rex Cannon, PhD, Positive Brain Training, Florida, USA Reviewed by: Rex Cannon, PhD, Positive Brain Training, Florida, USA Nancy Wigton, PhD, Grand Canyon University, Arizona, USA
cases. Chocolate is made from the cocoa bean— which is actually the seed of the fruit of the Theobroma cacao tree—and was originally cultivated by the Olmec, Mayan, and Aztec aristocracy in Mesoamerica and by the Inca in South America. Ancient codices from Mesoamerica indicate that foods made from the raw, fermented, roasted, shelled, and ground cocoa bean (called cacao) were used for a variety of medicinal purposes such as relieving cough, gastrointestinal aids, improving angina and heart palpitations, and even as a sexual stimulant (Dillinger et al., 2000). Modern research has linked the ingestion of flavanols, polyphenolic compounds highly concentrated in the cocoa bean, to stimulation of nitric oxide synthase production (Fisher, Hughes,
Vol. 2(1):3–28 2015
doi:10.15540/nr.2.1.3
Montopoli et al.
NeuroRegulation
Gerhard-Herman, & Hollenberg, 2003). Nitric oxide synthase increases levels of nitric oxide in arterial endothelial cells producing peripheral vasodilation. Cocoa (processed cacao with the cocoa butter removed) and chocolate (processed cacao with cocoa butter not removed) also contain trace amounts of compounds thought to potentially alter brain activity, such as anandamide, a naturally occurring neuromodulator which can bind to cannabinoid-receptors and very mildly mimic the psychoactive properties of plant-derived cannabinoid drugs (di Tomaso et al., 1996). By far the most heavily researched and most convincing effect of cacao and chocolate ingestion is the effect on blood pressure and vasodilation. The evidence is now highly suggestive that the flavanols in cacao products have vasodilation effects through increases in nitric oxide (NO), which may result in small decreases in blood pressure (Engler et al., 2004; Fraga et al., 2005; Grassi, Lippi, Necozione, Desideri, & Ferri, 2005; Grassi, Necozione, et al., 2005; Taubert, Roesen, Lehmann, Jung, & Schomig, 2007). Taubert, Roesen, and Schomig (2007) conducted a meta-analysis of randomized controlled studies of the effects of cocoa use over a median period of 2 weeks on blood pressure and reported a mean decrease in systolic blood pressure (SBP) of 4.7 mmHg and in diastolic blood pressure (DBP) of 2.8 mmHg. These results translate into a 20%, 10%, and 8% risk reduction in stroke, coronary heart disease, and all-cause mortality, respectively. And, in a cross-sectional study of 470 elderly men, those who consumed the equivalent of 2.3 g of cocoa powder per day over a 5-year period had a significantly lower SBP (-3.7 mmHg) and DBP (-2.1 mmHg) relative to men with low cocoa intake, translating prospectively into a 45–50% decrease in cardiovascular and all-cause risk (Buijsse, Feskens, Kok, & Kromhout, 2006). Such decreases in blood pressure following prolonged consumption of cacao products have been strongly linked in acute effect studies to peripheral vasodilation resulting from endothelium-dependent relaxation of vascular smooth muscles induced by nitric oxide, which is thought to be increased primarily by the flavanol monomer, epicatechin, in cacao products (Fisher et al., 2003; Heiss et al., 2006; Karim, McCormick, & Kappagoda, 2000; Schroeter et al., 2006). This vasodilation has been generally observed to peak at 1–2 hr following consumption of a flavanol-rich chocolate product (Schroeter et al., 2006; Taubert, Rosen, Lehmann et al., 2007). These supportive outcomes notwithstanding, Egan, Laken, Donovan, and Woolson (2010) have pointed to important inconsistencies in outcomes, designs, type, and
chemical constituents of cacao confections, dose and time-dependent effects, subject blood pressure (BP) variability, and BP measurement devices, which leave the cardiovascular effects of cacao uncertain at the present time. The endothelium-dependent relaxation (EDR) effects of cacao are somewhat paradoxical, as cacao also contains a number of sympathomimetics, which have vasoconstrictive and generally stimulatory effects, most notably the biogenic amines, tyramine and phenylethylamine (PEA), and the methylxanthines, caffeine and theobromine (Bruinsma & Taren, 1999; Hurst, Martin, & Zoumas, 1982). Although these substances occur in different amounts in various confections, PEA and theobromine generally are found in larger quantities and tend to potentiate the release of catecholamines, thus causing vasoconstriction and elevations in blood pressure. It is not clear at the present time whether these vasoconstrictive effects are offset by the more prominent EDR vasodilatation effects reported above, or whether the time course of these phenomena are different, resulting in more immediate stimulation followed by a delayed vasodilatation effect. Furthermore, these stimulant effects may well explain the general increase in arousal often reported by chocolate consumers (Bruinsma & Taren, 1999; Dillinger et al., 2000). If chocolate indeed has an immediate arousing effect, one might expect to see increased arousal in the brain. However, our review of the chocolate literature over the past decades reveals no studies of the effects of chocolate consumption on central nervous system (CNS) arousal. Martin (1998) investigated the electroencephalographic (EEG) effects of olfactory stimulation with the aroma of chocolate, but did not examine the consumption of chocolate in his research. Small, Zatorre, Dagher, Evans, and Jones-Gotman (2001), in a positron emission tomography (PET) study of brain changes following eating chocolate, were interested only in the immediate (within 10 s) reward characteristics of consuming chocolate and did not allow a sufficient time course for cacao constituents to have an effect on cerebral blood flow following digestion. Francis, Head, Morris, and Macdonald (2006) conducted functional magnetic resonance imaging (fMRI) on 16 healthy young women following 5 days of consumption of a flavanol-rich cocoa beverage compared to a low flavanol beverage and examined blood flow changes 1.5 hr after consumption of the beverage during the performance of a cognitive switching task. Although they found no flavanolspecific effects on reaction times, error rates, or
4 | www.neuroregulation.org
Vol. 2(1):3–28 2015
doi:10.15540/nr.2.1.3
Montopoli et al.
NeuroRegulation
heart rate, they did observe increased fMRI blood oxygenation level-dependent (BOLD) cerebral blood flow (CBF) during the cognitive task following the flavanol-rich cocoa regimen relative to the low flavanol regimen. In a separate pilot study with 4 participants of the time course of CBF changes following an acute dose of flavanol-rich cocoa, Francis et al. reported a peak blood flow response at approximately 2 hr post-ingestion with return to baseline after approximately 6 hr. Reported fMRI images were specific to the cognitive task and not to flavanol ingestion. Although these researchers suggest that the observed effects on CBF may be due to NO-induced EDR, they also point out that the fMRI BOLD response is a neurovascular phenomenon and may result from changes in vascular tone as well as neural activity influenced by stimulants, such as caffeine, in the cocoa product. Nonetheless, these results suggest a flavanolinduced increase in cerebral blood flow consistent with the vasodilation reported in other studies. And, more recently, Camfield et al. (2012), in a study of 61 middle-aged adults who consumed a daily chocolate beverage containing 250 mg or 500 mg of cocoa flavanols compared with a low cocoa flavanol beverage over a 30-day period, found no changes in behavioral measures of accuracy or reaction time on a spatial working memory task but did observe condition-specific amplitude and latency differences on EEG visual evoked potentials (VEP) during the same task. These authors interpreted the observed VEP changes as reflective of increased neural efficiency following the chronic ingestion of cocoa flavanols.
higher cacao-content chocolate (with a high flavanol content) with a low-cacao content chocolate (with no flavanol content) and with balanced sugar and water controls. Sugar controls were included in the present study to control for reported general arousal effects of glucose (Hoffman & Polich, 1998; Hoffman, Friedmann, Saltman, & Polich, 1999). Additionally, as a partial test of the hypothesized acute sympathomimetic effects of cacao, we included a third chocolate condition by the addition of L-theanine to the same higher cacao-content chocolate formulation. L-theanine, an extract of green tea, has been shown in numerous animal and human studies to counteract the stimulating effects of caffeine and stressors, apparently by its ability to bind to the glutamate receptor and to block binding of L-glutamic acid in cortical neurons (Kimura, Ozeki, Juneja, & Ohira, 2007; Mason, 2004;). L-theanine has been found to reduce blood pressure (Yokogoshi et al., 1995; Yokogoshi & Kobayashi, 1998), to elevate posterior EEG alpha activity (Kobayashi et al., 1998), to reduce the psychological and physiological response to a mental stressor (Kimura et al., 2007), and to improve learning in animal models (Juneja, Chu, Okubo, Nagato, & Yokogoshi, 1999). We hypothesized that consumption of the higher cacao-content condition, relative to the low cacao-content, sugar, and water controls, in human volunteers would result in increased activation of the neocortex and increased blood pressure within 1 hr after ingestion and that these effects would be reversed in the higher cocoacontent plus L-theanine condition.
Methods
A recent comprehensive review of the neurobiological effects of cocoa flavanols on cognition and behavior indicates rather strong support for neuroprotective effects of long-term consumption of flavanols on age-related and disease-related cognitive decline but less support for the more immediate effects of cocoa consumption on specific brain mechanisms involved in neurogenesis and neuronal function and connectivity, particularly in humans (Sokolov, Pavlova, Klosterhalfen, & Enck, 2013). These authors encourage and offer a template for future research into effects of cacao on human cognition, mood, and behavior.
Participants A power analysis was conducted to determine the optimal sample size required to detect the hypothesized effect of chocolate on EEG and blood pressure (Howell, 2002). A complex multivariate design was modeled employing 11 dependent variables (9 EEG frequency and 2 blood pressure variables) studied across two repeated measures (pre- and post-ingestion) for each of six treatment conditions. For an alpha level of .05 and a power of .80, sample sizes in each of the 6 treatment cells of 20 allowed a hypothesized medium effect size to be detected.
Given the long-term neuroprotective and neuromodulatory effects of cocoa consumption, the suggested stimulant characteristics of cacao, and the glaring absence of published acute CNS arousal studies, we elected to conduct a controlled EEG study of the comparative effects of consuming a
Consequently, 125 participants (10 males, 10 females in each of the six treatment cells, plus 5 extra participants to allow for possible attrition and outliers) were recruited from the Psychology Department undergraduate voluntary research pool. After exclusion of outliers (3 participants had
5 | www.neuroregulation.org
Vol. 2(1):3–28 2015
doi:10.15540/nr.2.1.3
Montopoli et al.
NeuroRegulation
clinically-elevated blood pressure readings and were referred to the health center), 122 participants completed the study and were analyzed. Participants were between the ages of 18 and 25 years and were excluded if they used illicit drugs, stimulant or depressant medications, or nicotine, if they had diabetes mellitus, or if they were allergic to chocolate or nuts. Women were not tested during their premenstrual or menstrual phase due to the potentially confounding effect of chocolate cravings during this time and because hormone imbalances during these menstrual phases have been shown to affect the EEG (Dusser de Barenne & Gibbs, 1942; Solis-Ortiz, Ramos, Arce, Guevara, & Corsi-Cabrera, 1994). All participants abstained from caffeine and chocolate intake 24 hr prior to the EEG study. The present study was approved by the NAU Institutional Review Board for the Protection of Human Subjects in Research. Materials and Equipment A standard weight scale was used to weigh each participant 1 week prior to study in order to determine the amount of chocolate to administer. Participants were weighed by a same-sex research assistant, and female participants at weigh-in were given a menstrual calendar on which to plot their predicted menstrual cycle. At the initial weigh-in, the participant was briefed as to the nature of the study and the requisite informed consent documents were completed. Blood pressure readings for the study were taken by a HoMedics Automated Blood Pressure Monitor with participants seated and left arm resting at heart level. The three chocolate treatments were prepared by The Hershey Company, individually wrapped in 40 g squares of identical appearance and coded by contents. The higher cacao-content chocolate contained 60% cacao with 15 mg/g of total polyphenols, and 0.37 g/g of sugar; the low cacaocontent chocolate was a white chocolate (colored with 5% Hansen Brown) that contained 0.4 mg/g of total polyphenols, and 0.56 g/g of sugar; the higher cacao-content + L-theanine chocolate contained the identical components as higher cacao-content chocolate above plus 128 mg (3.2 mg/g) of Ltheanine (L-theanine has a Generally Recognized as Safe [GRAS] designation by the FDA and, with recommended dosages of 50–200 mg/serving, the amounts used in this study were well within the recommended dosages). Table 1 presents total ingredients of the three chocolate treatments. Three control treatments were also prepared, comprised of a high sugar beverage treatment containing an
equivalent amount of sugar as the low cacaocontent chocolate (23 g/40 g bar or 0.57 g/kg body weight) dissolved in 350 ml (1.5 cups) of water; a low sugar beverage treatment containing an equivalent amount of sugar as the higher cacao chocolate (14 g/40 g bar or 0.35 g/kg body weight) dissolved in 350 ml of water; and a 350 ml water treatment. For the chocolate and sugar conditions, each participant received 1 g of chocolate for each kg of body weight, with an equivalent amount of sugar for each kg of body weight for the sugar conditions. For example in standard units, a 150 lb participant would receive 2.4 ounces of either of the three chocolate treatments, approximately equivalent to a standard size chocolate bar, 1.38 ounces of sugar in 1.5 cups water, 0.84 ounces of sugar in 1.5 cups water, or 1.5 cups water. The Positive and Negative Affect Scale (PANAS) was used as a brief measure of emotional changes following chocolate consumption (Watson, Clark, & Tellegen, 1988). The PANAS was administered at the beginning of the study prior to treatment before the EEG was attached, immediately following administration of each condition, and again 1 hr 10 min later after a digestion period and second EEG. A Mitsar 201 24-channel EEG acquisition system was used to measure each participant’s EEG frequencies (Mitsar Co. LTD, 1996). The Mitsar 201 DC amplifiers have a 500 Hz digital sampling rate and input impedance not less than 200 МΩ. EEG data were recorded and preprocessed using WinEEG software (Mitsar Co. LTD, 1996), double visually artifacted by two independent artifactors, and power spectral FFT analyzed utilizing NovaTech EEG Eureka and MHyT software (Nova Tech EEG, Inc., 2006). FFT analysis employed Hamming time domain tapering, Blackman frequency domain smoothing, an overlapping FFT windows advancement factor of 8, and a moving average smoothing filter of 3. The International 10–20 placement system was used to attach 19 Ag/AgCl monopolar electrodes on the scalp with mathematically linked-ear references utilizing the Electro-Cap System (Electro-Cap International, Inc., 2006). Electrode impedances were adjusted to < 5 kohms and to within 1 kohm of each other. All data were recorded in a sound attenuated research suite, appointed with the requisite EEG and blood pressure monitoring equipment. Participants were seated comfortably in a recliner and were able to read magazines during the digestion phase and to sit quietly during the EEG recording phases.
6 | www.neuroregulation.org
Vol. 2(1):3–28 2015
doi:10.15540/nr.2.1.3
Montopoli et al.
NeuroRegulation
Table 1 Ingredients of the three chocolate confections used in the present study High Cacao-Content Chocolate per g 4.65 0.339 0.209 0.001 0.078 0.153 0.548 0.1099 0.37 0.0803 0.9297 0 0.576 0.107 2.00 5.27
Low Cacao-Content Chocolate per g 4.88 0.311 0.173 0.0016 0.1456 1.6 0.556 0 0.555 0.084 6.27 0.0117 3.13 0 0.28 2.27
High Cacao-Content + L-theanine Chocolate per g 4.65 0.339 0.209 0.001 0.078 0.153 0.548 0.1099 0.37 0.0803 0.9297 0 0.576 0.107 2.00 5.27
Caffeine, mg Theobromine, mg
0.63 7.14
0.05 0.07
0.63 6.5
Fat, % (analyzed)
40.1
36.7
38.8
Total polyphenols, mg ORAC, micromoles TE Catechin, mg Epicatechin, mg
15 360 0.16 0.88
0.4 19 0.01 0.03
22 250 0.17 0.95
DMAC, mg
10.10
0.03
12.6
PAC-10, mg/whole product PACs 1 mers PACs 2 mers PACs 3 mers PACs 4 mers PACs 5 mers PACs 6 mers PACs 7 mers PACs 8 mers PACs 9 mers PACs 10 mers
4.60 0.83 0.61 0.56 0.56 0.49 0.42 0.36 0.32 0.23 0.24
< 0.001 < 0.001 < 0.001 < 0.001 < 0.001 < 0.001 < 0.001 < 0.001 < 0.001 < 0.001 < 0.001
5.69 0.99 0.78 0.62 0.73 0.51 1.1 0.35 0.22 0.26 0.12
Component Calories Fat, g (calculated) Sat fat, g Trans fat, g Cholesterol, mg Sodium, mg Carbohydrates, g Dietary fiber, g Sugar, g Protein, g Vitamin A, IU Vitamin C, mg Calcium, mg Iron, mg Magnesium, mg Potassium, mg
Note: Nutrition information calculated using Genesis® R&D SQL nutritional analysis and labeling system (ESHA Research, Salem, OR 2007). DMAC = 4-dimethylaminocinnamaldehyde total flavanol content; ORAC = Oxygen Radical Absorbance Capacity general antioxidant activity; PACs = proanthocyanidin flavanol polymers.
7 | www.neuroregulation.org
Vol. 2(1):3–28 2015
doi:10.15540/nr.2.1.3
Montopoli et al.
NeuroRegulation
Catalogs and magazines were available for participants to read following the ingestion of the treatments. These materials were reviewed in order to remove any overly emotional or stimulating articles that could have potentially affected arousal. Reading materials included clothing, climbing, and hiking catalogs and computer, health-related, and men’s and women’s magazines.
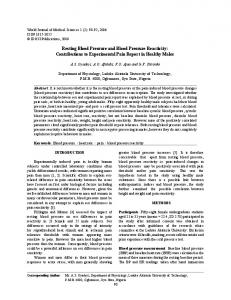
blind as to the nature of the liquid in the cup, with the exception that the RA could visually differentiate the liquid water/sugar water controls from the solid chocolate conditions. Participants were similarly partially blind as to the exact nature of the substance they were consuming, either an unknown chocolate substance or sugar water. When the participant arrived at the laboratory, they were seated in the recliner and were given the first PANAS to complete; blood pressure was then recorded and the Electro-Cap and EEG equipment were attached, during which time the participant completed a brief questionnaire to substantiate lack of drug use over the past 2 days and lack of caffeine and food intake for the past 24 and 4 hr, respectively. A 10-min, eyes-closed resting baseline EEG was then recorded. Afterwards, each participant was administered their respective chocolate, sugar water, or water treatment, was given 5 min to ingest the substance, and was administered the PANAS again. Sixty min were then allowed for digestion and absorption of the chocolate or water treatments; participants were also visually monitored for alertness. Following the 60-min period, a second 10-min, eyes-closed resting EEG was recorded, then blood pressure was taken, and a final PANAS was administered. The Electro-Cap was then removed and the participant was debriefed. Figure 1 presents the timeline for the study.
Procedure Participants were randomly assigned to 1 of 6 conditions: higher cacao-content, low cacao-content, higher cacao-content + L-theanine chocolates, high sugar water, low sugar water, and water. To preclude blood sugar spikes from an overnight fast from affecting the EEG but to allow more direct effects of each of the conditions without the interference of recent food intake, participants were required to eat breakfast or a meal and then to fast for 4 hr before the experiment. Although cortisol levels were not measured in this study, in order to keep them at their nadir, all participants were run between the hours of 1 and 6 p.m. (Dmitrieva, Almeida, Dmitrieva, Loken, & Pieper, 2013; Karlamangla, Friedman, Seeman, Stawksi, & Almeida, 2013). The type of chocolate condition for each participant was known only to the primary author, who, prior to each test session, carefully weighed out, packaged, and secretly labeled the substance. This package was then passed to a blind research assistant (RA) who conducted the actual test. The sugar water and water conditions were prepared in a similar fashion and the RA was
Time: 0
15
25
30
Record Baseline EEG Application of Electro-Cap
Phase: PANAS Blood pressure recorded
90 ß
Digestion
Ingestion of chocolate or sugar
Questionnaire
110
Remove Cap
à Record EEG
PANAS administered
PANAS Blood pressure recorded
Figure 1. Timeline for the study in minutes.
Design and Analysis Nine frequency bins were identified for analysis: delta = 0–3.99 Hz, theta = 4–7.99 Hz, low theta = 4– 5.99 Hz, high theta = 6–7.99 Hz, alpha = 8–11.99
Hz, low alpha = 8–9.99 Hz, high alpha = 10–11.99 Hz, beta = 12–29.99 Hz, and gamma = 30–60 Hz. Following FFT power spectral analyses, absolute power values for each frequency and for each of the
8 | www.neuroregulation.org
100
Vol. 2(1):3–28 2015
doi:10.15540/nr.2.1.3
Montopoli et al.
NeuroRegulation
19 electrode sites were identified and post-treatment minus pre-treatment difference scores for each frequency and site were tabulated, in order to determine the direction and magnitude of change from baseline in absolute EEG power for each condition. Absolute power differences for each electrode were grouped into traditional functional clusters of frontal (Fp1, Fp2, F7, F3, Fz, F4, F8), central (C3, Cz, C4), parietal (P3, Pz, P4), occipital (O1, O2), and temporal (T3, T4, T5, T6) regions. A factorial Analysis of Variance (ANOVA) was then conducted on each functional cluster for each frequency across each of the treatment conditions. In order to investigate the secondary effect of gender, an additional independent variable was included in each analysis, making separate 2 (between-groups: gender) x 6 (between-groups: treatment condition) analyses of post-treatment minus pre-treatment EEG differences for each functional cluster. As this was an investigational study and the percent cacao in the maximal treatment condition was relatively low (60%) thus lowering the magnitude of effect, simple effects analyses of EEGs were conducted utilizing LSD post-hoc t-tests. Blood pressure and PANAS effects were assessed utilizing ANOVA with simple effects comparisons made by Tukey HSD tests. Since surface EEG recordings are aggregates of farfield potentials generated across a 3-dimensional, quasi-spherical cortical space, we wondered what deeper cortical structures might be most impacted by the biochemical constituents of chocolate following our neutral reading task. Low-resolution brain electromagnetic tomography (LORETA) is a neuroimaging software companion to contemporary EEG analyses which allows the triangulation of these surface scalp potentials to their cortical source generators (Pascual-Marqui, 1999; Pascual-Marqui, Esslen, Kochi, & Lehmann, 2002; Pascual-Marqui, Michel, & Lehman, 1994). LORETA algorithms compute a 3-dimensional inverse solution space of cortical gray matter and hippocampi mapped onto a probabilistic Talairach atlas partitioned into 2394 7 3 mm volumetric units, or voxels. Brodmann anatomical labels may be reported for relevant regions of interest utilizing the Montreal Neurological Institute (MNI) realistic head model (The KEY Institute for Brain-Mind Research, 1995). For the present study, LORETA mapping was utilized in a purely descriptive fashion post hoc to identify cortical regions of interest involved in obtained effects. LORETA Current Source Density (CSD) maps were generated from between-groups comparisons of the natural log transformation of FFT power spectral
output for each statistically significant frequency and functional cluster.
Results Participant Characteristics Our sample of 122 participants was a young, healthy group of undergraduate student volunteers. Mean baseline blood pressures were 73.75 (7.75) mmHg DBP and 117.12 (9.98) mmHg SBP. Males had significantly higher SBP at baseline, 120.32 (8.50) mmHg SBP, than females, 114.03 (10.39) mmHg SBP; t(120) = 3.65, p < .0001; but these values were within normal limits and there was no significant gender by condition interaction at baseline, F(1, 5) = 1.37, p = .24. Analysis of Mood Changes PANAS scores before, immediately after, and 70min after consumption of each treatment and for males and females were analyzed by a 2 (gender) x 6 (conditions) repeated measures ANOVA separately for positive and negative moods. Neither analysis revealed significant main effects for treatment, Positive Mood: F(5, 110) = 1.42, p = 0.22; Negative Mood: F(5, 110) = 1.56, p = 0.18; or gender, Positive Mood: F(1, 110) = 0.22, p = 0.64; Negative Mood: F(1, 110) = 3.06, p = 0.08. There was a trend for males to show slightly higher negative moods across all conditions. Analysis of EEG Changes EEG Absolute Power values for each of five primary frequencies for each electrode across each condition at Baseline, at Post-Treatment, and for Difference Scores are presented in Tables 2 through 6 in the Appendix. Values in each table are Absolute Power values for that frequency with decimals removed for ease of presentation (i.e., 608 4 = .0608, or .0608 x 10 ). In the presentation of these results, a negative difference score indicates that the specified EEG power decreased following treatment (post-treatment – pre-treatment). For the functional cluster analyses (i.e., frontal, central, parietal, occipital, and temporal), EEG regional cluster scores for individual participants which exceeded 3.29 standard deviation units from the mean for that cluster were identified as outliers and were replaced by the next lower score for that cluster (Tabachnick & Fidell, 2013). Subsequent tests for departures from normality and homogeneity of variance revealed no significant departures for the tested independent variables, with the exception of gamma parietal, which showed a significant departure for the homogeneity of variance
9 | www.neuroregulation.org
Vol. 2(1):3–28 2015
doi:10.15540/nr.2.1.3
Montopoli et al.
NeuroRegulation
assumption. This latter variable was Log10 transformed, subsequently tested for normality and homogeneity of variance, and was found to meet requirements for analysis. Regional cluster scores for each frequency and condition were then entered into separate 2 x 6 ANOVAs. These results are presented in Table 7. These ANOVA analyses revealed significant main effects for Condition for frontal theta, F(5, 110) = 2 3.12, p = .011, η = .124; parietal theta, F(5, 110) = 2 2.38, p = .043, η = .097; and temporal theta, F(5, 2 110) = 2.72, p = .024, η = .110; with a trend for 2 central theta as well, F(5, 110) = 2.00, p = .085, η = .083. A significant main effect for Gender was also found for frontal theta, F(1, 110) = 5.94, p 2 = .016, η = .051, with males showing significantly greater decreases in frontal theta than females across all conditions. No interactions were found to be statistically significant. Planned comparisons revealed frontal theta decreases from Baseline to Post-Ingestion to be significantly greater for the higher cacao-content chocolate condition relative to the water (p = .006), high sugar (p = .001), low sugar (p = .005), and low cacao-content chocolate (p
= .006) conditions, with these latter conditions actually showing increases in frontal theta. Figure 2 presents these effects graphically for frontal theta. (For Figures 2 through 6, the ordinate scale is set to be equivalent across all figures for ease of magnitude comparisons.) Similar effects were found for parietal theta and temporal theta with the higher cacao-content chocolate confection showing significant decreases with consumption relative to water (p = .021, .026), high sugar (p = .009, .002), and low cacao-content chocolate (p = .005, .008), which each showed increases across the conditions. Additionally, the higher cacao-content chocolate + L-theanine condition showed significantly smaller increases (p = .042) in temporal theta compared to the high sugar condition across treatment. Figures 3 and 4 present these outcomes graphically. These results indicate significant decreases in frontal, parietal, and temporal theta EEG frequencies following the consumption of a 60% cacao confection relative to increases across these cortical regions following consumption of water, high sugar, an approximately 0% cacao-content confection, and, for frontal theta, a low sugar condition.
Figure 2. Frontal theta EEG absolute power changes post-treatment minus pre-treatment for each condition, showing significant decreases for higher cacao relative to water, high sugar, low sugar, and low cacao. SE bars = +/- 1 SE.
10 | www.neuroregulation.org
Vol. 2(1):3–28 2015
doi:10.15540/nr.2.1.3
Montopoli et al.
NeuroRegulation
Table 7 EEG Results for Each Frequency and Regional Electrode Cluster by Condition Chocolate Condition Gender Interaction 2 2 2 Effect Effect Effect F (p) (η ) F (p) (η ) F (p) (η ) .54 (.74) (.02) .16 (.69) (.001) .68 (.64) (.03) 1.01 (.42) (.04) .16 (.69) (.001) .46 (.81) (.02) .70 (.63) (.03) .17 (.68) (.002) .58 (.72) (.03) .44 (.82) (.02) .08 (.78) (.001) 1.16 (.33) (.05) .75 (.59) (.03) .01 (.93) (.000) .56 (.73) (.03) 3.12 (.01) (.12) d < a,b,c,e 5.94 (.02) (.05) m