This article was downloaded by: [Gonçalo Homem de Almeida Correia] On: 02 September 2013, At: 12:44 Publisher: Taylor & Francis Informa Ltd Registered in England and Wales Registered Number: 1072954 Registered office: Mortimer House, 37-41 Mortimer Street, London W1T 3JH, UK
Journal of Intelligent Transportation Systems: Technology, Planning, and Operations Publication details, including instructions for authors and subscription information: http://www.tandfonline.com/loi/gits20
The added-value of accounting for users' flexibility and information on the potential of a station-based one-way carsharing system: An application in Lisbon, Portugal a
a
Gonçalo Homem de Almeida Correia , Diana Ramos Jorge & David Marques Antunes
a
a
Department of Civil Engineering , University of Coimbra , Rua Luís Reis Santos , 3030-788 , Coimbra , Portugal Accepted author version posted online: 27 Aug 2013.
To cite this article: Journal of Intelligent Transportation Systems (2013): The added-value of accounting for users' flexibility and information on the potential of a station-based one-way carsharing system: An application in Lisbon, Portugal, Journal of Intelligent Transportation Systems: Technology, Planning, and Operations, DOI: 10.1080/15472450.2013.836928 To link to this article: http://dx.doi.org/10.1080/15472450.2013.836928
Disclaimer: This is a version of an unedited manuscript that has been accepted for publication. As a service to authors and researchers we are providing this version of the accepted manuscript (AM). Copyediting, typesetting, and review of the resulting proof will be undertaken on this manuscript before final publication of the Version of Record (VoR). During production and pre-press, errors may be discovered which could affect the content, and all legal disclaimers that apply to the journal relate to this version also.
PLEASE SCROLL DOWN FOR ARTICLE Taylor & Francis makes every effort to ensure the accuracy of all the information (the “Content”) contained in the publications on our platform. However, Taylor & Francis, our agents, and our licensors make no representations or warranties whatsoever as to the accuracy, completeness, or suitability for any purpose of the Content. Any opinions and views expressed in this publication are the opinions and views of the authors, and are not the views of or endorsed by Taylor & Francis. The accuracy of the Content should not be relied upon and should be independently verified with primary sources of information. Taylor and Francis shall not be liable for any losses, actions, claims, proceedings, demands, costs, expenses, damages, and other liabilities whatsoever or howsoever caused arising directly or indirectly in connection with, in relation to or arising out of the use of the Content. This article may be used for research, teaching, and private study purposes. Any substantial or systematic reproduction, redistribution, reselling, loan, sub-licensing, systematic supply, or distribution in any form to anyone is expressly forbidden. Terms & Conditions of access and use can be found at http:// www.tandfonline.com/page/terms-and-conditions
ACCEPTED MANUSCRIPT The added-value of accounting for users’ flexibility and information on the potential of a stationbased one-way carsharing system: An application in Lisbon, Portugal Gonçalo Homem de Almeida Correia (corresponding author)
Downloaded by [Gonçalo Homem de Almeida Correia] at 12:44 02 September 2013
Assistant Professor Department of Civil Engineering University of Coimbra Rua Luís Reis Santos 3030-788 Coimbra Portugal Phone: +351-239-797105 Email:
[email protected] Diana Ramos Jorge Department of Civil Engineering University of Coimbra Rua Luís Reis Santos 3030-788 Coimbra Portugal Email:
[email protected] David Marques Antunes Department of Civil Engineering University of Coimbra Rua Luís Reis Santos 3030-788 Coimbra Portugal Email:
[email protected]
1
ACCEPTED MANUSCRIPT
ACCEPTED MANUSCRIPT
ABSTRACT Carsharing systems are an alternative to private transportation whereby a person may use an automobile without having to own the vehicle. The classical systems in Europe are organized in stations scattered
Downloaded by [Gonçalo Homem de Almeida Correia] at 12:44 02 September 2013
around the city where a person may pick-up a vehicle and afterwards return it to the same station (roundtrip). Allowing a person to drop-off the vehicle at any station, called one-way system, poses a significant logistics problem because it creates a significant stock imbalance at the stations, which means that there will be times when users will not have a vehicle available for their trip. Previous mathematical programming formulations have tried to overcome this limitation by optimizing trip selection and station location in a city in order to capture the best trips for balancing the system. But there was one main limitation: the users were assumed to be inflexible with respect to their choice of a station, and held to use only the one closest to their origin and destination. If the user is willing to use the second or even the third closest station he could benefit from using real-time information on vehicle stocks at each station and be able to select the one with available capacity. In this paper we extend a previous model for trip selection and station location that takes that aspect into account by considering more vehicle pick-up and drop-off station options and then apply it to a trip Origin-Destination matrix from the Lisbon region in Portugal. Through the extended formulation we were able to conclude that user flexibility allied with having information on vehicle stocks increases the profit of the company as people will go directly to a station with a vehicle available thus making the use of the fleet more efficient. Observing the size of the stations resulting from the model we also concluded that the effect of information is enhanced by large carsharing systems consisting of many small stations.
Keywords: One-way carsharing, transportation demand management, mixed integer programming, value of information.
2
ACCEPTED MANUSCRIPT
ACCEPTED MANUSCRIPT
INTRODUCTION
Recent decades have seen some changes in how urban transportation is regarded. At first the
Downloaded by [Gonçalo Homem de Almeida Correia] at 12:44 02 September 2013
increasing use of private transport provided better access in industrialized countries, but in the long-term it has had serious negative impacts, such as pollution and excessive energy and time consumption, especially in urban areas where demand is concentrated in peak hours (The 2010 Urban Mobility Report, 2010). This increase in negative externalities has raised concerns in societies, and these have been transferred to policymakers. There is now a general agreement on the need to find strategies that aim at minimizing these impacts while allowing people to participate in the same activities as before. These strategies are usually classified as transportation demand management measures and one such measure is carsharing. Carsharing is a transportation alternative that involves having a small to medium fleet of vehicles available at several stations to be used by a relatively large group of members. In the past few years carsharing has witnessed exponential growth and demonstrated notable reductions in vehicle ownership trends (Haefeli, et al., 2006, Shaheen & Cohen, 2007, Martin, et al., 2010, Shaheen, et al., 2012). This kind of system first appeared in Europe in the early 1940s, as a way to reduce private transportation costs. In the US, carsharing only appeared in the eighties and in contrast to European users the first adopters were more concerned with personal utility than social or environmental benefits (Lane, 2005, Shaheen, et al., 2006). Nowadays carsharing has been implemented almost all over the world and its use is still increasing (Shaheen, et al., 1999, Barth, et al., 2006, Enoch & Taylor, 2006, Shaheen & Cohen, 2007).
3
ACCEPTED MANUSCRIPT
ACCEPTED MANUSCRIPT These systems have been shown to have a positive impact on urban mobility, mainly through a more efficient use of each automobile (Litman, 2000, Schuster, et al., 2005). The decrease in car ownership rates resulting from carsharing, has led to a reduction in car use (Celsor and MillardBall, 2007)
Downloaded by [Gonçalo Homem de Almeida Correia] at 12:44 02 September 2013
New ideas are still appearing in the carsharing market, demonstrating the relevance of the concept. One idea is the so called Peer-to-Peer system. Peer-to-peer carsharing is a system in which car owners can convert their personal vehicles into shared cars and rent them to other drivers on a short-term basis (Hampshire & Gates, 2010; Shaheen, et al., 2012). Despite this, there is still one limitation that companies have not yet been able to successfully overcome and this is the obligation to return the vehicle to the station where it was picked-up (round-trip mode) (Barth and Shaheen, 2002). The alternative is one-way carsharing: a system that allows users to pick-up a vehicle at one station and return it to another. This system offers more flexibility to users because people often do not want to do a full round trip (Barth and Shaheen, 2002). One-way systems are the usual practice in bikesharing schemes, such as Vélib in Paris (Shaheen et al., 2010). However, despite its flexibility one-way carsharing creates a problem for the service providers because the uneven nature of the trips means there is an uneven distribution of vehicles across stations during the day, which results in a loss of level of service provided to the clients (Kek, et al., 2009). While in bikesharing systems the redistribution of vehicles can be done using trucks that move bicycles from one station to the other, in the case of cars this process is not that easy, because vehicles must be driven (Shaheen et al., 2010).
4
ACCEPTED MANUSCRIPT
ACCEPTED MANUSCRIPT Large carsharing companies like ZipCar have not brought to the market the one-way scheme, perhaps because providing this service is more complex. Furthermore, there have been some unsuccessful experiments of which the most striking example is that of DIRACC deployed by Honda in Singapore. As membership grew, the system could not maintain the quality of service
Downloaded by [Gonçalo Homem de Almeida Correia] at 12:44 02 September 2013
offered initially because everybody expected cars to be available at all times. This could not be guaranteed because one-way trips left the system with a significant imbalance in vehicle stocks (The Straits Times, 2008). Currently there are just a few one-way carsharing ventures in operation. The largest is the so called Car2Go Company created by the Daimler car manufacturers group. This system started in March, 2009, in Ulm, Germany, and it was later expanded to Austin, Texas, USA. Recently they have expanded to more cities: Washington DC, San Diego and Portland in the US, Vancouver, in Canada, and Lyon in France (Car2Go, 2012). There have been some attempts to solve the logistics problem of one-way carsharing from an operations research perspective (Fan, et al., 2008) (Kek, et al., 2009). The planning of bikesharing systems has also been approached from this perspective (Lin & Yang, 2011; Sayarshad et al., 2012). Correia and Antunes (2012) presented a study that involves an optimization approach to station location and trip selection schemes in order to maximize the profit of a carsharing company. They analyzed the example of a company working with one-way trips between a series of stations. This is closer to the DIRACC system than the Car2Go because in the latter the system does not have stations. The purpose was to find the best configuration possible to maximize the profit from running such a system. Three different mixed integer programming (MIP) models were developed. These models had in common the station location, but each had a
5
ACCEPTED MANUSCRIPT
ACCEPTED MANUSCRIPT different trip selection scheme. In the first model trips are freely accepted or rejected according to profit maximization. In the second, all demand between existing stations must be satisfied, which guarantees a full level of service to the clients that have a station nearby. Finally, in the third, trips can only be rejected if there are no vehicles available at the pick-up station. The
Downloaded by [Gonçalo Homem de Almeida Correia] at 12:44 02 September 2013
objective of the three formulations was to maximize the company’s profit in a typical business day of the operating period. The authors took the city of Lisbon (Portugal) as a case study and established a set of possible locations for the stations and a trip OD matrix for the region. Results showed that offering a high level of service to the clients of a one-way carsharing system without relocation techniques leads to financial losses due to the huge fleet necessary to cope with the demand, as vehicles are moved from stations where there is high demand to stations where demand is low at each period of the day (Correia and Antunes, 2012). Despite the interest of these mathematical models the approach had several shortcomings. One was that it assumed that people would only use the station nearest to their origin and destination. In the real world persons are more flexible and may be willing to go to a second or even a third station. In this paper we recognize that this flexibility could have an impact on the viability of these schemes by allowing the system to cope better with differentiated vehicle stocks across stations. Moreover, modern transportation systems make use of providing real time information to clients in order to improve level of service and this has not been taken into account before for the case of carsharing modeling. In traffic it has been long proved that real-time information in variable message signs and other media can, under some conditions, improve the level of service
6
ACCEPTED MANUSCRIPT
ACCEPTED MANUSCRIPT in the road by reducing travel times or reducing the variance around the mean travel time (Emmerink et al, 1995; Toledo et al, 2006; Tseng et al, 2011). The influence of information on public transport efficiency and travelling behavior has also been studied (Abdel-Aty et al., 1996; Golob & Regan, 2001; Chorus C. et al., 2010). The main focus
Downloaded by [Gonçalo Homem de Almeida Correia] at 12:44 02 September 2013
has been put on the demand increase that can be reached by using real time information with results supporting the conclusion that although it does not bring a significant number of users to change mode in the short run (Chorus C. et al., 2006) it does allow improving significantly the experience of current users which may on the long run, when other stronger circumstances happen, act as a leverage for a positive mode change (Kenyon & Lyons, 2003; Watkins et al, 2011; Tang & Thakuriah, 2012). The information acts on improving the desirability of transit systems mainly through reducing the travel time of the whole travel process, including pre trip planning, wayside and on-board stages (Grotenhuis et al., 2007). Information is also important for managing parking where having information on existing supply may deter people from using the car, thus making a better more direct parking choice or even changing transport mode (Khattak & Polak, 1993; Caicedo, 2010) Big carsharing services usually give users the possibility of having real time information on the existing stock of vehicles in each station in the city, which allows them to cut short their search by going directly to a station that has an available vehicle. Previous carsharing models did not take this into account therefore they cannot test the advantage of modern intelligent transportation systems. Thus these models may be underestimating one-way carsharing systems’ economic performance because more flexibility may lead to a better stock management in the stations.
7
ACCEPTED MANUSCRIPT
ACCEPTED MANUSCRIPT Hence, in the present work we hypothesize that flexibility and information may play an important role in the economic viability of one-way carsharing and propose significant changes to the first MIP optimization model presented by Correia and Antunes 2012) in which trips and station locations are freely selected by the system for profit maximization. The objective is to
Downloaded by [Gonçalo Homem de Almeida Correia] at 12:44 02 September 2013
assess the impact of information on the operation of the described station-based one-way carsharing system. The paper is structured as follows: in the next section the new MIP model that looks at the impact of flexibility and information on one-way carsharing is presented and explained. To test the new formulation we use a trip matrix instance from the same case study area used for the previous paper (Lisbon), which is presented in the subsequent section. This is followed by the results of that application. The paper finishes with the main conclusions of the work regarding the influence of flexible users under the possibility of having real time information on vehicle stocks.
NEW MIP MODEL FOR MEASURING THE IMPACT OF VEHICLE STOCKS INFORMATION ON CARSHARING PROFIT
In the present paper we analyze a carsharing company that accepts one-way trips between any pair of stations in a city. These stations have a limited capacity (parking spaces); a trip can only be accepted if there is a vehicle available; and a vehicle can only be returned to a station if there is an empty parking space. No type of vehicle relocation operation is used for balancing vehicle stocks. Due to the documented complexity of managing one-way systems (Fan, et al., 2008, Kek,
8
ACCEPTED MANUSCRIPT
ACCEPTED MANUSCRIPT et al., 2009, Correia and Antunes, 2012) we consider that a trip between a pair of stations can be rejected because accepting it would lead to a non-optimal daily profit. In order to measure the effect of flexibility and information in this carsharing system profit we have considered three scenarios that evolve from the basic model developed by
Downloaded by [Gonçalo Homem de Almeida Correia] at 12:44 02 September 2013
(Correia & Antunes, 2012):
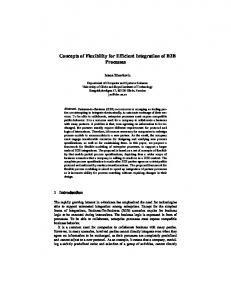
Users are inflexible and only use the station closest to their origin and destination. A user walks in to the closest station and asks for a vehicle to go to a particular station. If no vehicle is available for his trip, it counts as a rejected trip (see Figure 1a for a scheme of this scenario). Users are flexible and willing to use the second and third closest stations. A flexible user goes first to the station closest to his origin and asks to travel to a specific station, but the company will not guarantee that there will be a parking space in that station. If he finds a vehicle available, he will use this vehicle, otherwise, he moves to a second station (the station nearest to the first one). If the user cannot find a vehicle available in the second station, he will then move to a third one (the one that is closest to the second one). If the user cannot find a vehicle available at this last option, it will account as a rejected trip. The behavior is the same at the destination. In this case if the user cannot find a parking space in the first or second closest station, they will not pay for the time needed to travel to the second or the third stations (because it is not their fault that there is no capacity available). Thus we avoid the pernicious effect of the model trying to
9
ACCEPTED MANUSCRIPT
ACCEPTED MANUSCRIPT obtain a higher profit by sending customers to the second and third stations. However, we do not consider the possibility of clients trying to deceive the system by choosing a destination that would allow them to save part of the cost of their trip, which would probably be achieved by selecting the station with the
Downloaded by [Gonçalo Homem de Almeida Correia] at 12:44 02 September 2013
highest demand (see Figure 1b for a scheme of this scenario). Users are flexible and have information about the vehicles available in the three closest stations to their origin and also on the available parking places in the three stations closest to their stated destination. A client has real time access, through the web, to the vehicle stocks and so he can move directly to the stations that can satisfy their trip without wasting time. It does not make sense to consider a scenario where inflexible users have information, it is assumed that the inflexible user would not want to travel more than the minimum required to reach a carsharing station (see Figure 1c for a scheme of this scenario).
These three scenarios: inflexible users; flexible users, and flexible users with information on vehicle stocks, can be expressed in a single MIP model that translates the three situations just by changing inputs. This is based on the first model proposed by Correia & Antunes (2012). In that formulation trips were introduced into the model as vectors of aggregated trips discretized in beginning and end time steps of 10 minutes. To study the value of flexibility and information we have to move to an individualized trip model. This lets the model decide on different combinations of a departure station (of the three closest) and all possible combinations in the
10
ACCEPTED MANUSCRIPT
ACCEPTED MANUSCRIPT destination (the three closest) including all extra walking and driving steps necessary to access these nodes.
Downloaded by [Gonçalo Homem de Almeida Correia] at 12:44 02 September 2013
(Figure 1)
The model is described next, along with the sets, decision variables, parameters, objective function and linear constraints:
Sets
P 1,..., I : Set of potential locations for the carsharing stations, where I represents the
maximum number of locations. This must be selected a priori according to the city mobility reality. P1n hypothesis 1,hypothesis 2,hypothesis 3 : Subset of P that represents the three closest
potential locations to the origin of user n up to a maximum travel time of 30 min (trip data base obtained through a representative survey). In the case of the inflexible user only one hypothesis is considered (the closest one). In the case of a flexible user without information, the set is defined by: closest station, closest station to the first closest station and closest station to the second closest station. In the case of having information, the three hypotheses are the three closest to the origin, as the user will only travel to the closest station with a vehicle available; P 2n hypothesis 1,hypothesis 2,hypothesis 3 : Subset of P that represents the three closest
potential locations to the destination of user n up to a maximum travel time of 30 min. In the
11
ACCEPTED MANUSCRIPT
ACCEPTED MANUSCRIPT case of a flexible user without information, the set is defined by: closest station, closest station to the first closest station and closest station to the second closest station; when there is information, the three hypothesis are the three closest to the destination, as the user will only travel to the closest station with a parking space available;
Downloaded by [Gonçalo Homem de Almeida Correia] at 12:44 02 September 2013
O 1,..., D : Set of possible sizes for the stations, where D is the maximum number of possible
sizes; M 1,..., T : Set of time steps. T is the limit of the analysis period; E 11 ,..., it 1 , it , it 1 ,..., IT : All the nodes in the space-time network, P M ;
V 1,..., N : Set of trips (each trip is a different user) where N is the total number of trips
considered (total number of users).
Decision variables
yik : Binary variable denoting the existence of a station in location i of size k, i P and i P ;
X int j
t t ij
: Binary variable that denotes if a trip n originates in station i and ends in station j from
time step t to time step t ijt , it , jt E , i P1n , j P 2n . ait : Number of vehicles that are parked at station i at time step t, it E ; Sit it 1 : Number of vehicles that are parked at station i between time step t and t 1 , it E ;
Data vectors
12
ACCEPTED MANUSCRIPT
ACCEPTED MANUSCRIPT
ijt : Matrix of trip time, in time steps, between location i and j when departure time is t, it E , j P ;
Downloaded by [Gonçalo Homem de Almeida Correia] at 12:44 02 September 2013
ij : Matrix of trip distances through the road network between location i and j.
Parameters
Lc : Price paid by the client for each time step driven; Cm : Maintenance cost of each parking space per day (paid to the municipality); Cc : Operational cost of a vehicle (wear, maintenance, and fuel) which is dependent on the distance travelled; Cv : Cost related to the ownership of a vehicle per day; p k : Number of parking spaces of a station, of size k, i P ;
n : Time at which each trip n begins (which is when the traveler leaves home and not when he picks-up a vehicle at the station);
ni : Time, in cycles, which a user takes walking to the stations belonging to the subset P1n . In the case where users have no information, this time includes all the walking involved until the user reaches a station with a vehicle available, whereas in the situation where users have information this is the time taken to walk directly to the station with a vehicle available.
13
ACCEPTED MANUSCRIPT
ACCEPTED MANUSCRIPT ni : Driving time, in cycles, which a user spends finding a station with a parking space available when he is flexible but has no information, with this station belonging to the subset P 2n .
ni : Time, in cycles, which a user takes by foot to reach his/her final destination after parking the
Downloaded by [Gonçalo Homem de Almeida Correia] at 12:44 02 September 2013
vehicle at a station belonging to subset P 2n ;
Objective function and constraints
Max P
X in
j ni ni ni ij
n N it , jt E i P1n , j P 2n
L c
ni ij
Cc ij Cm
i I ,k O
yik p k Cv ai1
(1)
i I
(2)
Where, ni n ni .
subject to,
nN i P 2n
X njt 'it
X
n it 1 jt ''
ait1 ait , it E / i1 , i P1n
nN i P1n
Where, t ' t tji' ni
(3)
(4)
t '' t 1 ijt 1 ni
(5)
(6)
14
ACCEPTED MANUSCRIPT
ACCEPTED MANUSCRIPT
Sit it 1 ait
jt P 2n ,n N
X int j
t ijni ni
,it E , i P1n
ait yik p k , it E
(7)
k O
X in
Downloaded by [Gonçalo Homem de Almeida Correia] at 12:44 02 September 2013
i P1n , j P 2 n
k i
y
j ni ni ni ij ni
1, n N
(8)
1, i N
(9)
k O
yik 0,1 k O, i P
X int j
t t ij
(10)
0,1 n N , it , jt E , i P1n , j P 2 n
ait is integer it E
(11) (12)
The objective function (1) maximizes the total daily profit of the one-way carsharing company, taking into consideration the revenue for each time cycle traveled by a customer, the operating cost of a vehicle, the maintenance cost of each parking space per day and the cost related to the ownership of a vehicle per day, where equation (2) denotes the time at which the user picks up the vehicle at the departure station. Constraints (3) update the number of vehicles at each station i at time step t, where the time step t’ (equation (4)) represents the instant at which trips that reach that station i at time t began and t’’ (equation (5)) represents the instant at which trips that began at t-1 in station i ended. Constraints (6) compute the stock of vehicles between time step t and t+1. Constraints (7) ensure that the number of parked vehicles is less than the capacity of the station and if there is no station in location i, there will be no vehicle capacity in that location. Constraints (8) guarantee that for each trip n N there is just one possible trip configuration
15
ACCEPTED MANUSCRIPT
ACCEPTED MANUSCRIPT (pick-up and drop-off station) or the trip is not made. Constraints (9) ensure that at location i there can only be a station with one of the possible sizes O. Constraints (10) and (11) guarantee that variables yik and X int j
t ijt
are binary. Finally constraints (12) ensure that variables ait are
Downloaded by [Gonçalo Homem de Almeida Correia] at 12:44 02 September 2013
integer.
THE LISBON CASE-STUDY
Lisbon is the case study used to test the model. Lisbon is the capital of Portugal and also the capital of the Lisbon Metropolitan Area. The main transport modes in the city are the subway and buses. Despite having a good quality transportation system the lower house prices in the surrounding neighborhoods have led to considerable displacement of people living in the outskirts ,which has resulted in major commuter movements in and out of the city at peak hours (Oliveira and Pinho, 2010). The Origin-Destination matrix of the city used in the paper was obtained through a mobility survey carried out in the 1990s in the metropolitan area, which was updated with another survey performed in 2001 and it is still the best geo-coded trip information available on commuter mobility in the city. The objective was to have a realistic urban trip matrix instance that we could use to avoid working with a synthetic example. The advantage is working with both commuter and city center trips which are present in any large city in the world. Since not all the trips presented in the survey are of interest for a one-way carsharing system, they were filtered according to the following criteria:
16
ACCEPTED MANUSCRIPT
ACCEPTED MANUSCRIPT -
Beginning and end of the trip within the municipality of Lisbon (the objective is only to analyze the trips inside the municipality of Lisbon);
-
Euclidean distance greater than 1km. Shorter trips are usually not associated to
Downloaded by [Gonçalo Homem de Almeida Correia] at 12:44 02 September 2013
carsharing systems (Cervero, 2003); -
Age between 18 and 55 years old. The traditional carsharing systems have a lower usage rate for ages above 55 years old (Haefeli et al, 2006; Burkhardt & Millard-Ball, 2006; Sioui et al., 2012).
-
Duration of the trip longer than 10 minutes (the same reason as the minimum distance) (Cervero, 2003);
-
The trip has to start after 6:00am and has to finish before midnight (outside of this period demand is very low when compared to the rest of the day thus due to limited resources we chose to limit our analysis to 18 hours/day, though in principle it would be desirable to work with 24-hour because it is how companies operate today);
The results of the application of these criteria were 1776 trips surveyed, which represent about 4% of the trips in the municipality of Lisbon. These 4% are consistent with the highest market share of traditional round-trip carsharing (Burkhardt and Millard-Ball, 2006, Haefeli, et al., 2006). In the one-way mode we might reasonably expect an increase of demand given the higher flexibility, however, we do not have access to a demand model that would allow relating that flexibility with a specific demand increase and it is rather complex to create that model given the specificities of carsharing (Ciari et al., 2012).
17
ACCEPTED MANUSCRIPT
ACCEPTED MANUSCRIPT With respect to the location of the stations, we have decided to use a grid instead of choosing which locations would be better for carsharing. This was done in order not to influence the results with a priori knowledge on the city since the objective of this paper is methodological. All cells with no trip origins or destinations were eliminated from the original set. The thinner
Downloaded by [Gonçalo Homem de Almeida Correia] at 12:44 02 September 2013
the grid, the more accurate the results, but higher the space-time network and therefore there would be a greater computational effort. Due to these constraints, we chose a cell size of 800 m, resulting in 116 potential locations for implementing carsharing stations (Figure 2).
(Figure 2)
The matrix of trip distances and the matrix of trip times also had to be computed. The driving distances were measured between the different stations using a shortest path algorithm and following the road network using a geographic information system (GIS) with a transportation module (GeoMedia Professional). With regard to the matrix of trip times, the time was divided into 10 minute intervals. Taking an operation period between 6:00 am and midnight, the total number of time steps in the model is 108. The time that the users spend walking from their origin to the station and also the time that they take from the destination station to their actual destination were also measured in GIS using the shortest path algorithm. The in-vehicle times were calculated using a road assignment procedure available through the transportation demand analysis software VISUM (PTV). This takes congestion effects into account, which is not possible with the general GIS tool. With respect to the driving travel times it is important to say that the day was divided into three
18
ACCEPTED MANUSCRIPT
ACCEPTED MANUSCRIPT different analysis periods: a period without congestion; the morning peak period (between 8:00am and 10:00am); and the afternoon peak period (between 6:00pm and 8:00pm) in order to improve the realism of trip times. Furthermore, realistic values for the different parameters of the model had to be chosen: the
Downloaded by [Gonçalo Homem de Almeida Correia] at 12:44 02 September 2013
money that users have to pay to use the service, parking costs, vehicle operating costs and vehicle ownership costs. The prices were based on the ones charged by Car2Go. In that system the users had to pay €0.19 per minute of use (value charged in 2011). Thus the users pay €1.90 for each 10 minute step. This sum was rounded up to €2.00 in our study ( Lc ). The parking charges paid by the company were assumed to be the same in all locations and to be €5 per day ( Cm ), which is the lowest parking fee payable in Lisbon. We considered the following station sizes: p 1, 3, 5,15,35 , the maximum value, 35, was chosen after running the model constraining it to accept all trips in the matrix instance for Lisbon. The vehicle operating costs and the ownership costs were computed using an online tool developed by a German company, iNTERFILE (2002). We considered these costs to be €0.07 per km ( Cv ) and €17.35 per day ( Cv ), respectively.
RESULTS
In this section we present the main results obtained by running the three different scenarios: no flexibility (1), flexibility without information (2) and flexibility with information on vehicle stocks (3) for the Lisbon municipality case study (Table 1).
19
ACCEPTED MANUSCRIPT
ACCEPTED MANUSCRIPT
(Table 1)
The most important result that stands out is the total daily profit from operating the one-way
Downloaded by [Gonçalo Homem de Almeida Correia] at 12:44 02 September 2013
carsharing system; this is what measures the quality of the solutions obtained through the three scenarios. We see that the scenario that leads to the highest profit is the one where there are flexible users with information, thus demonstrating the importance of information for the viability of this system. The scenario where users are inflexible (only the closest station is used) yields only 20% of the profit obtained in the scenario where users are willing to use another station and have information on the available vehicles. We see that information is not linked to greater vehicle use, this actually decreases when compared to users just being flexible (7 h/veh against 7.4 h/veh), the average trip time also decreases (14.2 min against 18.1 min), what increases is the number of satisfied trips because clients can go directly to a station with a vehicle available. We may also observe that the daily profit per vehicle and daily profit per station increase from scenario 1 to scenario 3. Hence there is higher efficiency in managing the system with real-time information. Table 1 also shows the importance of users being flexible even if there is no information (scenario 2) since it significantly increases the profit from running the one-way carsharing system. This happens despite the growth in the number of vehicles and the number of stations needed to run the system in an optimal way, because these factors are outweighed by rejecting fewer trips.
20
ACCEPTED MANUSCRIPT
ACCEPTED MANUSCRIPT When users are flexible and have no information, the time that they spend walking per trip increases on average in relation to the scenario with information (12.8 min and 8 min respectively). This result is in agreement with what was expected, since when users have no information about vehicle availability at the stations they cannot go directly to the station that
Downloaded by [Gonçalo Homem de Almeida Correia] at 12:44 02 September 2013
has a vehicle available, and this adds to system inefficiency. This is accompanied by a higher unproductive vehicle usage when users have no information, because, at the destination, some travelers will have to keep on driving to find a station with spare capacity. It is also noteworthy that the percentages of satisfied trips using the second and the third closest station for picking and dropping off the vehicle were very significant. For picking up a vehicle the greater percentage of trips uses the second station when there is no information (48.3%) and the third station when information is added (37.3%). Hence, profit results seem to be clearly linked to users’ flexibility and information. In what respects to the number of stations and dimension in the three scenarios it is interesting to see that they never have more than three parking spaces and that the great majority only have one, this result is very much in line with the current supply in round trip carsharing, for instance the company Zipcar in Boston. With flexible users and information it is better to have more small stations scattered around the city to satisfy more trips and reach a higher profit.
CONCLUSIONS
The work presented in this paper extends a previous one by Correia and Antunes (2012), who proposed a mathematical programming model for locating stations and selecting trips in one-way
21
ACCEPTED MANUSCRIPT
ACCEPTED MANUSCRIPT carsharing systems. In that model the authors used a MIP formulation which assumed that the location of stations was a factor that could influence the profit of running one-way carsharing systems, which usually have a great vehicle imbalance during the day. But it also considered that people are not flexible and would only pick-up and drop-off a vehicle at the station nearest to
Downloaded by [Gonçalo Homem de Almeida Correia] at 12:44 02 September 2013
their desired origin and destination. This last hypothesis is a common practice in other previous models for carsharing (e.g., Kek et al., 2009) and also for bikesharing (e.g., Lin & Yang, 2011). The earlier model by Correia and Antunes 2012) has been further developed in this paper to consider more options for the client to pick-up and drop-off vehicles. By introducing this flexibility we were able to test the scenario where the user knows a priori the vehicle stocks through the web and may go directly to the second or third closest station that has a vehicle available without attempting one with no stock available. The model was applied to an Origin-Destination matrix from the city of Lisbon. It was possible to conclude that the users’ flexibility in picking up and dropping off a vehicle has a strong impact on the profitability of the system meaning that models that consider just one option to access this type of transport maybe underestimating the system’s potential. This is significant for the models being built to plan carsharing systems but it could also be important for the growing body of literature addressing bikesharing systems’ planning. Moreover we have shown that the users’ profile in terms of flexibility levels is essential for the viability of carsharing systems. Nonetheless, despite the possibility of running targeted campaigns we must stress that flexibility is not a feature of carsharing systems thus the operator has limited options to influence this behavior.
22
ACCEPTED MANUSCRIPT
ACCEPTED MANUSCRIPT We have also concluded that having flexible users with or without information can be linked to system redundancy: having more small stations near the trip origin may allow leveraging this flexibility to generate a clear benefit for the one-way carsharing operators, possibly indicating that big carsharing companies will be fare better than small ventures. Generalization of this result
Downloaded by [Gonçalo Homem de Almeida Correia] at 12:44 02 September 2013
depends on the number of trips of each specific city so the concept of “small” must always be drawn from comparing scenarios for the same city and not different cities for the same scenario. Although there are limited possibilities of influencing flexibility: when this is present in the users’ characteristics and information on vehicle stocks is added, we have concluded that it has a considerable impact on profit maximization. A significant benefit derives from providing and maintaining a real time information system, which is now part of the world’s leading carsharing companies. This adds to the evidence of the importance of information systems in improving the travelers’ experience but also on its importance for the operators in better managing their transportation systems. The efficiency levels of the solution obtained from applying the model with flexibility and information were the highest. Because a demand model was not available we have not considered that users’ flexibility may be fostered by information: going to a station further away without knowing if there is a vehicle available may be less attractive than the case where the user has information on stocks, which means that many more flexible persons may appear as a result of their using the information services. Thus the difference between the profits of the two scenarios reached with the Lisbon Origin-Destination matrix may well be a lower bound for the economic value of information in a one-way station-based carsharing system.
23
ACCEPTED MANUSCRIPT
ACCEPTED MANUSCRIPT As a summary conclusion we can say from our results that highly dynamic transportation systems such as carsharing, where supply conditions change as a direct result of the demand patterns, can improve their level of service and economic results by providing accurate real-time information on their current supply. We have not discussed in this paper the impact that
Downloaded by [Gonçalo Homem de Almeida Correia] at 12:44 02 September 2013
information could have on bringing more users to this transportation system by providing better access time or by improving their experience in using this transport mode, as most of the literature has done for classical transport systems. This may also be important for shared systems, but should be studied by surveying travelers. What our research can bring to light is that when users are flexible real time information may be a key aspect on improving the performance of public transportation. We may transpose the flexibility of carsharing to a classical bus system where real time information may allow balancing passenger loads by providing them alternatives in other routes for their destination. In this regard there are also significant similarities to what has been concluded concerning the value of real-time information as a factor to reach equilibrium on traffic flows in a road network. ACKNOWLEDGMENTS The research upon which this article is based was carried out under the SCUSSE project (Smart Combination of passenger transport modes and services in Urban areas for maximum System Sustainability and Efficiency), within the MIT Portugal Program. Thanks go also to Intergraph Corporation for the use of Geomedia Professional 6.1 (GIS software), to PTV for the use of VISUM (transportation demand modeling software), to FICO for the use of Xpress (optimization software), and to TIS.pt for the use of their Lisbon mobility survey. We would also like to thank two anonymous reviewers for their suggestions on how to improve this article.
24
ACCEPTED MANUSCRIPT
ACCEPTED MANUSCRIPT
REFERENCES
Abdel-Aty, M. A., Jovanis P., Kitamura R. (1996). The Impact of Advanced Transit Information on
Downloaded by [Gonçalo Homem de Almeida Correia] at 12:44 02 September 2013
Commuters Mode Changing. Journal of Intelligent Transportation Systems, 3(2), 129-146. Barth, M., & Shaheen, S. A. (2002). Shared-Use Vehicle Systems - Framework for Classifying Carsharing, Station Cars, and Combined Approaches. Transportation Research Record: Journal of the Transportation Research Board, 1791, 105-112. Barth, M., Shaheen, S. A., Fukuda, T., & Fukuda, A. (2006). Carsharing and station cars in Asia Overview of Japan and Singapore. Transportation Research Record: Journal of the Transportation Research Board, 1986, 106-115. Burkhardt, J. E., & Millard-Ball, A. (2006). Who Is Attracted to Carsharing? Transportation Research Record: Journal of the Transportation Research Board, 1986, 98-105. Caicedo, F. (2010). Real-time parking information management to reduce search time, vehicle displacement and emissions. Transportation Research Part D: Transport and Environment, 15, 228-234. Car2Go. 2012. "Welcome to Car2Go." Retrieved April 2012, from http://www.car2go.com/. Celsor, C., & Millard-Ball, A. (2007). Where does carsharing work? Using geographic information systems to assess market potential. Transportation Research Record: Journal of the Transportation Research Board, 1992, 61-69. Cervero, R. (2003) City CarShare: First-Year Travel Demand Impacts. Transportation Research Record: Journal of the Transportation Research Board, 1839, 159-166.
25
ACCEPTED MANUSCRIPT
ACCEPTED MANUSCRIPT Ciari, F., Scheussler, N., & Axhausen, K. W. (2012). Estimation of Car-Sharing Demand Using an Activity-Based Microsimulation Approach: Model Discussion and Preliminary Results. Journal of Sustainable Transportation, in press. Correia, G., & Antunes, A. P. (2012). Optimization approach to station location and trip selection in one-
Downloaded by [Gonçalo Homem de Almeida Correia] at 12:44 02 September 2013
way carsharing systems. Transportation Research Part E: Logistics and Transportation Review, 48(1), 233-247. Chorus, C. G., Molin, E. J. E., & Wee, B. V. (2006). Travel Information as an instrument to change cardrivers' travel choices: a literature review. European Journal of Transport and Infrastructure Research, 6(4), 335-364. Chorus C., Walker J., Ben-Akiva M. (2010). The Value of Travel Information: A Search-Theoretic Approach. Journal of Intelligent Transportation Systems, 14 (3), 154-165. Emmerink, R. H. M., Axhausen, K. W., Nijkamp, P., & Rietveld, P. (1995). Effects of information in road transport networks with recurrent congestion. Transportation, 22, 21-53. Enoch, M. P., & Taylor, J. (2006). A worldwide review of support mechanisms for car clubs. Transport Policy, 13(5), 434-443. Fan, W., Machemehl, R. B., & Lownes, N. E. (2008). Carsharing Dynamic Decision-Making Problem for Vehicle Allocation. Transportation Research Record: Journal of the Transportation Research Board, 2063, 97-104. Golob, T.F. & Regan, A.C. (2001). Impacts of information technology on personal travel and commercial vehicle operations: Research challenges and opportunities. Transportation Research - Part C: Emerging Technologies, 9, 87-121. Grotenhuis, J.-W., Wiegmans, B. W. & Rietveld, P. (2007) The desired quality of integrated multimodal travel information in public transport: Customer needs for time and effort savings. Transport Policy, 14(1), 27-38.
26
ACCEPTED MANUSCRIPT
ACCEPTED MANUSCRIPT Hampshire, R. C., & Gaites, C. (2011, January). Peer-to-Peer Car Sharing: Market Analysis and Potential Growth. Transportation Research Record: Journal of the Transportation Research Board, 2217, 119-126. Haefeli, U., Matti, D., Bisang, K., & Hartl, R. (2006). Evaluation Car-Sharing. Bern: Eidgenössisches
Downloaded by [Gonçalo Homem de Almeida Correia] at 12:44 02 September 2013
Departement für Umwelt, Verkehr, Energie und Kommunikation UVEK. iNTERFILE (2002) Retrieved May 2010, from: http://www.excel.interfile.de/Autokostenrechner/autokostenrechner.html Kek, A. G. H., Cheu, R. L., Meng, Q., & Fung, C. H. (2009). A decision support system for vehicle relocation operations in carsharing systems. Transportation Research Part E-Logistics and Transportation Review, 45(1), 149-158. Kenyon, S., & Lyons, G. (2003). The value of integrated multimodal traveller information and its potential contribution to modal change. Transportation Research Part F: Traffic Psychology and Behaviour, 6, 1-21. Khattak, A., & Polak, J. (1993). Effect of parking information on travelers' knowledge and behavior. Transportation, 20, 373-393. Lane, C. (2005). PhillyCarShare - First-year social and mobility impacts of carsharing in Philadelphia, Pennsylvania. Transportation Research Record: Journal of the Transportation Research Board, 1927, 158-166. Lin, J.-R. and T.-H. Yang. Strategic design of public bicycle sharing systems with service level constraints. Transportation Research Part E: Logistics and Transportation Review, 47 (2), 284294. Litman, T. (2000). Evaluating carsharing benefits. Sustainability and Environmental Concerns in Transportation, 1702, 31-35.
27
ACCEPTED MANUSCRIPT
ACCEPTED MANUSCRIPT Martin, E., Shaheen, S. A., & Lidicker, J. (2010). Impact of Carsharing on Household Vehicle Holdings Results from North American Shared-Use Vehicle Survey. Transportation Research Record: Journal of the Transportation Research Board, 2143, 50-158. Oliveira, V., & Pinho, P. (2010). Lisboa. Cities, 27, 405-419.
Downloaded by [Gonçalo Homem de Almeida Correia] at 12:44 02 September 2013
Schuster, T. D., Byrne, J., Corbett, J., & Schreuder, Y. (2005). Assessing the potential extent of carsharing - A new method and its implications. Transportation Research Record: Journal of the Transportation Research Board, 1927, 174-181. Sayarshad, H., Tavassoli S. & Zhao F. (2012). A multi-periodic optimization formulation for bike planning and bike utilization. Applied Mathematical Modelling, in press. Shaheen, S. A. & Cohen, A. P. (2007). Growth in worldwide carsharing - An international comparison, Transportation Research Record: Journal of the Transportation Research Board, 1992, 81-89. Shaheen, S. A., Cohen, A. P., & Roberts, J. D. (2006). Carsharing in North America - Market growth, current developments, and future potential. Transportation Research Record: Journal of the Transportation Research Board, 1986, 116-124. Shaheen, S. A., Guzman, S. & Zhang, H. (2010). Bikesharing in Europe, the Americas, and Asia. Transportation Research Record: Journal of the Transportation Research Board, 2143, 159-167. Shaheen, S. A., Mallery, M. A., & Kingsley, K. J. (2012). Personal vehicle sharing services in North America. Research in Transportation Business & Management, 3(0), 71-81. doi: 10.1016/j.rtbm.2012.04.005. Shaheen, S. A., Sperling, D., & Wagner, C. (1999). Carsharing and Partnership Management An International Perspective. Transportation Research Record: Journal of the Transportation Research Board, 1666, 118-124.
28
ACCEPTED MANUSCRIPT
ACCEPTED MANUSCRIPT Sioui, L., Morency, C., & Trépanier, M. (2012) How Carsharing Affects the Travel Behavior of Households: A Case Study of Montréal, Canada. International Journal of Sustainable Transportation, in press. Tang, L., & Thakuriah, P. (2012). Ridership effects of real-time bus information system: A case study in
Downloaded by [Gonçalo Homem de Almeida Correia] at 12:44 02 September 2013
the City of Chicago. Transportation Research Part C: Emerging Technologies, 22, 146-161. Tseng, Y.-Y., Knockaert, J., & Verhoef, E. T. (2011). A revealed-preference study of behavioural impacts of real-time traffic information. Transportation Research Part C: Emerging Technologies, in Press. The 2010 Urban Mobility Report (2010) Texas Transport Institute. December 2010. The Straits Times (2008) Innovative Carsharing Program in Singapore Ends. Sunday, March 9, 2008. Toledo, T., & Beinhaker, R. (2006). Evaluation of the Potential Benefits of Advanced Traveler Information Systems. Journal of Intelligent Transportation Systems, 10, 173-183. Watkins, K. E., Ferris, B., Borning, A., Rutherford, G. S., & Layton, D. (2011). Where Is My Bus? Impact of mobile real-time information on the perceived and actual wait time of transit riders. Transportation Research Part A: Policy and Practice, 45, 839-848.
29
ACCEPTED MANUSCRIPT
Downloaded by [Gonçalo Homem de Almeida Correia] at 12:44 02 September 2013
ACCEPTED MANUSCRIPT Tables Table 1 Results obtained for each scenario for one business day Flexibility No Flexibility without (1) Information (2) 428.7 1732.8 Total Daily Profit (€) Operational vehicle 1413.9 3033.2 income (€) Profit 485 Components Station expenses (€) 430 Automobile expenses 555.2 815.5 (€) Satisfied Demand (trips) 590 (33%) 1155 (65%) Vehicles 32 47 Total distance (km) 2573 5211 Total use time (h) 132.8 347.8 Daily profit per vehicle (€/veh) 13.4 36.9 Station used Closest to origin 100% 45.5% for entry (% Second closest 48.3% of satisfied trips) Third closest 6.2% Station used Closest to destination 100% 50.0% for Exit (% Second closest 37.3% of satisfied Third closest 12.7% trips)
Station Size
Flexibility with Information (3) 2380.9 3748.4 500 867.5 1477 (83%) 50 6309 349.2 47.6 31.3% 31.4% 37.3% 31.2% 33.6% 35.3%
1 space
56
70
82
3 spaces 5 spaces 15 spaces 35 spaces
10 0 0 0 66 (out of 116) 6.5 80.4 4.15 23% 13.5
9 0 0 0
6 0 0 0
79(out of 116)
88(out of 116)
21.9 110.9 7.4 41% 18.1
27.1 126.2 7 39% 14.2
-
12.8
8
-
3.4
-
Total number of stations created Daily profit per station (€/sta) Average distance per vehicle (km) Average time of use per vehicle (h) Average daily % of vehicle use Average trip time (min) Extra walking time per satisfied trip (min) Extra vehicle time per satisfied trip (min) (not charged to the client)
30
ACCEPTED MANUSCRIPT
ACCEPTED MANUSCRIPT Figures depot 6 depot 3 Origin (eg. Home) depot 4
Downloaded by [Gonçalo Homem de Almeida Correia] at 12:44 02 September 2013
depot 2
depot 5 depot 1 Destination (eg. Office)
Walking Driving
a) Inflexible users
depot 3 (veh available)
depot 6
Origin (eg. Home)
depot 5 (available space)
depot 2 (0 veh)
depot 4 (no Space)
depot 1 (0 veh)
Destination (eg. Office)
Walking Driving
b) Flexible users
31
ACCEPTED MANUSCRIPT
ACCEPTED MANUSCRIPT depot 3 (veh available)
depot 6
Origin (eg. Home)
depot 5 (available space)
depot 2 (0 veh)
depot 4 (no Space)
Downloaded by [Gonçalo Homem de Almeida Correia] at 12:44 02 September 2013
depot 1 (0 veh)
Destination (eg. Office)
Walking Driving
c) Flexible users who have information on vehicle stocks
Figure 1
Figure 2
32
ACCEPTED MANUSCRIPT
ACCEPTED MANUSCRIPT
Downloaded by [Gonçalo Homem de Almeida Correia] at 12:44 02 September 2013
Figure Captions:
Figure 1 - The three scenarios Figure 2 - Grid of potential station locations (800 m grid cell side)
33
ACCEPTED MANUSCRIPT