740
Int. J. Services and Operations Management, Vol. 5, No. 6, 2009
The artificial neural network for forecasting foreign exchange rates Ahmed Emam Department of Computer Sciences Western Kentucky University Bowling Green, Kentucky, USA Fax: 270–745–6449 E-mail:
[email protected]
Hokey Min* BAA 3008C Department of Management College of Business Administration Bowling Green State University Bowling Green, Ohio 43403, USA Fax: 419–372–6057 E-mail:
[email protected] *Corresponding author Abstract: A foreign exchange market is one of the highly invested markets in the world with an average daily trade volume of $1.8 trillion. Due to extreme volatility and uncertainty associated with foreign currency fluctuations, the prediction of a foreign exchange rate has been one of the most challenging and onerous tasks for both researchers and practitioners. Traditionally, a foreign exchange forecast has been predicated on some technical indicators that simply tracked past pricing trends without considering a host of other factors (e.g., changes in government policy, trade imbalances, inflation). However, if the currency market is influenced by a random event (i.e., if the market did not follow the trend pattern), these indicators will lead to misleading forecasts. That is to say, traditional forecasting techniques such as a linear trend analysis would not work well for predicting future foreign exchange fluctuations. To overcome this shortcoming of the traditional forecasting techniques, we propose an Artificial Neural Network (ANN) that has proven to be useful for forecasting volatile financial time series such as foreign exchange rates. After applying ANN to the actual data, we discovered that the proposed ANN turned out to be very effective in predicting the daily fluctuations of foreign exchange rates. Similarly, its experiments showed favourable results for weekly forecasts, although it did not perform as well as we anticipated for monthly forecasts. Keywords: foreign exchange; artificial neural networks; ANN; global supply chain management. Reference to this paper should be made as follows: Emam, A. and Min, H. (2009) ‘The artificial neural network for forecasting foreign exchange rates’, Int. J. Services and Operations Management, Vol. 5, No. 6, pp.740–757.
Copyright © 2009 Inderscience Enterprises Ltd.
The artificial neural network for forecasting foreign exchange rates
741
Biographical notes: Ahmed Emam is an Assistant Professor of Computer Science at the Western Kentucky University, USA. He received his PhD degree in Computer Science and Engineering from the University of Louisville. His primary research interests are data mining, artificial intelligence and database management. His research articles were published in the International Journal of Physical Distribution and Logistics Management, the Egyptian Computer Journal and Organizational Data Mining. Hokey Min is the James R. Good Chair in Global Supply Chain Strategy in the Department of Management at the Bowling Green State University, USA. He was a distinguished university scholar and Founding Director of the UPS Center for World-wide Supply Chain Management and the Center for Supply Chain Workforce Development at the University of Louisville. He earned his PhD degree in Management Sciences and Logistics from the Ohio State University. His research interests include global logistics strategy, healthcare supply chains, benchmarking and supply chain modelling. He has published more than 115 articles in various refereed journals including the European Journal of Operational Research, the Journal of Business Logistics, the Journal of the Operational Research Society, the International Journal of Physical Distribution and Logistics Management, Transportation Journal and Transportation Research.
1
Introduction
Forecasting the foreign exchange rate has been one of the most important tasks for supply chain managers, because the foreign exchange rate has a profound impact on the import/export price of traded goods, global logistics services, and the subsequent profit margin and competitiveness of those goods in the global marketplace. Though important, a forecast of the foreign exchange rate has not been easy due to the volatile and uncertain nature of the foreign exchange market. Traditionally, such a forecast has been made by classical forecasting techniques such as liner trend analysis, weighted moving average, and auto-regression analysis under the premise that past historical patterns would be linearly correlated to future market behaviour and there always exists ‘homoskedasticity’ (no random event). Unfortunately, classical forecasting techniques require too much historical data and fail to capture unexpected random events (e.g., 9/11 type of events, war, natural disasters, sudden policy change, supply chain disruptions); thus, they tend to produce inaccurate forecasts. To overcome such a shortcoming of traditional forecasting techniques, a growing number of researchers have proposed Artificial Intelligence (AI) techniques including the Artificial Neural Network (ANN) (see, e.g., Adya and Collopy, 1998). A prior use of ANN for predicting foreign exchange rates seems to be promising. For instance, Weigend et al. (1992) demonstrated that their ANN model was better at predicting the Deutsche mark/US dollar exchange rate than a random walk model. Similarly, Wu (1995), Hann and Steurer (1996), Zhang and Hu (1998), Yao and Tan (2000), and Shin and Sohn (2007) showed that the ANN models performed better than traditional forecasts such as ARIMA models. Part of these reported successes of ANN may be due to its distinguished features (see, e.g., Zhang et al., 1998 for successful applications ANN to forecasting):
742
A. Emam and H. Min
•
ANN is designed to deal with the non-linear structure of time-series and thus has a capability to identify complex financial relationships and patterns.
•
ANN is data driven and thus does not need restrictive assumptions on the historical data generation process.
In addition, we should be aware that the FOReign EXchange market (FOREX) is often characterised as its nonlinear and non-stationary (or random walk) patterns. As such, it was generally known that FOREX is difficult to predict. Furthermore, some believed that a Markov model was suitable for analysing financial time series such as foreign exchange rates, since it captures a stochastic process under the premise that a probability of the transition from one state to another state depends only on the current state and thus a prediction of future exchange rates requires only the current data and not the past data regarding foreign exchange rates. Considering the aforementioned facts, this paper aims to propose an ANN model and then evaluate its effectiveness in predicting financial time series data such as FOREX. To elaborate, the primary of objective of this paper is to implement and develop an ANN model that is capable of simulating a real foreign currency market. Its another objective is to evaluate the performance of the proposed ANN as compared to other forecasting techniques (especially traditional forecasts) with respect to the forecasting accuracy through a series of experiments with the FOREX market data.
2
Prior literature
Although the foreign exchange forecasts have not drawn much attention from academicians, some pioneering attempts have been made to forecast the stock price index and FOREX rates. In the FOREX market, a trend which identifies a direction of the market can be up and down for hours, days, weeks, or years. In other words, the trend encompasses a short-term, an intermediate-term, and a long-term pattern. The long term trend expected to last for several months or a year, the intermediate trend may last for three to four months or less, the short term trend may last for hours but no more than one or two days. Regardless of time horizons, most traditional forecasts were designed to average out these trends. For example, Yao and Tan (2000) presented a moving average method for predicting some currency exchanges over a period of time and combined it with a neural network. A moving average method is designed to identify the trend by smoothing its noise. This method created input data and a potential yardstick for ANN. In particular, they used daily averages and then predicted the future rate one day ahead of time. The ANN employed by Yao and Tan (2000) forecasted a composite index of stock exchange by building an ANN forecasting model with the seven year input data that were generated by the moving average method. Based on a series of experiments and tests, they found that their combined use of a moving average method and ANN has proven to be useful for predicting stock prices with negligible forecasting errors. As illustrated by Yao and Tan (2000), the combined use of several different forecasting techniques to improve forecasting accuracy has been a popular practice. The effectiveness of such hybrid forecasting techniques, however, relies heavily on the assumption that the true underlying structure of data is difficult or impossible to analyse
The artificial neural network for forecasting foreign exchange rates
743
by one technique and different techniques may play a complementary role in capturing different patterns in the data. Makridakis et al. (1982) once demonstrated that the combined use of more than one forecasting techniques often leads to improved forecasting performances based on their testing of more than 1000 actual time series data. Most of these hybrid forecasting techniques, however, are predicated on the linear model combinations. Recently, several attempts have been made to use multiple neural networks or to integrate neural networks with traditional forecasting techniques. For example, Ginzburg and Horn (1994) showed encouraging forecasting results with multiple neural network models. Wedding and Cios (1996) also presented a similar result by utilising a hybrid version of Radial Basis Function (RBF) networks and ARMA models. Luxhoj et al. (1996) combined ANN with econometric models to better forecast future sales. Khotanzad et al. (2000) proposed a two-stage forecasting procedure based on multiple neural networks to predict the consumption rates of natural gas.
3
FOREX background
The FOREX is an international foreign exchange market, where money is sold and bought freely and was launched in the 1970s. The word FOREX is derived from Foreign Exchange and is the largest financial market in the world that deals with approximately $1.8 trillion transactions every day. There is no single centralised medium for the trade of foreign currencies. Traders buy and sell FOREX via telephones and computer networks linked to brokers, banks and other traders around the world. Currency is traded in pairs and each currency has assigned a symbol. For example, the Japanese Yen is abbreviated as JPY, the Pound Sterling is symbolised as GBP, Euro is denoted as EUR, and the Swiss Frank is denoted as CHF. There are four terminologies related to the currency market: ‘high and low’ indicate the highest traded price and the lowest traded price, respectively; ‘open and close’ indicate the opening and closing price recorded during the official exchange period. A rise in the rate between a currency pair (EUR/USD) means that the first named currency has strengthened against the second named currency. This is why, when someone is selling a foreign currency, he is selling the first-named currency and then buying the second-named currency. The FOREX market introduced some professional jargons such as Spread (currency quote received from a dealer), Lot size (the size of the currency unit to be traded and each lot is worth 100 000 units of the base currency), and Pips (the smallest unit in which a currency price is normally quoted or the last decimal place of a currency). The forecast of the FOREX market trend is often based on two types of data analyses: fundamental and technical. A fundamental analysis is built upon the identification of key economic factors and their degree of impact on foreign exchange rates, whereas a technical analysis is based on the past pricing patterns of foreign currencies.1 The technical analysis uses technical indicators such as Moving Averages (e.g., moving averages of data during 10, 20, 50, 100 and 200 periods on a daily chart), Slow Stochastic (e.g., a 14-day-period stochastic oscillator), Momentum (e.g., an oscillator that measures changes in the exchange rate during the observation period), Moving Average Convergence Divergence (MACD), and Rate of Change (ROC).
744
4
A. Emam and H. Min
ANN model design
In general, a time series is defined as a sequence of data points, measured typically at successive times, spaced at (often uniform) time intervals. Time series methods typically use more than two sets of past historical data to predict future events based on known past patterns. Examples of their applications include a prediction of opening stock prices, product sales volume, and inventory levels. Time series models can take a variety of forms such as Autoregressive (AR) models, Integrated (I) models, and Moving Average (MA) models. Regardless of their forms, time series models often presume a linear relationship between historical data and future events.2 To elaborate, historical data, often referred to as a ‘time series’, is spaced equally over time. Time series models assume that a time series is a combination of past patterns and some random errors. Thus, their main goal is to separate the pattern from the error by understanding the pattern’s trends, long-term increases or decreases, seasonality, and abrupt changes caused by supply and demand imbalances. There are many different ways to analyse time series data. These include: the use of the autocorrelation and the spectral density function, a Fourier transformation to investigate the time series in a frequency domain, filtering to remove unwanted noise, the use of a principal components analysis (or empirical orthogonal function analysis), and the development of ANN. Among these, ANN is known to be robust in approximating real-valued, discrete-valued and vector-valued target functions. In other words, ANN can detect nonlinearity among data patterns using the universal function approximates. Due to such a unique feature of ANN that is not available from traditional forecasting techniques, ANN has emerged as one of the most popular forecasting tools for predicting complex business phenomena (Maasoumi, 2002). On the other hand, ANN requires lengthy data training and its efficiency relies heavily on model architectures and parameters. As such, ANN can pose numerous challenges for predicting the FOREX market due to a multitude of factors (e.g., political changes, interest rate fluctuations) influencing the foreign exchange rate. For example, sudden political upheavals in the developing countries can change currency prices dramatically overnight and thus requires quick reactions to these changes. However, ANN may take a while to capture abrupt changes due to extensive data training time.
4.1 Data collection and preprocessing There are many ANN commercial packages available in the market that can help predict the FOREX market. The most well-known and widely used ANN commercial packages for predicting the FOREX are Trading Solutions,3 Neuro-Shell Trader4 Neural FX Forecasts,5 and Neuro Dimension.6 These packages relies on past financial dataset to forecast the FOREX currency markets with a high return, but none of them uses the function approximation feature of ANN. As such, rather than using these commercial software, we decided to develop our own dataset and algorithm. Historical data available from the public websites created by FOREX7 are downloaded using search words such as ‘high, low, close, and open volume’ with a combination of daily, weekly, and monthly data. Before data are fed into the ANN model, the data has to be smoothed to eliminate a noise and to be scaled in the boundaries of the activation function. To do so, all values are normalised with a mean computed using the equation:
The artificial neural network for forecasting foreign exchange rates y=
x − mean
σ
745
,
where σ is the standard deviation, and x represents the input data. Another preprocessing activity was performed to remove the noise from data and then facilitate the learning by an example process of ANN. This activity is often called ‘de-trending.’ To elaborate, de-trending was accomplished by calculating a difference between two sequences of a trend. For example, a formula for calculating the daily moving average is mathematically expressed as: y = xt – xt–1, where xt is the current period (today) and xt–1 is the previous period (tomorrow). The last step in the preprocessing stage is a logarithmic transformation of the dataset in such a way that those dataset can keep the consistency and stability between small and large data values.
4.2 Performance of the ANN forecasting system Evaluation of the ANN forecasting performance is necessary for future modifications or updates. Such evaluation involves measuring the difference between the forecasted value of the ANN and the target value. In this paper, the Mean Square Error (MSE) as defined by http://www.easy-forex.com/en/Forex.FinancialCalendar.aspx was used as the key measure of the ANN forecasting accuracy. Typically, the ANN performance can be measured by calculating the correlation coefficient (CORR) between the ANN forecasted value and the inverse of its MSE. This correlation coefficient ranges from 0 to 1. The higher the correlation coefficient, the better the ANN forecasting performance is, as specified by http://www.easy-forex.com/en/Forex.FinancialCalendar.aspx. Also, a profit yielded by the buy and sell activities involving the foreign currency can be used as another performance measure. This profit measure reflects either the effectiveness of the ‘up-move’ strategy that aims to buy and hold the foreign currency until the profit is yielded, or the ‘down-move’ strategy that aims to sell the foreign currency until no more loss will occur. The profit can be measured in relation to the number of trading days as follows: profit = (moneyobtained / seedmoney)365/D – 1, where D is the number of the trading days during the test period. Another metric often used to measure the ANN forecasting performance is an average pipe deviation, which shows a discrepancy between the predicted value and the target value in pipes. Its measure can be expressed by the following equation: Average [Absolute (actual-predicted) × 10000] or Average [Absolute (actual-predicted) × 100]. In this equation, we can rescale this measure by multiplying its absolute difference by 10 000, if the foreign exchange rate has a four digit decimal point or by multiplying its absolute difference by 100, if the foreign exchange rate has a two digit decimal point.
746
5
A. Emam and H. Min
ANN experimental design and results
For experimental purposes, we considered four major foreign currencies aganist the US dollar: 1
Japanese Yen (USD/JPY)
2
British Pound (GBP/USD)
3
Euro (EUR/USD)
4
Swiss Franc (USD/CHF).
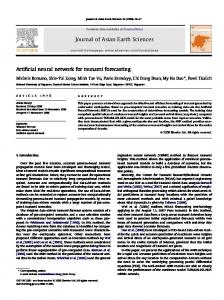
These currency data were downloaded from the FOREX Information Site (2008). The daily, weekly, and monthly data are downloaded along with categories of ‘open, high, low, and close’ data. These data are entered as prepared inputs into the ANN model that forecasts the closing value of the currency in the next day. A special Excel program has been developed to import the sample data called the Excel currency calculator. This program helped prepare the input data and clean them, while the technical indicators were calculated and normalised to make these input data suitable for the ANN model. The normalisation was intended to scale the data from 0 to 1. The entire ANN forecasting process is depicted in Figure 1. Figure 1
The ANN forecasting process diagram
Download Dataset in CSV format
Preprocess and clean the Dataset
Calculate the technical indictors as input for ANN and then normalise the input dataset.
Divide the dataset into training (0.66) and testing dataset (0.34)
Run the Matlab using the training dataset
Evaluate the training dataset and testing its accuracy using the MSE, Pipe, Deviation, and Profit
The process is repeated for every daily high and daily low price.
The artificial neural network for forecasting foreign exchange rates
747
Several experiments have been conducted to create the best topology, where the dataset is split by 2/3 for training and 1/3 for testing. Table 1 demonstrates the influence of the number of neurons on the MSE and the pipes deviation after training and testing. Table 1
The impact of the number of neurons on the forecast Training
Testing
Number of neurons
MSE
Pipes
2
3E-4
46
3E-4
47
4
3.1E-5
41
1.6E-5
39
6
2.9E-5
42
1.8E-5
43
12
1.7E-5
39
1.7E-5
85
MSE
Pipes
An increase in the number of hidden layers did not improve the test results. Since an increase in the number of hidden layers may lead to over-fitting, two hidden layers seems to be ideal for the ANN prediction model. Table 2 shows that neither training data nor testing data have been improved dramatically after increasing the number of hidden layers. Table 2
The impact of the number of hidden layers on the forecast Training
Testing
Number of hidden layers
MSE
Pipes
MSE
Pipes
2
30E-5
40
16E-5
42
3
29E-5
42
16E-5
42
4
31E-5
44
15E-5
41
5
27E-5
40
15E-5
42
It is also noted that the type and number of indicators used may impact the forecasting result, since the use of a few indicators will not give much information about the currency under investigation, whereas the use of too many indicators can generate too much noise on the ANN forecaster. Thus, we conducted a series of experiments until we could obtain the best results in term of minimum errors and minimal pipe differences between actual and forecasted values. Table 3 summarises the test results obtained from the use of two, four, five, six, and seven different indicators as inputs. From Table 3, it is apparent that the use of six indicators as inputs produced the best results after training and testing. The best topology is developed by using the Feed Forward Neural Networks (FFNN) and an error correction learning rule that is based on the Multilayer Perceptron (MLP) architecture as displayed in Figure 2. To obtain accurate forecasting results and to avoid over-fitting, we used as much data as possible. A total of 3200 sample data have been downloaded and were used for testing and training. Such data were split between 2/3 (with almost 2600 data points) and 1/3 (with almost 600 data points) for testing and simulations.
748 Table 3
A. Emam and H. Min The effects of the number of the inputs on the forecast Training
Inputs*
Testing
MSE
Pipes
MSE
Pipes
2
3.1E-5
43
1.5E-5
39
4
3.1E-5
43
1.5E-5
39
5
3E-4
44
1.5E-5
39
6
3E-4
39
1.3E-5
34
7
2E-5
45
1.1E-5
36
Notes:
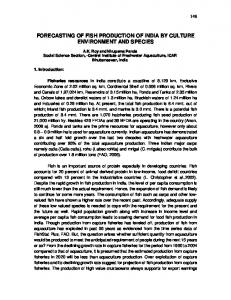
Figure 2
* Two inputs are (current high, MA50), 4 inputs are (current high, MA20, Ma50, Lag high), 5 inputs are (current high, MA10, MA20, Ma50, Lag high), 6 inputs are (current high, MA5, MA10, MA20, Ma50, Lag high), 7 inputs are (current high, MA5, MA10, MA20, Ma50, Lag high, RSI). The best forecasting ANN topology for daily predictions
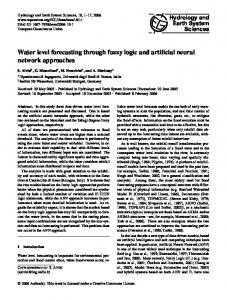
Figures 3 shows the forecasting results of USD/JPY, USD/CHF, EUR/USD, and EUR/USD currency pair on the daily closing rate for one month period. The test results with USD/JPY data indicate that the proposed ANN model learned well as evidenced by small MSE. The experiments with the GBP/USD data also show relatively accurate results, due in part to the steady trend pattern of the GBP currency. On the other hand, the experiments with the USD/CHF data show relatively inaccurate results, due in part to the erratic trend pattern of the CHF currency. The experiments with the EUR/USD data produced the most favourable results during both testing and training with respect to MSE and the average pipes deviation.
5.1 Weekly predictions To make a weekly prediction, a total of 470 data points have been downloaded and were used for testing and training. However, due to a few data samples, these data were split between 400 samples for training and 70 samples for testing and simulation. A
The artificial neural network for forecasting foreign exchange rates
749
cross-validation was made using additional samples extracted from both training and testing datasets. This cross-validation process ensures that data splitting neither increases nor decreases the training accuracy despite the use of the limited number of samples. The predicted patterns of the Daily USD/JPY, USD/CHF, GBP/USD, and UR/USD closing rates (see online version for colours)
USD/JPY daily prediction from 20/8/2006 to 20/9/2006 118.50 118.00 Close vlaues
117.50 117.00 Actual
116.50
Predicted
116.00 115.50 115.00 114.50 1 3 5 7 9 11 13 15 17 19 21 23 25 27 29 31 Days
USD/CHF Daily prediction 1.7200 1.7000 1.6800 lose values
Figure 3
1.6600 Predicted
1.6400
Actual
1.6200 1.6000 1.5800 1.5600 1 3 5 7 9 11 13 15 17 19 21 23 25 27 29 31 33 35 Days
The predicted patterns of the Daily USD/JPY, USD/CHF, GBP/USD, and UR/USD closing rates (see online version for colours) (continued)
Eur/USD Daily close prediction 1.3000 1.2900 close values
Figure 3
A. Emam and H. Min
1.2800 Predicted
1.2700
Actual
1.2600 1.2500 1.2400 1 3 5 7 9 11 13 15 17 19 21 23 25 27 29 31 Days
GBp/USD daily close high prediction 1.9500 1.9000 1.8500 Rates values
750
1.8000
Predicted close
1.7500
Actual close
1.7000
Predicted high
1.6500
Actual high
1.6000 1.5500 1.5000 1 3 5 7 9 11 13 15 17 19 21 23 25 27 29 31 33 Days
The artificial neural network for forecasting foreign exchange rates
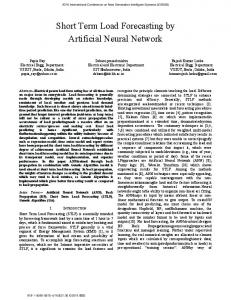
Weekly USD/JPY, USD/CHF, GBP/USD, and UR/USD high predictions (see online version for colours)
USD/JPY Weekly High prediction 137.50 137.00
high values
136.50 136.00 135.50 135.00
Predicted Actual
134.50 134.00 133.50 133.00 132.50 1 3 5 7 9 11 13 15 17 19 21 23 25 27 29 31 Days
USD/CHF Weekly High prediction 1.4000 1.3500 high values
Figure 4
751
1.3000 Predicted
1.2500
Actual
1.2000 1.1500 1.1000 1
4
7 10 13 16 19 22 25 28 31 34 37 40 Days
752 Figure 4
A. Emam and H. Min Weekly USD/JPY, USD/CHF, GBP/USD, and UR/USD high predictions (see online version for colours) (continued)
GBP/Usd Weekly High prediction 2.0000 1.9500 high values
1.9000 1.8500 Predicted
1.8000
Actual
1.7500 1.7000 1.6500 1.6000 1 3 5 7 9 11 13 15 17 19 21 23 25 27 29 31 33 35 Days
Eur/Usd Weekly High prediction 1.4000
high values
1.3500 1.3000 Predicted
1.2500
Actual
1.2000 1.1500 1.1000 1
4
7 10 13 16 19 22 25 28 31 34 37 40 Days
Figures 4 shows the results of USD/JPY, USD/CHF, EUR/USD, and EUR/USD currency pair on the weekly high close predictions. The experiments with the USD/JPY weekly close data show accurate results despite the use of a few samples available for training. On the other hand, the experiments with the USD/CHF data show accurate results in the close prediction, but did not produce accurate results on the high and the low predictions. The experiments with the GBP/USD data produced favourable results in
The artificial neural network for forecasting foreign exchange rates
753
the low prediction, but did not generate favourable results on the high and the close predictions. Finally, the experiments with the EUR/USD data produced favourable results only in the close prediction.
5.2 Monthly predictions The data available for monthly predictions were very small with 109 records, 70 for training, and 42 for testing as summarised in Table 4. Table 4
Monthly predictions during the training and testing periods
Currency pairs
Training samples
USD/JPY
70
From 1 September 1997 to 13 December 2003
42
From 28 November 2003 to 19 September 2006
USD/CHF
70
From 1 September 1997 to 13 December 2003
42
From 28 November 2003 to 19 September 2006
GBP/USD
70
From 1 September 1997 to 13 December 2003
42
From 28 November 2003 to 19 September 2006
EUR/USD
70
From 1 September 1997 to 13 December 2003
42
From 28 November 2003 to 19 September 2006
Training period
Testing samples
Testing period
Due to a limited number of samples, the ANN model did not seem to learn from the dataset and thus unable to demonstrate its learning capabilities. Instead, we found that it learned by example. In other words, the ANN model memorised all the data samples and produced zero errors, but it still failed to predict monthly patterns well during the test. Due to an insufficient amount of data for training, we could not draw any concrete conclusion on the effectiveness of the ANN model for monthly predictions of all the currencies. To systematically compare the forecasting results of the proposed ANN to those of a traditional forecasting technique such as a moving average method in term of profits, a help from an expert advisor (‘agent’) has to be sought. The expert advisor can buy or sell the currencies automatically based on the intersection of two moving averages of a long period equivalent to 60 series and a short period of one series. Figure 5 shows the comparative results of the moving average method and the ANN relying on the expert advisor. To elaborate, the EUR expert made a profit of US$6,000 from one slandered lot and thus earned a profit of 600% in one year, whereas the GBP expert amassed a loss of US$1,300 from one slandered lot and thus took a loss of 100% in one year. The CHF expert made a profit of US$500 from one slandered lot and thus suffered a loss of 50% in one year, whereas the JPY expert amassed a loss of US$500 from one slandered lot and thus took a loss of 50% in one year span.
754 Figure 5
A. Emam and H. Min EUR/USD, GBP/USD, USD/CHF, and USD/JPY expert advisor tester results (see online version for colours)
The artificial neural network for forecasting foreign exchange rates Figure 5
EUR/USD, GBP/USD, USD/CHF, and USD/JPY expert advisor tester results (see online version for colours) (continued)
755
756
6
A. Emam and H. Min
Conclusions and future research directions
Despite a great promise of the ANN model as an effective forecasting tool, its application for foreign exchange forecasts is always a daunting task. Part of difficulty stemmed from the fact that an ANN model can be built in many different ways and thus a proper selection of the ANN model requires careful planning during the model building and selection process. The ANN model is known to be data-extensive and data-driven. That is to say, ANN requires extensive databases and its forecasting accuracy may depend on the data characteristics (especially quality). In particular, our experiments indicate that the performance of the ANN model depends heavily on the quality of the input data as evidenced by contrasting forecasting results obtained from separate pairs of currency data sets. Nevertheless, this paper demonstrates that the ANN model can be exploited to produce accurate forecasting results without going through the complicated process of data preparation, input selection, variable definition, training algorithm design, and predefined model development for validation. The ANN model proposed in this paper was proven to be useful for predicting daily currency fluctuations, while its reliability for weekly forecasts varied from one currency to another. However, the proposed ANN model did not perform well for monthly forecasts due in part to the limited amount of sample data. Among the various ANN models, a feed forward neural network with the back propagation learning algorithm turned out to be most effective for predicting foreign exchange rates in a risky currency market with a lot of noises. Despite its numerous merits, it should be noted that ANN is far from being perfect since its effectiveness depends heavily on the art of data training and testing. So, its results should be interpreted with caution. Nevertheless, we strongly believe that the integration of a traditional forecasting technique with ANN may further improve the forecasting accuracy. For example, the ANN predictor may be used as a guide or a hint for forecasting foreign exchange rates, while the traditional forecasting technique may play a complementary role in capturing historical data patterns. Such an idea should be on the future research agenda.
References Adya, M. and Collopy, F. (1998) ‘How effective are neural networks at forecasting and prediction? A review and evaluation’, Journal of Forecasting, Vol. 17, pp.481–495. Forex Information Site (2008) http://www.webtrading.com/downloads/forexmanual.pdf (retrieved 30 April 2008). Ginzburg, I. and Horn, D. (1994) ‘Combined neural networks for time series analysis’, Advances in Neural Information Processing Systems, pp.224–231. Hann, T.H. and Steurer, E. (1996) ‘Much ado about nothing? Exchange rate forecasting: neural networks vs. linear models using monthly and weekly data’, Neurocomputing, Vol. 10, No. 4, pp.323–339. Khotanzad, A., Elragal, H. and Lu, T.L. (2000) ‘Combination of artificial neural-network forecasters for prediction of natural gas consumption’, IEEE Transactions on Neural Networks, Vol. 11, No. 2, pp.464–473. Luxhoj, J.T., Riis, J.O. and Stensballe, B. (1996) ‘A hybrid econometric–neural network modeling approach for sales forecasting’, International Journal of Production Economics, Vol. 43, Nos. 2–3, pp.175–192.
The artificial neural network for forecasting foreign exchange rates
757
Maasoumi, E. (2002) ‘Entropy and predictability of stock market returns’, Journal of Econometric, Vol. 107, Nos. 1–2, pp.280–330. Makridakis, S., Anderson, A., Carbone, R., Fildes, R., Hibdon, M., Lewandowski, R., Newton, J., Parzen, E. and Winkler, R. (1982) ‘The accuracy of extrapolation (time series) methods: results of a forecasting competition’, Journal of Forecasting, Vol. 1, pp.111–153. Shin, H.W. and Sohn, S.Y. (2007) ‘Application of an EWMA combining technique to the prediction of currency exchange rates’, IIE Transactions, Vol. 39, pp.639–644. Wedding, D.K. and Cios, K.J. (1996) ‘Time series forecasting by combining RBF networks, certainty factors, and the Box-Jenkins model’, Neurocomputing, Vol. 10, pp.149–168. Weigend, A.S., Huberman, B.A. and Rumelhart, D.E. (1992) ‘Generalization by weight-elimination with application to forecasting’, Advances in Neural Information Processing Systems, Vol. 3, pp.875–882. Wu, B. (1995) ‘Model-free forecasting for nonlinear time series with application to exchange rates’, Computational Statistics and Data Analysis, Vol. 19, pp.433–459. Yao, J. and Tan, C.L. (2000) ‘A case study on using neural networks to perform technical forecasting of forex’, Neurocomputing, Vol. 34, No. 1, pp.81–99. Zhang, G. and Hu, M.Y. (1998) ‘Neural network forecasting of the British Pound/US dollar exchange rate’, Omega, Vol. 26, No. 4, pp.495–506. Zhang, G., Patwuo, B.E. and Hu, M.Y. (1998) ‘Forecasting with artificial neural network: the state of art’, International Journal of Forecasting, Vol. 14, No. 1, pp.35–62.
Bibliography Kang, S. (1991) ‘An investigation of the use of feed forward neural network for forecasting’, Unpublished PhD dissertation, Kent, OH: Kent State University. Luxhoj, J.T. and Shyur, H. (2004) ‘Comparison of proportional hazards models and neural networks for reliability estimation’, Journal of Intelligent Manufacturing, Vol. 8, No. 3, pp.227–234. Meese, R. and Rogoff, K. (1983) ‘Empirical exchange rate models of seventies: do they fit out of sample?’, Journal of International Economics, Vol. 14, pp.3–24. Phua, P.K., Ming, D. and Lin, H. (2000) ‘Neural network with genetic algorithms for stocks prediction’, Proceedings of the Fifth Conference of the Association of Asian-Pacific Operations Research Societies, Singapore, July. Thomas, J.D. (2003) ‘News and trading rules’, Unpublished PhD thesis, Graduate School of Industrial Administration, Pittsburgh, PA: Carnegie Mellon University. Xu, K., Xie, M., Tang, L.C. and Ho, S.L. (2003) ‘Application of neural networks in forecasting engine systems reliability’, Applied Soft Computing, Vol. 2, No. 4, pp.255–268. Zhang, P. (2004) Neural Networks in Business Forecasting, Hersey, PA: Idea Group Publishing.
Notes 1 2 3 4 5 6 7
www.webtrading.com/downloads/forexmanual.pdf http://en.wikipedia.org/wiki/time_series www.tradingsolutions.com www.neuroshell.com/geewhiz.asp www.neuralinvestmentforecast.com www.nd.com E.g., www.webtrading.com/downloads.