BIS Papers No 28
The banking system in emerging economies: how much progress has been made? Monetary and Economic Department August 2006
Papers in this volume were prepared for a meeting of senior officials from central banks held at the Bank for International Settlements in December 2005. The views expressed are those of the authors and do not necessarily reflect the views of the BIS or the central banks represented at the meeting. Individual papers (or excerpts thereof) may be reproduced or translated with the authorisation of the authors concerned.
Requests for copies of publications, or for additions/changes to the mailing list, should be sent to: Bank for International Settlements Press & Communications CH 4002 Basel, Switzerland E-mail:
[email protected] Fax: +41 61 280 9100 and +41 61 280 8100
© Bank for International Settlements 2006. All rights reserved. Brief excerpts may be reproduced or translated provided the source is stated.
ISSN 1609-0381 (print) ISBN 92-9131-717-9 (print) ISSN 1682-7651 (online) ISBN 92-9197-717-9 (online)
Participants in the meeting Algeria
Farid Tiaiba Secretary General of the Monetary and Credit Council Bank of Algeria
Argentina
Miguel Angel Pesce First Vice President Norberto Pagani Senior Manager, International Relations Central Bank of Argentina
Brazil
Katherine Hennings Senior Adviser to the Board of Directors Central Bank of Brazil
Chile
José De Gregorio Vice-Governor Central Bank of Chile
China
Liu Shiyu Assistant Governor Wu Yi Deputy Director, BIS Division, International Department Liu Zhengming Chief Representative, Frankfurt Office People’s Bank of China
Colombia
Hernando Vargas Herrera Technical Manager, Technical Management Office Bank of the Republic
Czech Republic
Miroslav Singer Vice Governor Czech National Bank
Hong Kong SAR
William A Ryback Deputy Chief Executive Hong Kong Monetary Authority
Hungary
Henrik Auth Deputy Governor National Bank of Hungary
India
Vittaldas Leeladhar Deputy Governor Reserve Bank of India
Indonesia
Miranda S Goeltom Senior Deputy Governor Ayu Indira Senior Bank Researcher Enrico Hariantoro Assistant to the Senior Deputy Governor Bank Indonesia
BIS Papers No 28
iii
Israel
Meir Sokoler Deputy Governor Bank of Israel
Korea, Republic of
Soo-Myung Kim Assistant Governor Ji-Young Kim Deputy Chief Representative, Frankfurt Representative Office Hoon-Tae Ryoo Economist, Financial Systems Stability Department The Bank of Korea
Malaysia
Abdul Ghani Zamani Deputy Governor Central Bank of Malaysia
Mexico
José Julián Sidaoui Deputy Governor Bank of Mexico
Philippines
Diwa C Guinigundo Deputy Governor, Monetary Stability Sector Bangko Sentral ng Pilipinas
Poland
Jacek Osinski Director, Financial System Department National Bank of Poland
Russian Federation
Andrey A Kozlov First Deputy Chairman Central Bank of the Russian Federation
Saudi Arabia
Abdulrahman Al-Hamidy Deputy Governor for Technical Affairs Saudi Arabian Monetary Agency
Singapore
Teo Swee Lian Deputy Managing Director, Prudential Supervision Monetary Authority of Singapore
Thailand
Tarisa Watanagase Deputy Governor, Financial Institutions Stability Singhachai Boonyayotin Chief Representative, London Office Bank of Thailand
Turkey
Erdem Başçı Vice Governor Selçuk Saçcı Expert, Banking and Financial Institutions Department Central Bank of the Republic of Turkey
Venezuela
iv
Luis Rivero Adviser to the Presidency Central Bank of Venezuela
BIS Papers No 28
Bank for International Settlements
William R White Economic Adviser, Head of Monetary and Economic Department Már Gudmundsson Deputy Head of Monetary and Economic Department Philip Turner Head of Secretariat Group Ramon Moreno Head of Emerging Market Issues David Archer Adviser Dubravko Mihaljek Senior Economist Madhusudan Mohanty Senior Economist Agustin Villar Senior Economist
BIS Representative Office for Asia and the Pacific
Guonan Ma Senior Economist
BIS Representative Office for the Americas
Serge Jeanneau Senior Economist
BIS Papers No 28
v
Contents
Participants in the meeting .................................................................................................................. iii
BIS background papers The banking system in emerging economies: how much progress has been made? Philip Turner .............................................................................................................................................1 Banks and aggregate credit: what is new? M S Mohanty, Gert Schnabel and Pablo Garcia-Luna ...........................................................................11 Privatisation, consolidation and the increased role of foreign banks Dubravko Mihaljek ..................................................................................................................................41 The changing nature of risks facing banks Ramon Moreno.......................................................................................................................................67 Is financial stability policy now better placed to prevent systemic banking crises? Agustin Villar...........................................................................................................................................99 Implications of recent changes in banking for the conduct of monetary policy David Archer.........................................................................................................................................123
Contributed papers Banking issues in Argentina Miguel Angel Pesce..............................................................................................................................153 Improving the banking system: the Chilean experience Cristina Betancour, José De Gregorio and Alejandro Jara ..................................................................163 The lessons learnt from the development and reform of China’s banking sector Liu Shiyu, Wu Yi and Liu Zhengming ...................................................................................................181 Public debt market risk: the effects on the financial system and on monetary policy the case of Colombia Hernando Vargas H and Financial Stability Department. ....................................................................189 The banking sector after 15 years of restructuring: Czech experience and lessons Vít Bárta and Miroslav Singer...............................................................................................................203 Issues of risk-based supervision in Hong Kong William Ryback .....................................................................................................................................213 Bank efficiency in the enlarged European Union Dániel Holló and Márton Nagy .............................................................................................................217 Recent banking developments in India Vittaldas Leeladhar...............................................................................................................................237 Indonesia’s banking industry: progress to date Miranda S Goeltom ..............................................................................................................................243 Changes in the Israeli banking system Meir Sokoler .........................................................................................................................................249 Restructuring and reforms in the Korean banking industry Soo-Myung Kim, Ji-Young Kim and Hoon-Tae Ryoo...........................................................................259 Re-engineering the Malaysian financial system to promote sustainable growth Abdul Ghani Zamani.............................................................................................................................269 The Mexican financial system: reforms and evolution 1995-2005 José J Sidaoui ......................................................................................................................................277
BIS Papers No 28
vii
The Philippine financial system: issues and challenges Diwa C Guinigundo.............................................................................................................................. 295 Changes in the financing structure of the real economy in Poland challenges for the banking sector Jerzy Pruski and Dawid Żochowski ..................................................................................................... 313 Banking sector issues in Saudi Arabia Abdulrahman Al-Hamidy...................................................................................................................... 327 Fostering a sound and progressive financial sector The Monetary Authority of Singapore.................................................................................................. 337 Maintaining financial stability: the experience of Thailand Tarisa Watanagase and Financial Institutions Policy Group ............................................................... 347 Credit growth in Turkey: drivers and challenges Erdem Başçı ........................................................................................................................................ 363
viii
BIS Papers No 28
The banking system in emerging economies: how much progress has been made? Philip Turner
Introduction The first annual meeting of Deputy Governors from the emerging markets took place at the BIS in February 1995. It had as its central focus the challenge to central banks (and supervisors) as countries moved towards a more liberal banking system in the context of wider capital account convertibility. There was at that meeting a common sense of unease about short-term capital flows, a good deal of scepticism about exchange rate pegs, and much debate on what could be done to improve the resilience of banking systems to external shocks. The Mexican crisis of December 1994 had given these worries particular urgency. A similar meeting at the BIS held almost exactly one year later focused squarely on strengthening the banking system in developing countries. It was chaired jointly by the General Manager of the BIS, the First Deputy Managing Director of the IMF and the Chairman of the Basel Committee. 1 The conclusions echoed many of the worries that had surfaced in 1995. The process of bank supervision in very many countries was inadequate, and in particular had not kept up with the rapid pace of liberalisation of financial markets worldwide. Substantial macroeconomic imbalances often exacerbated financial system fragility. Equally, weak financial systems undermined the effectiveness of monetary policy. At about this time, the Basel Committee was called upon to take the major step of developing internationally accepted guidelines to help to improve the quality of prudential oversight worldwide. The Committee issued a consultative document on the Core Principles for Effective Banking Supervision in April 1997. 2 Several other international reports and initiatives of this period also focused on strengthening banking systems. One report by a group of officials from 16 developing and developed countries was particularly influential in spelling out what was needed in addition to improved banking supervision - work on the quality of the legal framework, macroeconomic policies, and the way other parts of the financial system were regulated. 3 These themes were also stressed in several BIS reports at that time. 4 The BIS Annual Report prepared in early 1997 noted that central banks and other supervisory authorities in Asia had sought to tighten prudential guidelines on the extension of bank credit, particularly where asset prices had been driven up by excessive speculative pressure. 5 But these attempts to instil greater caution into bank lending proved inadequate, and substantial macroeconomic imbalances were allowed to persist. In June 1997, the crisis in Thailand unleashed yet another round of major banking crises throughout the emerging market world. These crises had dramatic consequences domestically and caused major upheaval internationally. In most cases, they went hand in hand with massive macroeconomic disruption: sharp increases in interest rates, substantial currency depreciation and dramatic deflation of domestic demand. All this led to a contraction in bank intermediation that was, in many countries, unprecedented in recent history. The demand for credit fell because of recession and the greater reluctance of borrowers to become indebted. At the same time, the supply of bank credit declined: banks became more risk-averse and a major stiffening of supervisory oversight reinforced this effect in many countries. This shrinkage of bank intermediation was greater and lasted longer than after comparable crises in the industrial world.
1
Goldstein and Turner (1996) originated as one of the background documents for this meeting.
2
The final paper is BCBS (1997). In April 2006, the Basel Committee issued a new consultative document suggesting some modification or elaboration of the earlier principles.
3
See Draghi et al (1997).
4
See, in particular, White (1996).
5
See BIS (1997), “Financial fragility in Asia”, pp 107-17.
BIS Papers No 28
1
During the past few years, however, much of this shrinkage in bank intermediation has been reversed. By 2004 and 2005, bank credit was rising very rapidly in many countries. Perhaps even more importantly, the reforms that had their roots in the mid-1990s had led to a significant overhaul of financial regulation in many countries. Financial markets domestically had been further developed, and financial firms had become subject to more rigorous market discipline than had been the case in the 1990s. An equally radical change is that the internationalisation of financial services and capital markets is now viewed in a more positive light than was the case a decade ago. 6 This change of mindset and ambitious programmes of reforms appear to have contributed to substantial structural strengthening of the banking system in emerging economies. The time thus seemed ripe for a stocktaking of just how much progress had been made. The 11th annual meeting of Deputy Governors, which took place on 8 and 9 December 2005, therefore examined the health of banking systems in emerging markets. Five issues were addressed: 1.
How is the supply of bank credit changing - both in aggregate and in composition?
2.
Is the pace of structural change, which was very intense around the turn of the decade, beginning to slacken?
3.
How are the risks facing banks evolving, and how are they being managed?
4.
Are policies to prevent systemic banking crises stronger than a decade ago?
5.
What are the implications of the changing shape of financial intermediation for monetary policy?
This volume contains papers from 19 central banks (those of Argentina, Chile, China, Colombia, the Czech Republic, Hong Kong SAR, Hungary, India, Indonesia, Israel, Korea, Malaysia, Mexico, the Philippines, Poland, Saudi Arabia, Singapore, Thailand and Turkey) and five papers by BIS staff.
1.
The supply of bank credit
The paper by Mohanty et al in this volume shows that aggregate bank credit to the private sector (expressed as a percentage of GDP) in both Asia and Latin America peaked in the second half of the 1990s and has only recently begun to rise again. This empirical analysis shows that demand factors (eg the output gap and the level of real interest rates) and supply factors (eg the level of non-performing loans and the deposit base) have both exerted significant influence on recent developments. The share of bank credit going to the business sector has declined across the board. A main cause appears to have been lower corporate demand for funds as investment ratios declined and corporate balance sheets were restructured. Several meeting participants noted that financial crises had led to a rise in corporate and bank risk aversion that has endured much longer than expected. Fears of legal action have in some cases accentuated this effect. In some countries, firms continued to build significant “liquidity buffers” long after economic growth had resumed. In addition, highly rated firms are increasingly able to borrow directly in domestic and international capital markets, reducing their reliance on banks. This change has been driven by several forces, including the recent development of domestic bond markets and the growing role of mutual funds in intermediating household saving through equity markets. Capital markets may have provided a useful opportunity for firms to lock in long-term funds at relatively low interest rates. It was agreed that the increased diversification of corporate financing sources is welcome insofar as it reduces the concentration of risk in the banking system and encourages corporate transparency. Banks may also ultimately gain from such diversification by increasing their fee-based income. In addition, in some countries banks have recently focused their attention on lending to the small-scale business sector, where credit quality appears to have improved. Nevertheless, several participants voiced a general
6
2
Mishkin (2006) makes a particularly lucid case for the benefits of financial globalisation.
BIS Papers No 28
concern that credit flows to small and medium-sized firms remain inadequate, with the authorities in many countries trying to get banks to increase such lending. One important dimension of the increased risk aversion of banks has been their appetite for low-risk liquid assets. There has been a substantial accumulation of holdings of government or central bank securities in several countries. Increased issuance of government securities has in recent years had many counterparts: larger fiscal deficits; bank recapitalisation; the increased local currency financing of budget deficits (as part of a strategy to reduce foreign currency borrowing); and various capital account operations (eg to finance forex intervention by central banks). There is some evidence that changes in credit to the government have an influence on bank lending to the private sector. In any event, one consequence is that banks now face increased interest rate risk: yields on government bonds have fallen steadily for several years (generating capital gains for the banks) and are now low. As corporate lending has declined, bank lending to households has increased. There have also been cases where reduced lending to the government sector has released resources for household lending (a “crowding-in” effect). In oil-exporting countries, a particular factor has been the rising oil revenues, which have led to high rates of credit and monetary expansion. A progressive decline in inflation rates associated with lower inflation expectations has brought down nominal interest rates. Real rates have also fallen. This has provided a particular stimulus to mortgage lending as such borrowing tends to be very interest rate sensitive. These cyclical elements have been reinforced by financial liberalisation and the development of securitised products. Credit constraints on households, very severe in some countries, have been eased considerably. Does the recent rapid expansion of credit to households create serious risks for banking systems in view of linked information on specific borrower risk profiles and continued weaknesses in collateral arrangements? The balance of opinion at this meeting was that such risks are generally manageable. The development of information collection and sharing mechanisms over time should contain these risks: to this end, many countries have recently established credit bureaus. Moreover, increased credit to households from a very low base helps to improve the diversification of banking assets. In any case, the non-performing loan ratio for household lending is low. Several participants also thought that banks had sufficiently collateralised their housing loans, and increases in property prices have so far been moderate. Some participants, however, warned against complacency. One recurrent theme was that greater competition (from foreign banks and from non-bank lenders) may in some countries have led to an unwarranted easing in lending standards, often involving a marked compression of bank intermediation spreads. A second worry is that banks have transferred an increasing share of market and exchange rate risks to households by extending long-term loans at variable interest rates and in foreign currency. This means that banks are less exposed to such market risk than earlier. One participant stressed that banks need to be strong enough to withstand shocks from monetary policy: warnings about near-term rises in policy rates had been used to encourage banks to move away from fixed rate mortgages. The converse is that household balance sheets are now much more exposed to interest rate and exchange rate risks. How aware households really are of these risks is unclear. Some participants observed that certain behaviour (eg borrowing in foreign currencies to secure quite modest interest rate advantage) suggests a worrying lack of awareness. A modest rise in interest rates (or fall in the exchange rate) would hurt households, and private consumption would weaken. Nevertheless, loans would still be serviced. The impact would thus be on the macroeconomy and not on the soundness of the banking system. A rise large enough to make some households insolvent would be more dangerous. A final observation is that banks retain their dominant share in the credit market in most countries, and in some cases this share has grown. Weaker non-banks have in many cases been weeded out by crises; and competitive restrictions on banks have been eased in efforts to strengthen financial systems. But several countries have also seen non-bank financial institutions assume a growing role, particularly in the retail loan market. In some countries, non-bank financial intermediaries (sometimes with government guarantees) have filled the gap created by the withdrawal of banks from the mortgage market following a crisis. In others, non-bank intermediaries have increased their market share by specialising in niche markets such as credit card products. There was some concern that the rising share of non-bank financial intermediation in the credit market could lead to some underpricing of credit risk and might create problems, since such institutions may not be adequately regulated and supervised by the authorities.
BIS Papers No 28
3
2.
Slower structural change?
The banking systems in emerging markets have over the past decade been transformed by three major trends - privatisation, consolidation and the entry of foreign banks on a large scale. Mihaljek’s paper in this volume carefully examines these trends, and uses several indicators to gauge how this process has affected performance. He finds that performance has improved in all major types of bank: pre-tax profits have increased and operating costs declined similarly for state banks, for private domestic banks and for foreign-owned banks. Hence it appears that the creation of a more competitive climate has spurred all types of banks to improve performance. There was nevertheless general agreement that the pace of structural change in emerging market banking systems had stabilised over the past five years. This was not because of reform fatigue, several argued, but rather because much of the easy work had already been done. Furthermore, a greater variety in the approach to structural reform seems to have emerged. Regarding privatisation, large countries such as China and India are only gradually transferring ownership of major state-owned banks to the private sector. China is diversifying the ownership of such banks and not necessarily privatising. It is relying on corporate governance reforms related to the planned listings of three large state banks to improve their performance. Some countries have sought to improve the operations of badly run state or local banks by adopting better governance mechanisms without necessarily changing ownership. In India, for example, the authorities have modified earlier plans to increase the share of private ownership in public banks, partly because of opposition in parliament. Elsewhere in Asia, it has been difficult to attract strategic investors in state-owned banks without costly recapitalisations and without offering investors various guarantees against hidden losses. The remaining state-owned banks in other emerging markets have generally improved their governance and performance, and are often playing a useful role in the allocation of credit to certain sectors of the economy (eg in central Europe), or in the transmission of monetary policy (eg in Chile). Several approaches to consolidation were identified. One was the hands-off, market-driven approach common in central and eastern Europe and Latin America. Another was the government-driven, financial “master plan” approach in parts of Asia. In Russia, for instance, takeovers and closures of smaller banks have resulted from greater competition for the household segment of the market from medium-sized banks, which were in turn squeezed out of the small and medium-sized enterprise (SME) segment by large banks. In central Europe, bank consolidation reflects to a large extent M&A activity among parent banks in the European Union. In Asia, on the other hand, the “master plan” approach has often been considered necessary because banking systems in many of the region’s countries are still highly fragmented: most smaller banks are owned by individuals who do not want to give up ownership without special government incentives. Most participants did not consider increased concentration a threat to competition, and many thought that larger banks were better able to diversify and manage risks - and so make the financial system stronger. But it was noted that problems could arise if competition was restricted on a regional level, or if bank exposures became too concentrated. Potential conflicts of interest were also identified as an issue: bank ownership of investment funds creates such a conflict in the advice banks give to their customers about such products. The role of foreign-owned banks has become dominant in central and eastern Europe, but remains limited in Asia. In Latin America (with the exception of Mexico), foreign-owned banks have been less successful in expanding market share than private domestic banks. In central Europe and Mexico, the increased role of foreign-owned banks has brought many benefits. The banking industry has become much more efficient, and credit allocation has greatly improved. This was not the case a decade ago. One view, however, was that foreign banks tended to be more oriented to the household sector (where they could apply their credit scoring technology and spread their risks over a large number of borrowers), and less oriented to small business than domestic banks had been. Nevertheless, the general consensus was that all clients - including the SMEs - now had access to bank credit. The main drawbacks seen here were that foreign-owned banks were politically difficult to defend (they were often viewed as being too profitable) and difficult to supervise. In particular, subsidiaries of foreign-owned banks often behaved like branches, which limited host supervisors’ access to bank management and information. This issue was a special concern in countries where foreign bank subsidiaries were systemically important. Participants agreed that in such circumstances it was more
4
BIS Papers No 28
important to have good working relationships with home country supervisors than to rely on an elaborate legal framework for cooperation. Another problem was the loss of market information from the delisting of large commercial banks from local stock exchanges after their takeover by foreign-owned banks. 7
3.
Managing new risks facing banks
Two general conclusions emerged in the debate about managing the new risks facing banks. The first was that the nature of macroeconomic risk has changed radically. It was clear that the external vulnerabilities (often the result of imprudent macroeconomic policies) that had so aggravated earlier banking crises appeared to have greatly diminished. Yet some participants thought that certain domestic macroeconomic risks were now more serious than a decade ago. The second broad conclusion was that bank lending was now informed by much better risk assessment and management procedures. At the same time, some of the modern techniques were giving rise to new risks, which were not always easy to quantify. Macroeconomic volatility, traditionally higher in the emerging market countries than in the industrial world, has fallen sharply across the emerging market world. As the paper by Moreno demonstrates, various standard measures of external vulnerability have also declined sharply: perhaps as a result of this, sovereign credit spreads have narrowed. It was recognised, however, that part of the improvement seen in 2004 and 2005 reflected the mix of strong global growth and high commodity prices - an unusually favourable combination for many developing countries. But many felt that the main cause was more prudent macroeconomic policies in most emerging market countries. The higher levels of foreign exchange reserves, more flexible exchange rate regimes, the development of domestic debt markets and the reversal of the worst fiscal excesses were all cited as policy changes reducing external vulnerabilities. A particularly important achievement in some countries was the development of local currency debt markets. This had enhanced the resilience of the financial system by making it less costly for banks to adjust their portfolios in response to shocks, and by imposing market discipline on the government (because lax fiscal policies then led to upward pressures on interest rates). But it was also noted that such markets could also transmit shocks from global financial markets more readily. One participant observed that a shift from bank intermediation (fixed nominal value of debts) to capital market intermediation (capital values market-determined) meant that wealth effects of a market correction would be much greater. It was not clear that either banks or supervisors were taking enough account of this macroeconomic risk, which is now common in emerging markets. A survey of central banks (reported by Moreno in this volume) reveals that central banks share the view that external vulnerability has been much attenuated over the past decade. But the survey also revealed that central banks are more worried by three domestic macroeconomic elements - domestic demand, interest rates and property prices. The risk of further rises in oil prices was singled out by several participants as a threat to domestic demand - not only directly but also because the wider inflationary consequences could necessitate steeper increases in policy interest rates than was currently expected. There were rather widely shared worries that increased holdings of longer-duration debt were exposing banks to significant interest rate risk. The discussion on property prices suggested that there was no strong evidence of any general overvaluation. Several noted, however, that better data and more systematic monitoring of 8, 9 households’ balance sheet position would be desirable.
7
See CGFS (2004, 2005) for a further analysis of the impact of foreign-owned banks.
8
The recent CGFS report on housing finance (CGFS (2006)) provides a comprehensive overview of these issues.
9
See Graph 2 in Moreno in this volume. More than half of the 14 respondents said that they saw a high probability of significant harm to the financial sector in the case of a large shock. Moreover, this reading was much higher than their assessment of the risk 10 years earlier.
BIS Papers No 28
5
Although macroeconomic risks seem less menacing now than earlier, the discussion brought several worries to the surface. First, a large devaluation could have strong contractionary effects in dollarised (or “euroised”) economies and could hurt the banking system. Second, fiscal positions in some cases were still fundamentally unsound. Third, avian flu posed a hard to quantify risk. Finally, the very high level of foreign exchange reserves in some countries caused some unease, and suggested certain fundamental weaknesses. Continued and large-scale reserve accumulation involved delaying adjustments to medium-term market forces, which has evident dangers. The second main conclusion was that banks’ lending decisions were increasingly based on serious risk assessment procedures. The influence of government direction and relationship-based lending had diminished. In addition, taking collateral was no longer seen as obviating the need for properly assessing the creditworthiness of the borrower. The survey of central banks described in Moreno’s paper shows (see especially Graph 5 in that paper) that the use of various quantitative risk management techniques by banks in emerging markets has expanded significantly. Valuations are increasingly based on market prices; market risks are quantified, mainly using VaR calculations; scoring models are used to assess the credit risks of households and of small business borrowers; portfolios are stress-tested for various adverse scenarios; in addition, both the pricing of, and the provisioning for, credits are increasingly based on quantitative risk assessments. The board of a bank in the emerging markets increasingly focuses on detailed quantitative reports in the oversight of its bank’s risk exposures. Efforts to instil greater rigour into risk assessment are probably beginning to bear fruit, and this means that risks are being better managed in most emerging markets. Even so, implementation is not without its challenges. Three such challenges related to risk management processes were identified in the discussion. The first was the lack of data on loan histories over many years for estimating default probabilities. The use by some foreign banks of default probabilities derived from their home country market had clear limitations given the very different environment. Some pointed to the development of credit bureaus as helping risk assessment, but it was also observed that banks were reluctant to share data on borrowers with their competitors. Although there was wide agreement that external ratings can help risk management, it was also noted that it was realistic to expect external rating agencies to rate only a comparatively small proportion of the local companies. Some reliance on local credit rating agencies was therefore inevitable. Ways had to be found to guard against the risk of compromising objectivity and the lack of international comparability (all the more important as the banking industry becomes global). A second challenge was that the lack of standard VaR computations sometimes made it hard for supervisors to verify the risk management procedures banks had in place. Finally, several said that modern risk management techniques made formidable demands on staff, IT systems and budgets. As financial systems have become more market-oriented, new risks have had to be addressed. Two such risks were mentioned - those related to liquidity and credit risk transfer. Central banks in many jurisdictions have at some point sought to induce banks to rely on interbank 10 markets, rather than on the central bank, for liquidity. Not all central banks have yet managed to make this transition. Imperfect information can inhibit the supply of credit from one bank to another. Still, a large central bank role in interbank markets has clear disadvantages: it nurtures the (perhaps erroneous) belief that the central bank stands ready to rescue weak banks - and this obviously creates moral hazard. A high degree of concentration can distort the functioning of the interbank markets, and may make it less reliable in a crisis. For example, mechanisms to support the delivery of securities in repo transactions have proved in some cases to be uncertain. A lack of liquidity in interbank markets has at times also created difficulties. In one country, an anti-money laundering campaign unexpectedly resulted in the interruption of the flow of credit to the interbank market. The environment of low and declining interest rates and abundant liquidity that prevailed over much of 2002-05 naturally favours interbank markets. But this should not lead to complacency about how such markets might react if interest rates were to rise.
10
6
The function of the central bank as a lender of last resort raises, of course, different issues and has been left aside.
BIS Papers No 28
Risks related to credit risk transfer instruments have been extensively debated. Such instruments are attractive because they make financial markets more complete and so facilitate hedging. Both protection buyers and protection sellers gain. Banks can sell credit exposures arising from loans they originate. On the other side, investors buy such instruments to increase their exposure to high-yield paper (eg written against credit card debt, loans to small enterprises and so on) and such portfolios can be diversified to minimise risks. Such instruments can also serve to direct funding to certain priority sectors, such as the mortgage market, as well as being used to facilitate financial sector restructuring and the disposal of non-performing loans. Despite the undoubted attraction of such instruments, several participants wondered whether their rapid spread was not outpacing the capacities of banks, non-banks and market structures to absorb and price risks efficiently. Are risks truly being transferred, or do certain clauses (or even a bank’s reputation) mean that such risks could return in certain circumstances? Are transferred risks concentrated in a few players: if so, what are the implications? Are risks in effect being shifted from regulated entities such as banks to entities that are not regulated or are not regulated effectively? The backlog of confirmations of trades in wholesale markets, the fact that some contractual arrangements have not been tested in court, and a lack of supervisory expertise (in bank boards as well as in supervisory agencies) - all these elements suggest the need for caution.
4.
Preventing systemic banking crises
There are several layers of public policies to reduce the risk of systemic crises: rules on corporate governance to ensure banks are well managed; disclosure requirements to help market players to actively monitor banks’ changing risk exposures; prudential regulations and supervisory oversight; early corrective action when problems emerge; deposit insurance; and the lender of last resort function. Greater consciousness of the importance of good corporate governance has led the authorities in many emerging market countries to take measures to ensure that their banks are better run and that their operations are more transparent. Many felt that having appropriate ownership structures was essential for nurturing good governance practices. The much greater attention paid by rating agencies to banks in emerging economies has produced a significant increase in publicly available assessments of the banks’ health. Such assessments are both qualitative and quantitative. Some participants, however, said ratings should be treated with a degree of scepticism. It was noted that they were not updated frequently. Ratings improved only gradually even after radical improvements in a bank’s underlying health. On prudential regulation, the extension and deepening of international understandings as to what constitutes good supervision have affected supervisory regimes worldwide over the past decade or so. The 1988 Capital Accord marks the beginning of this process. Of particular importance for emerging economies have been the Core Principles for Effective Banking Supervision of 1997 and the Financial Sector Assessment Program (FSAP). The issuance of a new capital accord (Basel II) is expected to continue to nurture the development of a culture of risk management. Capital ratios are of course key. It has often been said that capital ratios need to be higher in emerging economies because the macroeconomic environment is more unstable. Villar’s paper therefore compares both capital ratios and macroeconomic volatility between the late 1990s and the first half of the 2000s. In the United States, there has been little change in either - risk-based capital ratios have risen only slightly and there is little discernible movement in volatility. The situation in Latin America and the crisis-hit countries of Asia, however, has been transformed. Macroeconomic volatility has fallen dramatically and risk-based capital ratios have risen. On this important reading alone, then, there is strong evidence that the systemic weaknesses of emerging market banking systems that were clear in the mid-1990s have been considerably reduced. This reassuring picture is confirmed by the survey of supervisory practices more generally. Villar’s paper documents steps taken to dilute risk concentrations and limit connected lending; to establish realistic provisioning rules; and to improve the inspection process. A common theme in the meeting discussion was the evolution in supervisory strategy from “ratio watching” (checking bank positions against predetermined prudential ratios) to a risk-based process (examining the bank’s risk management process). But this evolution took time. Old mindsets had to be discarded - in supervisory
BIS Papers No 28
7
agencies as much as in the audit departments of banks. One participant noted that their new Examiners’ Manual had been sent to bank audit departments in order to help improve risk management processes. Financial firms had to improve the quality and often increase the quantity of staff in risk control functions. Outside assessments of the supervisory process doubtless helped. Several participants said that the FSAPs led by the IMF had been very helpful in this regard, but a number of supervisors also complained about their difficulties in attracting the high-calibre staff needed to conduct the supervisory process. In a competitive environment, many of them find it hard to keep and groom staff. Recent crises have strongly reinforced the message that the authorities need to be able to take action quickly to deal with incipient problems before a full-blown systemic crisis develops. Confidence depends on all involved recognising that the authorities not only have such power but also have the right to use it speedily. Delay could be fatal. In many of the countries attending the meeting, much thought has been given to establishing arrangements that make early action more likely. Independence and legal protection for supervisors are one element. Increased transparency is another. One participant explained that the new Banking Act in his country allowed the minister of finance to take action (without parliamentary approval) if the central bank, the treasury and the supervisory authority all agreed that a systemic risk had arisen. This procedure avoided the difficulty of having to define a systemic crisis in abstract before the event. There was general agreement that an explicit deposit insurance arrangement - subject to a ceiling and not applying to wholesale markets - could make credible the stance that the government did not guarantee all bank deposits. There was a general preference for premia that were fixed ex ante rather than levies imposed only after a crisis. Ex ante premia ensured that payments were made in good times (and so were not procyclical); created a fund that could be used to ensure prompt payouts; and meant that failed banks would have paid contributions. One speaker said that making banks contribute to a special fund to deal with failed banks was much better than relying on general fiscal sources because this would induce banks to monitor carefully the strictness and effectiveness of the supervisory authority. There was also some preference for charging risk-weighted premia; one scheme did not cover any deposits carrying an interest rate beyond a certain ceiling.
5.
Implications for monetary policy
The relationship between the financial system and the workings of monetary policy is complex, and few simple or definite conclusions are possible. One view shared by many at the meeting was that monetary policy had become more potent in recent years as banking systems have become more deregulated and integrated globally. A wider range of transmission channels are now in play, including asset market and exchange rate channels. Views on the operation of the interest rate transmission channel varied. Archer’s paper in this volume provides some evidence that domestic bank loan interest rates are more responsive to changes in money market rates in countries with profit-driven banks operating in competitive markets. But Archer also provides evidence that weakness in the banking system tends to reduce the pass-through of interest rate cuts. This appears to have happened in Asia after the 1997-98 crisis. Lower loan rates and the resurgence of bank credit growth in the past couple of years in countries which had had major banking crises in the second half of the 1990s are therefore further evidence that banking systems in emerging markets are indeed much healthier. It was also clear from the discussions that external factors not related to monetary policy were important in shaping banks’ behaviour. One participant noted that the demand for bank deposits depended on exchange rate expectations: this is presumably an important channel in countries where households and firms switch readily between local currency and foreign currency deposits. It was also noted that the global integration of capital markets had led to some convergence in long-term interest rates.
8
BIS Papers No 28
References Bank for International Settlements (1997): 67th Annual Report, Basel. Basel Committee on Banking Supervision (1997): Core Principles for Effective Banking Supervision, Bank for International Settlements, September. Committee on the Global Financial System (2004): “Foreign direct investment in the financial sector of emerging market economies”, CGFS Publications, no 22, March. ——— (2005): “Foreign direct investment in the financial sector - experiences in Asia, central and eastern Europe and Latin America”, CGFS Publications, no 25, June. ——— (2006): “Housing finance in the global financial market”, CGFS Publications, no 26, January. Draghi, Mario et al (1997): Report of the Working Party on Financial Stability in Emerging Market Economies, Bank for International Settlements, Basel, April. Goldstein, Morris and Philip Turner (1996): “Banking crises in emerging economies: origins and policy options”, BIS Economic Papers, no 46, October. Mishkin, Frederic S (2006): The next great globalization: how disadvantaged nations can harness their financial systems to get rich, Princeton University Press, Princeton NJ. White, William R (1996): “Pitfalls and policy options particular to the financial systems of emerging markets”, paper presented at the 12th Pacific Basin Central Bank Conference, Singapore, 18-20 November.
BIS Papers No 28
9
Banks and aggregate credit: what is new? M S Mohanty, Gert Schnabel and Pablo Garcia-Luna 1
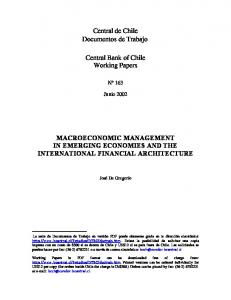
Introduction A major revival of bank lending in emerging market economies is under way. Following years of weak or declining lending growth, bank credit to the private sector, in real terms, was rising at a rate between 10 and 40% in a number of countries by 2005. Such a recovery, reflecting in many countries a strong expansion of credit to households, has arrested the decline in the share of private sector bank credit in GDP, especially in Asia and Latin America, where it had remained a special feature for some years (Graph 1). Indeed, several factors have been favourable to bank lending in emerging economies over the past few years: strong growth, excess liquidity in banking systems reflecting easier global and domestic monetary conditions, and substantial bank restructuring. 2 Such developments raise several questions: what has been the role of banks in the overall financial system in the economy? Have the factors driving bank lending growth changed recently and how sustainable might they prove in the future? Graph 1 Bank credit to the private sector1 As a percentage of GDP 90
Asia2
Latin America3,4
30.0
80
27.5
70
25.0
60
22.5
50
20.0
40
17.5
30
1985
1990
1995
1
2000
2005
1985
1990
1995
2000
2005
15.0
2
Simple average of country data. Hong Kong (SAR), India, Indonesia, Korea, Malaysia, Philippines, Singapore and 3 4 Argentina, Brazil, Chile, Colombia, Mexico, Peru and Venezuela. Moving average of current and previous Thailand. year private credit levels to current year GDP. Sources: IMF; BIS calculations.
The objective of this paper is to address some of these issues in the context of developments over the past five years. The rest of the paper is organised as follows. Section 1 discusses recent trends of bank lending with a focus on the role of commercial banks in financial intermediation. While Section 2
1
The paper draws on information provided by the central banks of emerging market economies in response to a survey questionnaire and has benefited from their comments. We are thankful to David Archer, Dubravko Mihaljek, Ramon Moreno, Richhild Moessner, Endang Saputra, Philip Turner, Agustin Villar, William White and Seong-Hun Yun for useful comments and to Monica Mauron, Clare Batts, Choon Choon Blanchard and Lisa Ireland for excellent secretarial assistance. Errors that remain are solely ours.
2
See Mihaljek in this volume.
BIS Papers No 28
11
reviews the role of possible factors in explaining recent credit growth, Section 3 provides some empirical evidence on their relative importance. The last section examines the sustainability of the current developments.
1.
Recent trends
The role of commercial banks As Table 1 shows, commercial banks remain the most important source of credit supply in emerging market economies (see Annex Table A1 for further country details). The dominant role of commercial banks has changed very little over the past decade. However, this is truer for Asia than for central Europe and Latin America. There, non-bank financial intermediaries (particularly development financial institutions) not only account for a substantial part of the outstanding credit by all financial institutions but also their relative importance has been rising over the past decade. In contrast, in the United States, financial intermediaries other than commercial banks play a more important role. Table 1 Real aggregate credit1 Share in aggregate credit Average growth rate
Commercial banks
Other banks and non-bank financial institutions
199599
200004
1994
1999
2004
1994
1999
2004
3.6
4.5
78
69
68
22
31
32
China
17.1
13.3
100
100
100
0
0
0
India
6.1
14.6
97
3
1.4
3.4
97
3
–0.3
4.7
9.6
8.1
7.8
9.6
10.1
3.3
Latin America2
Hong Kong SAR, Singapore 3
Other Asia
Central Europe
4
5
Total
Memo: United States
62
70
74
96
83
86
88
88
23
17
18
38
30
26
4
17
11
12
12
77
83
82
1
Referring to domestic credit by commercial banks, other banks (excl central banks) and non-financial institutions (questionnaire). In cases where data are not available from the questionnaire, they have been taken from the IMF, IFS; deflated using annual percentage changes of the consumer price index; regional averages calculated using 2000 GDP PPP 2 3 weights. Argentina, Brazil, Chile, Mexico, Peru and Venezuela. Indonesia, Korea, Malaysia, the Philippines and 4 5 Thailand (columns 3 to 8 except Indonesia). Czech Republic, Hungary and Poland. Countries shown plus Israel, Russia, Saudi Arabia, South Africa and Turkey (columns 3 to 8 except Indonesia, Israel and Russia). Sources: IMF; national data.
Reasons for shifts in the market shares of banks and non-banks vary. For example, in India an important reason for the rising share of banks in total credit has been the recent conversion of several non-banking financial institutions into banks. In Korea, such a trend has been driven by a return of public confidence in the banking system following substantial restructuring in the aftermath of the 1997-98 financial crisis. In Indonesia, bank intermediation has started to recover from the crisis, and its role could potentially rise in the future. In Chile, the rise in banks’ market share is due to increased mergers and acquisitions leading to greater financial innovation in the banking industry. In contrast, in Thailand, non-bank financial institutions, particularly specialising in credit card lending, have recently gained market share. This also is the trend in Mexico, where specialised mortgage institutions
12
BIS Papers No 28
dominate low-income mortgage lending. In central Europe (the Czech Republic and Poland) leasing and factoring business, in particular, is rising. At the same time, the use of capital market finance has increased (Table 2). There is some evidence to suggest that the role of bond financing in emerging markets has been rising over the past five years. Issuance of government bonds - particularly in local currency - has been strong in many countries over the past five years or so. The corporate sector in emerging markets is also issuing large amounts of bonds - in both domestic and international markets - reflecting perhaps its attempts to diversify financing sources (see Section 2). But the scale of bond and equity financing remains relatively small compared with that in mature markets. The average stock market capitalisation in emerging markets was about 60% of GDP in 2005 compared with over 100% and 90%, respectively, in the United States and Japan. Nevertheless, there are notable exceptions such as Singapore, Hong Kong, Chile, Malaysia, Saudi Arabia and South Africa where the importance of capital market financing is much greater than in other emerging markets (Annex Table A2). Table 2 Sources of finance in emerging markets1 Domestic credit
Domestic debt securities 2 outstanding
Stock market capitalisation
Memo: International financing3
As a percentage of GDP
Latin America4,5 China India 4
Hong Kong SAR, Singapore 4,6
Other Asia
Central Europe 4,8
Total
Memo: United States Euro area Japan
4,7
1999
2005
1999
2005
1999
2005
1999
2005
42
45
31
46
36
49
27
22
130
169
22
33
33
39
3
3
51
65
23
41
42
68
4
5
130
122
33
41
286
344
27
55
89
80
45
58
68
65
20
17
40
42
26
46
22
34
14
27
78
92
27
40
52
62
13
12
80 122 161
92 154 150
150
163
45
200
112 59 94
23
134
150 74 104
7
9
1
2
End of period; for 2005, latest available data extrapolated, if necessary. Excepting Israel, Saudi Arabia and Venezuela. 4 Non-bank cross-border liabilities to BIS reporting banks and international debt securities outstanding. Weighted average 5 of the economies listed based on 2000 GDP and PPP exchange rates. Argentina, Brazil, Chile, Colombia, Mexico, Peru 6 7 and Venezuela. Indonesia, Korea, Malaysia, the Philippines and Thailand. The Czech Republic, Hungary and Poland. 8 Countries shown plus Israel, Russia (except for stock market capitalisation), Saudi Arabia, South Africa and Turkey. 3
Sources: IMF; International Finance Corporation; Datastream; BIS statistics.
Table 3 focuses on the trends in real bank credit to the private sector, which is the most critical component of domestic credit from the viewpoint of both growth and financial stability. Many countries witnessed sharp increases in bank lending to the private sector during the first half of the 1990s followed by a major slowdown or collapse in the second half. 3 Nevertheless, a major revival has set in
3
Some of the major turning points in the emerging market credit cycle during the past one and half decades have been associated with the Mexican crisis in 1994, the end of high and hyperinflation in Latin America in the 1990s, the 1997-98 Asian financial crises, the collapse of capital inflows during the early and late 1990s, and the global economic slowdown in 2001.
BIS Papers No 28
13
over the past two years. During 2005, for instance, bank credit to the private sector, in nominal terms, rose rapidly in several countries in Latin America. Such credit expansion in the face of low or moderate inflation has meant equally sharp increases in real bank credit (Annex Table A3). A similar trend has also been visible in central Europe, Russia, Saudi Arabia and Turkey. Table 3 Real bank credit to the private sector1
Latin America3
1990-94
1995-99
2000
2001
2002
2003
2004
2000-04
20052
21.8
–0.2
–1.2
–4.9
–1.4
–2.9
7.7
–1.1
18.4
3.9
6.9
15.9
3.9
17.8
5.7
25.8
13.5
30.0
6.9
0.6
–1.5
5.2
–1.1
3.9
5.5
2.2
–3.2
11.6
4.0
5.0
1.4
10.4
6.8
7.4
5.9
India Hong Kong SAR, Singapore 4
Other Asia
Central Europe 7
5
8.8
5.7
–1.8
6
1.6
9.9
5.0
3.8
8.2 6
8.0
Total
11.3
6.9
8.7
4.2
10.2
10.1
13.2
8.9
15.8
Memo: G3 China8
1.1 10.6
4.7 16.0
6.4 9.8
3.1 9.7
1.0 17.7
3.8 17.0
4.2 8.6
3.7 12.5
8.1 9.4
1
Annual changes, in per cent; referring to commercial banks (questionnaire) or, if not available, IMF, deposit money banks. 2 Latest available data extrapolated until end-2005, if necessary. Regional averages using 2000 GDP PPP weights. 3 4 Argentina, Brazil, Chile, Mexico, Peru and Venezuela. Indonesia, Korea, Malaysia, the Philippines and Thailand; first 5 6 column: except Malaysia. The Czech Republic, Hungary and Poland. Affected by bank restructuring in the Czech 7 Countries plus Israel, Russia, Saudi Republic (the Czech Consolidation Bank was removed from the banking system). Arabia, South Africa and Turkey; first column: except the Czech Republic, Malaysia, Poland, Russia, Saudi Arabia and 8 Taiwan, China. Credit to the non-government sector. Sources: IMF; national data.
In Asia the picture has been somewhat mixed. In China, data on private sector credit are not available. However, bank credit to the domestic non-financial sector, excluding the central government decelerated during 2004 and 2005, particularly in the wake of 2003 monetary tightening measures. India and Korea saw sharp acceleration of credit growth in 2005. In contrast, domestic credit growth remained depressed or fell further in the past two years in Hong Kong, the Philippines, Singapore and Thailand.
Composition of bank credit The recent surge in bank lending has been associated with important changes on the assets side of banks’ balance sheets. First, credit to the business sector - historically the most important component of banks’ assets - has been weak or contracted, with its share in domestic assets falling over the past five years in the countries covered by Table 4. In contrast, the share of the household sector has increased sharply in several countries during this period. While banks have been expanding their retail business through increased mortgage and credit card lending, households have been more willing to finance their consumption and residential investment through bank credit. Central Europe has witnessed sharp household credit expansion in the past five years. Russia, South Africa and Saudi Arabia have recently witnessed a similar trend, although it is important to bear in mind that household credit in these countries is rising from a low base. This also remains true for China, India and Indonesia. The share of household credit has been rising rapidly in Korea, Malaysia and Thailand during the past five years, particularly following the 1997-98 Asian financial crises. In Latin America, residential mortgage lending remains strong in Chile and Colombia while Mexico has seen a sharp increase in the share of consumer credit in total domestic credit.
14
BIS Papers No 28
Table 4 Composition of bank credit1 Housing credit 1994 Latin America Argentina Chile Colombia Mexico Venezuela Asia India Hong Kong SAR Singapore Indonesia Korea Malaysia Thailand
13 17
7 14
10 9
Central Europe Czech Republic2 Hungary Poland Israel Turkey
0 0
1
Consumer credit
1999
2004
18 17 7 16 4
7 21 11 9 1
15 20 5 9 18 7
10 15 26 6 33 28 10
10 3 2
16 17 10
0 0
8 2
1994
8 7
2 13
4
15 2
Business credit
1999
2004
15 9 15 4 18
7 12 14 13 7
3 12 7 18 8 3
12 3 15 18 17 16 6
4 6 21
5 8 23
10 3
9 6
Of commercial banks. As a percentage of total domestic credit of commercial banks. refer to 2002.
1994
79 62 44
86 60
64
76 2
1999
2004
38 74 56 36 55
17 67 39 28 47
7 76 51 60 69 64 71
7 73 39 37 47 45 68
41 62 44
37 46 35
58
39
The data in the middle columns
Source: National data (questionnaire).
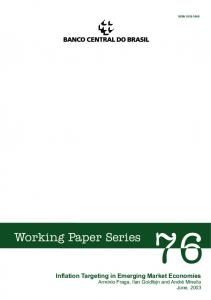
A second development has been the sharp rise in banks’ investment in government securities. As a result, commercial banks have come to hold a very large part of their domestic assets in the form of government securities - a process that seems to have begun in the mid-1990s (Graph 2). 4 There is both a demand and supply side explanation to this phenomenon. One demand side factor is that weak corporate demand for credit has led banks to seek alternative investment opportunities, particularly as they were awash with liquidity in an easy monetary environment (see Section 3). Another common factor has been the increased risk aversion and the associated tendency among banks to hold liquid assets. In Korea and Thailand, for instance, banks raised their holding of government securities particularly in the aftermath of the 1997-98 financial crises. In India, investment by banks in government securities increased rapidly even as the mandatory investment requirement on banks was substantially reduced in the 1990s. In Latin America, increased demand for dollarindexed government securities as a hedge against exchange rate risk may have played a role. In Chile, for instance, among the important factors driving demand for such securities are the recent “nominalisation” of interest rates - whereby the central bank shifted from an indexed interest rate operating system to a nominal one - and higher exchange rate volatility. A similar trend has also been
4
A similar trend has been witnessed in countries where central bank securities rather than government bonds constitute the main source of supply of treasury securities. An important difference, however, is that such investments have been reflected in a rise in commercial banks’ claims on the central bank and not a rise in the overall credit supply in the economy.
BIS Papers No 28
15
seen in Venezuela, where the government issued dollar-denominated bonds for local currency, providing banks with an opportunity to hedge their currency risk exposures. Graph 2 Government securities held by commercial banks As a percentage of total domestic credit1 80 End-1994 Mid-2005
70 60 50 40 30 20 10
HK 1
IN2
ID3
KR4
MY
2
SG
TH
CO
Of commercial banks. The first column refers to end-1997. 5 refers to end-2004. The first column refers to end-1999.
MX 3
VE4
CZ5
HU5
PL3
IL4
The first column refers to end-1996.
SA 4
TR
0
The second column
Source: National data (questionnaire).
From the supply side, securities issuance was increased through various channels: large government borrowing in countries where fiscal deficits remain high (for instance Colombia, Hungary, India, Malaysia, the Philippines, Poland and Turkey); an increased trend towards local currency financing of fiscal deficits as a strategy to reduce governments’ exposure to foreign currency risks (particularly in Latin America 5); and issuance of more government debt either to develop the domestic bond market (for instance Singapore) or facilitate central banks’ sterilised intervention (for instance India). Yet another factor (for instance Indonesia and Turkey) has been the recent effort to recapitalise banks or restructure their bad debts by issuing government securities. This has transferred a large part of banks’ non-performing claims on the private sector to the government sector. It is unclear whether the rapid accumulation of government securities by banks has “crowded out” some private firms needing finance from the credit market. As noted above, the corporate demand for credit remains weak, banks appear to be willingly investing in government securities (as opposed to mandatory lending to governments), and large fiscal deficits have not so far pushed up interest rates significantly (see Section 3). Moreover, some securities holdings by banks may represent precautionary liquidity balances, and thus could be temporary in character. On the other hand, there could eventually be an adverse impact if there has been a structural shift towards banks’ holding more risk-free assets. Moreover, the impact could potentially rise as interest rates go up and fiscal deficits stay high. To the extent that a large stock of government or central bank securities pushes up the risk premium on sovereign debt, it could also lead to a sharp increase in the interest rate charged to private sector borrowers.
5
16
See Jeanneau and Verdia (2005) and Tovar (2005) for recent developments in local currency bond markets in Latin America.
BIS Papers No 28
2.
The underlying factors
This section first briefly reviews the reasons usually associated with bank lending fluctuations in emerging economies before addressing what is special about the current cycle. The next section examines the quantitative significance of some of the demand and supply factors in the current cycle.
What causes bank lending fluctuations? There are competing views about what causes bank credit fluctuations in emerging economies: one focuses on demand side elements and the other on the supply of credit. In practice, it is hard to prove the dominance of either side, and both might well be in play at many times. According to one view, changes in bank credit reflect firms’ and households’ demand for bank loans. Under this hypothesis, credit supply is relatively elastic, and adjusts to prevailing demand conditions. For example, Ghosh and Ghosh (1999) show that the collapse of bank lending in East Asia following the 1997-98 financial crises was led by a decline in the demand for bank loans rather than banks’ withdrawal from the credit market. Cottarelli et al (2003) argue that conceptually the recent lending boom in central and eastern Europe reflects an upward shift in the IS curve in the region following 6 macroeconomic deregulation. Such a view is also reflected in the real business cycle literature, which shows that the demand for bank credit is highly procyclical. 7 Thus credit growth will rise during an upswing and fall during the downswing, reflecting real factors that drive investment and consumption in the economy. One propagation mechanism could be a positive shock to the terms of trade that boosts private wealth expectations and the demand for credit in the economy. Montiel (2000) examines several episodes of consumption boom in industrial and developing economies between 1960 and 1995. He concludes that in the majority of countries it was the consumption boom originating in terms-of-trade improvements that led to subsequent sharp increases in bank credit. Another mechanism could be a perceived positive technological shock that raises investment and credit demand in the economy to a high level. Such a mechanism was believed to have played a major role in the buildup of an investment bubble in Southeast Asia prior to the 1997-98 financial crises. 8 An alternative view is that fluctuations in bank credit reflect supply side developments such as changes in banks’ capacity and willingness to lend. 9 To the extent that some firms face a high external premium in accessing the capital market, or such markets are not well developed, they are heavily dependent on bank lending. Others have argued that bank credit is, indeed, special because it could trigger innovation, particularly in industries that did not have access to external financing; see Rajan and Zingales (1998). Thus any shock that relaxes banks’ lending capacity - a rise in capital inflows or an easier monetary policy - could lead to increased credit supply in the economy. Moreover, such shocks could affect asset prices and balance sheets, exerting an indirect influence on banks’ capacity to lend. 10 Many have argued that financial liberalisation in the face of poorly regulated and supervised banks and inappropriate incentive structures have led to increased boom and bust credit cycles in emerging economies; see Hernández and Landerretche (2002) and Barth et al (2002). 11 For example, a sharp rise in capital inflows can lead to excessive growth in bank lending and overheating of asset prices.
6
Their empirical results show that the recent acceleration in the private sector credit to GDP ratio primarily reflects the overall financial deepening process as well as “crowding-in” of private spending by the recent reduction of government deficits, the privatisation of state-owned enterprises and, more generally, the progress of these countries towards market institutions.
7
See Mendoza (1995) and Gourinchas et al (2001).
8
Moreover, to the extent that the net worth of firms varies with the business cycle, affecting their external financing premium, their demand for credit could vary procyclically with output.
9
The so-called “credit view” is a typical example of this; see Bernanke and Gertler (1995).
10
See Agénor et al (2000) and other papers reviewed therein for evidence on the supply side view of bank credit in East Asia. Braun and Hausmann (2001), Barajas and Steiner (2002) and Singh et al (2005) provide similar evidence for Latin America.
11
See also Allen et al (2002), Calvo (1998), Cespedes et al (2000), Tornell and Westermann (2002) and IMF (2004a) for discussions of mechanisms of boom and bust credit cycles in emerging economies.
BIS Papers No 28
17
This is followed by a “credit crunch” as asset prices collapse and banks’ non-performing assets rise. Banks become more risk-averse and repair their balance sheets by cutting back loan supply and maintaining high liquid assets to liabilities ratios. Several recent studies show that access to bank credit improves when the banking system is less concentrated, more open to foreign participation and well regulated; see Beck et al (2003). By contrast, banking crises have often resulted in a prolonged period of credit crunch and a substantial loss of output. 12 Banks’ willingness to lend could also be affected by the regulatory regime in place, and by whether they hold enough capital to support all new profitable loan proposals; see Bernanke and Lown (1991). More recently, an institutional view has emerged which stresses the role of creditors’ rights and improved information sharing among lenders in removing supply-led credit constraints in emerging economies. 13 The basic argument is that countries with better private property rights and credit risk screening mechanisms (particularly well functioning credit bureaus or credit register systems) are able to achieve a higher credit to GDP ratio than those that lack such institutions.
What has changed? Changes in bank credit to the private sector and output gaps have been closely related in emerging economies (Graph 3). In Latin America, for instance, a sharp decline in bank lending towards the end of the 1990s was associated with a narrowing (or negative) output gap, while the subsequent recovery in credit growth has been closely accompanied by strong output growth. This appears to be a general phenomenon in many commodity-exporting countries (for instance Russia, Saudi Arabia and South Africa) in the current cycle as large terms-of-trade improvements have been associated with higher demand for bank credit. A similar trend has also been observed in Africa. In Asia, too, the covariance of credit growth and the output gap appears strong, although this relationship seems to have weakened over the past few years. Graph 3 Credit growth and output cycle1 Asia2 18
Latin America3 9
36
12
6
24
6
6
3
12
3
0
0
0
0
–6
–3
Real credit growth (lhs)4
1990
1992
1994
1996
1998
2000
2002
2004
1
9
Output gap (rhs)5
–12
–3 1990
1992
1994
1996
1998
2000
2002
2004
2
Weighted average of country data, using 2000 PPP GDP weights. China, Hong Kong SAR, India, Korea, Indonesia, 3 4 Malaysia, Philippines, Singapore and Thailand. Argentina, Brazil, Chile, Colombia, Mexico, Peru and Venezuela. Private 5 credit deflated by consumer prices; annual change, in per cent. Deviation of actual GDP from trend GDP, in per cent. Trend based on an HP filter applied to annual data (standard specification). Source: National data.
Increased corporate financial diversification? Important changes also seem to be taking place affecting the demand for credit by both firms and households. As noted, in many countries, the corporate sector appears to have reduced its demand
12
For a recent review, see Demirgüç-Kunt and Detragiache (2005) and also Dell’Ariccia et al (2005).
13
See Jappelli and Pagano (2002) and Djankov et al (2005).
18
BIS Papers No 28
for bank credit over the past few years. In Asia, for instance, outstanding corporate loans from the banking system (excluding China and India) fell by 20 percentage points of GDP between 1997 and 2003; see IMF (2005). In Latin America the decline has been of the order of 10 percentage points of GDP during the same period. In the recent cycle, corporate debt accumulation through bank borrowing remains strong only in central and eastern Europe. One explanation for weak demand for corporate credit is that overly indebted firms sought to reduce their excess leverage as part of the restructuring process to improve their balance sheets. This was particularly evident in Asia in the aftermath of the 1997-98 financial crises. Such a trend was later seen across many emerging economies, as firms in non-crisis countries also became more cautious borrowers. 14 Nevertheless, some recent estimates suggest that leverage ratios in the corporate sector are falling, which should have improved firms’ appetite for new bank loans. For example, in Asia (excluding China and India) the debt-to-asset ratio in the corporate sector stood at 35% in 2003 compared to over 50% in 1997; see IMF (2005). 15 In Korea, the debt-to-asset ratio more than halved to 24% between 1997 and 2004. The ratio also remains well contained in Latin America and central Europe (between 20 and 35%). Another explanation is that firms have been diversifying their financing sources by issuing bonds and equities. There is some evidence in support of this hypothesis. In Asia, for instance, the amount of outstanding corporate bonds (excluding China and India) increased from less than 20% of GDP in 1995 to 30% by 2003; see IMF (2005). Corporate bond financing remains particularly strong in Hong Kong, Korea and Malaysia, where bond markets are relatively well developed. 16 In India, a similar diversification seems to be taking place through increased borrowing from abroad and equity financing. Moreover, with corporate profits rising, firms have been financing a large part of their investment through retained earnings. In Latin America, easier external financing conditions have instead encouraged firms to access the international syndicated loan and bond market. In some cases (eg Mexico), firms have been increasingly accessing domestic bond markets. This trend towards increased capital market financing may well lead to financial disintermediation of the type witnessed by many mature markets over the past two decades. From a longer-term perspective, it could, however, be argued that corporate demand for bank credit may be temporarily low in Asia, and could eventually rise as investment rates recover from their post-crises lows. Strong growth, increased investors’ confidence and the large public infrastructure projects recently announced by several countries (for instance Indonesia, Malaysia and Thailand) could potentially facilitate such a recovery. Another outstanding question is how much of the recent reduction in business credit growth may actually reflect constraints on supply rather than demand. For example, several recent studies in the context of Latin America show that firms - especially in the small and medium-scale sector - continue to face severe collateral constraints in accessing bank finance; see Galindo and Shiantarelli (2003). However, as discussed in the overview paper by Turner in this volume, one important finding emerging from the discussion was that the reduction of corporate credit demand does not necessarily imply an adverse development for either the overall economy or the banking system. With the corporate sector’s access to capital market rising, it will increasingly switch between various sources of financing depending on the relative cost of funds. In any case, only large firms are able to reap this diversification opportunity. In some countries (eg Korea), commercial banks have been able to fill this gap by increasing lending to small profitable firms; see Lim (2003). Banks might ultimately gain as they change their business strategies in response to increased corporate diversification. For instance, in Singapore, intense competition and tightening profit margins have shifted the focus of banks towards
14
See IMF (2004b).
15
However, using firm-level data Rath et al (2003) show that the leverage ratio in emerging market corporate sectors remained significantly high at the end of 2001, adversely affecting their profitability and capacity to absorb new debt. Glen and Singh (2003) reach a similar conclusion by comparing leverage ratios of emerging market firms with those of industrial countries.
16
According to the estimates by Gyntelberg et al (2005), outstanding corporate bonds relative to GDP stood at 49%, 39%, and 36%, respectively, in Korea, Malaysia and Hong Kong at the end of 2004 compared to 10 to 20% in China, Singapore and Thailand.
BIS Papers No 28
19
fee-based income to improve profitability. A similar trend is also seen in the Philippines, where banks have increased lending to microfinance institutions. Strong household credit demand Household sector credit demand has been unusually strong in most countries. Several demand and supply forces are probably at work. First, strong growth has not only boosted household current income but may also have countered pessimistic expectations of higher future income that prevailed in the late 1990s. As predicted by the life-cycle model, such a shift would be accompanied by a rise in the share of household expenditure in current income and increased demand for bank credit. Moreover, in many countries (especially in Asia) recent financial liberalisation involved the removal or substantial dilution of restrictions on bank lending to housing and consumer sectors. With household borrowing constraints thus relaxed, latent demand materialised. 17 In China, for example, home mortgage and consumer durable loans (particularly automobile hire purchase) rose at a rapid rate following the relaxation of controls on household lending in 1999; see Liping and Gang (2002). India has seen similar household credit expansion during the past few years. As noted by Pruski and Żochowski in this volume, in Poland household credit demand has been boosted by increased income expectation following its entry into the European Union, the population boom of the 1970s and the 1980s, increased net migration to the cities and expected increases in house prices. In the Czech Republic, some of the major factors have been an initially low level of household debt and a change in the lifestyle of people towards “living off bank credit”. In Turkey, the recent reduction of inflation, increased consumer confidence and prospects of EU convergence have 18 played a similar role. Similarly in Saudi Arabia, a rapidly growing young population, as well as the fact that banks can recover their debts by channelling wage payments through the interbank market, has been driving consumer credit. 19 A second factor has been the role of policy. In many countries, the authorities have taken steps to encourage residential investment and borrowing-led household consumption as part of the strategy to revive domestic demand. Such incentives have taken several forms: preferential tax treatment of mortgage interest payments and capital gains from property transactions; temporarily increasing loanto-value ratios; the establishment of various housing subsidy schemes to promote low-cost dwelling units; and, in some cases, the promotion of a population-wide credit card culture (for example, through a temporary relaxation of income criteria). Reinforcing these changes have been far-reaching financial innovations such as flexible mortgage contracts to meet the cash flow requirements of people within different income brackets, variable rate mortgages and other sophisticated mortgage and credit card products, which have attracted increasing numbers of households to the retail loan market. A third factor has been the recent sharp reduction in the interest rate charged to households. This is driven by several reinforcing developments. With inflation declining and becoming more stable in recent years, inflation expectations as well as the inflation risk premium have fallen, bringing down both nominal and real interest rates. This has attracted potential home owners to the mortgage market 20 not only by reducing initial debt servicing payments relative to income, but also by increasing the affordability of housing for low-income segments of the population more generally. To the extent that a reduction in long-run real rates increases equilibrium asset prices and household wealth, it may have played an added role in boosting household demand for bank credit.
17
Industrial countries had witnessed a similar surge in demand for consumer and residential credit following financial liberalisation in the 1980s and 1990s leading to substantial relaxation of credit constraints facing households; see Bacchetta and Gerlach (1997).
18
See Başçi in this volume.
19
See the paper by the Saudi Arabian Monetary Authority in this volume.
20
This is technically called “front-end loading”. The idea is that high inflation, by keeping the nominal interest rate at a high level, increases interest payments as a share of income in the first few years but reduces them later as nominal income rises and the real value of the principal falls with inflation. By contrast, low inflation reduces the upfront debt servicing costs relative to income but raises them later as nominal income rises less rapidly and the real value of debt falls more slowly; see Stevens (1997) and Debelle (2004).
20
BIS Papers No 28
At the same time, monetary policy has been eased significantly in a number of countries, bringing down short-term real interest rates. As Graph 4 shows, short-term real rates have been very low or zero in several economies in Asia and central Europe over the past four years. In Latin America, real rates also remain low by historical standards. As a result, real mortgage rates have reached historical lows over the past few years in many countries (1 to 5%, for instance, in Chile, Hong Kong, Singapore and Taiwan (China) in 2004). Graph 4 Real short-term interest rates1 20
Asia
Latin America China India
15
Others Brazil3 Chile Mexico
Hong Kong SAR Korea
20
Czech Republic Hungary
15
10
10
5
5
0
0 Indonesia2 Thailand
–5 –10
1996 1 2
1998
2000
2002
2004
Poland Saudi Arabia
1996
1998
2000
2002
2004
1996
1998
2000
–5
2002
2004
–10
Three-month annual interest rates deflated by annual consumer price inflation. Definitions may differ across countries. 3 Trough values close to –20% in 1998 Q3. Peak values close to 35% in 1998 Q4 and 1999 Q1.
Sources: Bloomberg; Datastream; national data.
Has banks’ capacity to lend improved? An important question is to what extent the recent increase in private sector credit reflects improvements in banks’ capacity to lend. To get a measure of banks’ lending capacity, Table 5 presents a simple balance sheet identity of the banking system. Although the asset and liability positions of banks are not mutually independent (as a change in one may well affect the other via the credit multiplier or other equilibrium processes), the table can be conveniently used to decompose the sources of credit growth. The idea is that banks can finance their credit expansion in five major ways: (i) expanding deposits (D in Table 5); (ii) borrowing from abroad (ie changes in foreign liabilities over foreign assets (F)); (iii) drawing down reserves with the monetary authority (ie changes in net assets held with the monetary authority (CB)); (iv) reducing their net lending to governments (G); and (v) increasing their borrowing from other sources (including non-banking sources (O)). Table 5 Simplified aggregate balance sheet of deposit money banks Assets
Liabilities
Domestic credit to the private sector (DPR)
Deposits (D)
Net foreign assets (F)
Other financing (eg bonds, credit from other financial institutions, capital accounts, other net items) (O)
Net credit to the public sector (including government securities) (G) Net assets held with the central bank (CB)
Table 6 presents sources of cumulative changes in private sector credit between 1995-99 and 2000-04. The table shows that factors affecting banks’ deposit base - including growth in income, household saving preferences, interest rates, public confidence in the banking system and capital inflows - have a large impact on their lending capacity. In Latin America, the contribution of deposits to
BIS Papers No 28
21
private sector credit growth has fallen sharply over the past five years. Some have associated this development with the region’s low saving rate, volatile capital inflows and weak public confidence in the banking system leading to capital flight. 21 The contribution has also fallen sharply in Southeast Asia (other Asia in the table), Hong Kong and Singapore and central Europe in the recent period. Government borrowing from the banking system has negatively contributed to the growth of credit to the private sector in a number of countries (particularly Latin America and India). Moreover, with the exception of Southeast Asia, banks have not increased their foreign borrowing - indeed, banks’ external investments have grown faster than their borrowings from abroad. The recent recovery of capital inflows to emerging markets, however, may have had an indirect effect on their deposits, relaxing the financing constraint. Table 6 Contributions to real private credit growth1 DPR2
F3
Growth8
CB4
G5
D6
O7
Contribution9
DPR2
F3
Growth8
G5
D6
O7
Contribution9
1995-99 Latin America10
CB4
2000-04
5
–9
–9
–33
35
21
–2
–8
–12
–12
14
15
China
110
–4
–23
–12
137
12
80
–6
–18
–11
133
–17
India
40
0
5
–26
72
–12
89
0
–7
–59
118
36
30
–22
–2
–11
60
5
10
–26
1
–7
39
3
Other Asia
34
–5
–10
–16
62
3
36
1
–11
2
29
14
Central Eastern 12 Europe
41
14
–23
–0
56
–5
17
–4
4
–13
32
–2
49
–1
–10
–24
79
5
61
–2
–14
–15
82
11
24
–2
0
1
21
3
18
0
0
–2
23
–4
Hong Kong SAR, Singapore 11
13
Total
14
Memo: G3 1
2
Referring to deposit money banks (IMF); regional averages calculated using 2000 GDP PPP weights. Domestic credit 3 4 5 to the private sector. Net foreign assets; +: decrease. Net assets held with central bank; +: decrease. Net credit to 6 7 government; +: decrease. Deposits held with the bank. +: increase. Other domestic financing (bonds, credit from other 8 9 10 Cumulative, in per cent. Cumulative, in percentage points. Argentina, financial institutions, capital etc); +: increase. 11 12 Brazil, Chile, Mexico, Peru and Venezuela. Korea, Indonesia, Malaysia, Philippines and Thailand. Czech Republic 13 (only as of 1999), Hungary and Poland. The above countries shown plus Israel, Russia, Saudi Arabia, South Africa and 14 United States and Japan. Turkey. Sources: IMF; national data.
Another factor emerging from Table 6 is that, in net terms, central banks have absorbed liquidity from the banking system by sterilising a part of the deposit growth. Such draining remains significant in Latin America, Southeast Asia, China and India. 22 At the same time, banks’ deposits with the central bank capture only a part of their total holding of liquid assets, given their large investments in government securities. Graph 5 provides one estimate of the excess liquidity in the banking system for selected countries between 1995-99 and 2000-04. It shows the difference between what banks held as liquid assets in each of the periods and what they held on average over the entire period. Liquid assets are calculated as the sum of banks’ net deposits with the central bank and their holdings of government securities. As seen from the graph, in sharp contrast to the second half of 1990s, excess liquidity in the banking system was large in most countries during 2000-04, indicating that the balance sheets of banks were highly liquid.
21
See Singh et al (2005).
22
It needs, however, to be noted that net changes in the central bank’s borrowing position vis-à-vis banks is unadjusted for any changes in the reserve requirement during the period. Hence, it may not provide an accurate picture of monetary policy.
22
BIS Papers No 28
Graph 5 Excess liquidity of banks1 As a percentage of total domestic credit2 40
Average 1995-993
Average 2000-043
40
30
30
20
20
10
10
0
0
–10
–10
–20
HK KR IN4 MY SG TH CL4 CO MX VE PL IL SA TR
HK KR IN MY SG TH CL CO MX VE HU PL IL SA TR
–20
1
Defined as deviation of deposit money banks’ reserves and other claims on monetary authorities (IFS, I.20, 20..) less credit from monetary authorities (IFS, I.26g) plus government securities held by commercial banks (questionnaire) from long-term 2 3 4 average; in per cent. Of deposit money banks (IFS, I.32). Simple average of end-year observations. Refers to 1997-99. Sources: IMF; national data (questionnaire).
Banks’ willingness to lend What about banks’ willingness to lend? As this is not a measurable concept (survey data are few and far between), many have used proxies to represent it. Annex Table A4 presents three relevant variables - the risk-weighted capital ratio of the banking system, non-performing loans and operating costs as a percentage of total assets - across a number of emerging economies. The median capital ratio of the banking system in emerging economies exceeded 14% in 2004 compared to 13% in 1999. This suggests that the low rate of credit growth noted previously was not primarily due to banks’ low capital base. On the other hand, capital ratios are partly endogenous to the extent that they are raised by reducing lending. A more relevant variable in this case is the non-performing loan ratio of the banking system - a high ratio leads to risk-averse lending behaviour as weak banks cut new loan supply to improve their balance sheet and vice versa. As Annex Table A4 shows, non-performing loans have fallen in several countries over the past five years, but remain high in a number of others: ranging between 6 and 9% of total assets in China, Malaysia, the Philippines, Poland and Thailand. Another variable with implications for bank credit is banks’ operating costs. High operating costs could indicate significant inefficiencies in the banking system and a rigid lending rate structure. This could reduce the accessibility of potential borrowers to the banking system. The median operating cost in the emerging economies’ banking system was 3.5% of assets in 2003-04, higher than say 1% in Japan and Germany and 3% in the United States. Despite some reduction over the past five years, operating costs remain higher in Latin America than in Asia. In Brazil, estimates reported by Goldfajn et al (2004) show that about 45% of the banking spread (the difference between lending rate and funding cost) is accounted for by banks’ perceived risks and 40% by administrative costs and taxes. Belaisch (2003) attributes such costs to the high degree of concentration of the Brazilian banking system. Mohan (2002) highlights a similar challenge in the Indian context by pointing out that real lending rates of banks have been sticky downwards despite a significant reduction in nominal rates. Can foreign ownership of banks improve credit availability conditions in emerging economies? The share of foreign-owned banks in total banking assets has grown rapidly in many countries, particularly 23 central Europe and Latin America, over the past decade. Foreign banks are expected to enhance credit supply in host countries, not only by intensifying competition and thereby reducing
23
The share of foreign banks in total banking sector assets in central Europe and Latin America had, for instance, risen rapidly from 5-20% in 1990 to 80-90% and 30-80%, respectively, by 2004. In Asia, excepting Hong Kong and Singapore, the ratio has been generally low, but rising sharply in Malaysia and Thailand over the past decade; see Domanski (2005) for a recent review.
BIS Papers No 28
23
intermediation costs, but also by transferring better technology and risk management skills. Moreover, foreign banks have developed niche banking, such as consumer and mortgage lending, where they tend to have comparative advantages. Their better access to external credit lines (particularly from parent companies), greater ability to disperse risk through globally diversified portfolios, and less reliance on host country financial support could help improve the resilience of credit flows during a crisis. On the opposite side, some have argued that foreign bank subsidiaries may “cherry-pick” business lines, increase losses for domestic banks, transfer global financial shocks to the host country, and exacerbate a crisis by leaving the country in the moments of greatest need. Empirical evidence has been generally supportive of foreign banks’ positive role in relaxing credit constraints in emerging economies, particularly in countries with a weak banking system; see Mihaljek in this volume. 24
3.
Some empirical evidence
This section examines the empirical significance of some of the factors discussed above. The following questions were asked: does bank credit growth vary procyclically in emerging economies? Is the demand for credit sensitive to changes in growth rates possibly reflecting the wealth effect? How strong is the impact of monetary policy on bank credit? Does asset quality matter for bank lending? To answer these questions a reduced form cross-country panel regression was conducted. 25 Changes in real credit to the private sector were regressed on six major demand and supply variables: (i) an estimate of the output gap; (ii) per capita income in the previous period; (iii) non-performing loan ratios of banks; (iv) the real short-term interest rate; (v) an estimate of the banking system’s loanable funds; and (vi) the operating costs of banks. The model is augmented in subsequent estimation by including the terms of trade and real bank credit to the government sector. Appendix 1 at the end of the paper provides details about the estimation method and results. The major findings are as follows: •
Overall, the results show that both demand and supply factors have an important influence on private sector credit growth in emerging economies.
•
Bank credit to the private sector appears to vary procyclically with output. A coefficient above unity on the output gap indicates that bank credit grows more than proportionally with output recovery, which is not surprising given the high degree of dependence of emerging economies’ firms and households on bank credit. At the same time, the coefficient on lagged per capita income growth is significantly positive in most specifications, indicating that strong growth leads to higher expected future income and demand for bank credit.
•
Bank credit is highly sensitive to the NPL ratio. Moreover, bank credit is stimulated by a reduction in operating costs, implying that countries with lower operating costs in the banking system are able to achieve higher bank credit growth.
•
Changes in the deposit base of the banking system have a major impact on its capacity to lend. Nevertheless, bank credit growth falls (rises) by less than one third of a given decline (rise) in loanable funds, highlighting the importance of other offsetting factors. This indicates that, in the event of an adverse shock to their deposit base, banks may liquidate a part of their other assets to maintain a reasonable line of credit to the private sector.
24
For instance, Dages et al (2000) and IDB (2002) note the key role of foreign bank subsidiaries in maintaining stable credit supply in Latin America during crisis times. Detragiache and Gupta (2004) report similar findings for Malaysia but show that Asia-oriented foreign banks (primarily focusing their business in Asia) were relatively less stabilising than non-Asia-oriented banks because they tended to demonstrate the same herding behaviour as domestic banks.
25
One caveat generally associated with the reduced form specification is that the parameters are not easily interpretable, notably because of simultaneous interaction of demand for and supply of bank credit with interest rates. Although this could be corrected by choosing a suitable estimation method (for instance, the instrumental variable method), the short data sample, in our case, constrains its use.
24
BIS Papers No 28
•
Higher interest rates tend to reduce bank credit. This goes to support the view that an easier monetary policy adopted by several countries since 2001 has had a significant expansionary impact on bank credit.
•
Surprisingly, however, changes in the terms of trade do not seem to matter for bank credit when considered with other major variables in the baseline model. It becomes significant only when considered with bank credit to the government sector (model M4 in the appendix). One interpretation of this result is that since changes in the terms of trade are already partly captured by the demand side variables, they do not seem to have an independent effect of their own. But as pointed out by Braun and Hausmann (2001) the significance of the terms of trade is probably greater as a supply variable: an increase seems to relax banks’ financing constraints by raising the probability of currency appreciation and boosting collateral for the international provision of credit, particularly when the government is running a large budget deficit.
•
The results are somewhat sympathetic to the “crowding-out” theory. The coefficient on government credit is significantly negative in some specifications. The low value of the coefficient on changes in government credit might also suggest that this may not have been a major constraint on bank lending to the private sector in the current cycle.
4.
Sustainability of current trends
Can the recent rapid pace of lending growth led primarily by household borrowing be sustained? There are reasons to believe that household borrowing can continue to grow at a fast rate in many emerging economies. For example, growing household income and several recent structural changes can be expected to sustain demand for residential and consumer credit at a high level. Such a trend could also be helped by the fact that, by the standards of industrial economies, household debt relative to income in several emerging economies remains fairly low (Graph 6). Graph 6 Household debt1 As a percentage of disposable income 200 160 120 80 40
SG2
AU
1
JP
KR
US
TH3
The first column refers to end-1999, the second to end-2003. refers to end-2002.
CL 2
HU
PL
CO
The first column refers to end-2000.
ID 3
MX
0
The second column
Source: National data.
Moreover, households are net savers in many emerging economies, and own large financial assets. This is seen from the relatively high household saving ratio in several countries reported in Table 7. From this perspective, emerging economies’ households may have a higher debt absorption capacity with respect to their income than, for instance, industrial economies where the low household saving rate increases the burden of current borrowing on future income. Data on household leverage ratios are scant in emerging economies. Nevertheless, there is some evidence to suggest that the overall household debt to asset ratio in several emerging economies has
BIS Papers No 28
25
been lower than that in industrial economies. For instance, in Taiwan (China), outstanding debts of households were about one tenth of their assets at the end of 2002 compared to, for instance, one fourth in New Zealand. Several Latin American and African economies also have a low household leverage ratio. In Mexico and South Africa, for instance, the debt to asset ratio in the household sector was between 14 and 16% at the end of 2003. However, the ratio appears to have risen in central Europe over the past few years (about 22% and 30%, respectively, in Hungary and Poland by the end of 2003). Table 7 Household savings1 1991
1995
2000
2004
China2
19.5
20.0
16.4
16.6 3
India4
8.3
7.7
9.5
10.1 3
16.9
11.9
6.3
2.6
10.2
7.6
7.1
3.9 3
Mexico2
3.7
9.8
8.4 5
Czech Republic
4.9
2.0
3.2
10.7
10.0
7.0
7.3
12.2
12.1
9.4
4.2
1.7
1.1
Korea 2
Thailand
Hungary Poland 6
South Africa 1
As a percentage of GDP. Definitions may differ across countries. 5 6 years; financial savings only. Refers to 2002. Net saving.
0.8 2
Gross saving.
3
Refers to 2003.
0.5 4
Refers to fiscal
Sources: Kuijs (2005); AMECO; OECD; CEIC; national data.
From the supply side, the sustainability of household credit could be helped by the fact that residential and consumer lending provides banks with important diversification opportunities and higher returns. Many have argued that retail lending will increasingly become the main business line of banks in years to come. This will be driven partly by increased corporate financial diversification and partly by growing foreign bank penetration in emerging markets. Another positive factor has been the recent trend towards securitisation of a part of household debt through the growth of mortgage-backed securities in several countries (for instance Hong Kong, Korea, Malaysia and Mexico). This should further increase the resilience of the mortgage market to adverse financial shocks. Indeed, the strength of the forces supporting both the demand for and supply of household credit is such as to raise concerns that the credit market might even overheat due to a rapid and unsustainable increase in household credit. Such a concern is linked both to the aggregate credit to GDP ratio and to specific imbalances that such a rise might entail. 26 For comparison, Annex Graph A1 plots the actual private sector credit to GDP ratio against its estimated trend for individual countries over the past two decades. The evolution of the actual credit to GDP ratio, in many countries, does not seem to provide a clear-cut warning about vulnerabilities. For example, in a number of countries (mostly Latin America and Southeast Asia), the private sector credit to GDP ratio has been actually below the trend. In India, Hungary, Poland, Russia, Saudi Arabia, South Africa and Turkey, the actual ratio has been either around the trend or has recently exceeded it. In China and Korea, after rising above the trend for some years, the actual ratio is again falling back to the trend. On specific imbalances, however, risks could rise from several sources. One is that households could become overextended. 27 This was, for instance, demonstrated by the credit card debacle in Korea in
26
See BIS (2005) and Borio and White (2004).
27
See Moreno in this volume for an extensive discussion on risks facing banks from their increased exposure to households. For a more general description of household financing risks, see CGFS (2005).
26
BIS Papers No 28
2003. Household debt rose rapidly in a span of two to three years, leading to a sharp increase in the delinquency rate and a subsequent collapse of household lending (Box 1). There are several channels through which a large accumulation of debt by households could lead to widespread financial distress. Low interest rates might prompt households to borrow too much, increasing their sensitivity to future income and interest rate shocks. Another important channel could be a highly skewed income distribution, which may mean that the debt burden falls unevenly across the population. If financial liberalisation, by improving the access of the low-income population to bank credit, encourages them to rely disproportionately on debt-financed consumption, this could become a significant problem. Box 1 Credit cards in Korea - the boom and bust cycle The Korean credit card industry expanded rapidly from 1999 to 2002 as a result of aggressive marketing by lenders and official support via fiscal incentives to credit card holders. During this period the number of credit cards grew from 39 million to over 100 million, an average of four cards per Korean adult. Credit cards were used extensively, with total transactions reaching 114% of GDP in 2002. Initially the credit card business was highly profitable. Returns on equity reached 55% in the first half of 2001, and net profits grew by 175% from 2000 to 2001. Despite the rapid growth, supervisors saw only limited risks because of low estimated future default rates (based on past experience), high profitability and high capitalisation rates among lenders. During 2002 and 2003 this picture changed dramatically. The average credit card delinquency ratio rose to 14% at the end of 2003 from around 6% a year earlier. Over the same period, the eight local credit card companies saw a 170% increase in loss provisioning and a 55% fall in outstanding cash advance balances. As a result, credit card companies’ capital adequacy ratios fell from 13.0% to –5.5%, despite significant additions to capital. Starting in September 2002, credit bureaus enabled financial firms to begin sharing information about borrowers’ total debts, thereby improving lenders’ ability to manage credit risks. Before this, a key element in risk management by individual credit card companies was that customers were required to settle their balance in full every month. However, insufficient information sharing between credit card companies meant that card holders could hold multiple cards and thereby effectively obtain revolving credit lines by shifting debt between cards. It is believed that government regulation restricting the entry of new firms led to an oligopolistic credit card market structure, increasing the market power of the existing credit card companies; see Yun (2004). As the situation worsened, regulation was tightened, leading to cuts in credit lines and the selling of impaired assets. The regulatory changes included limits on cash advances, an increase in capital adequacy requirements, a ban on the issuance of new cards if delinquency rates were above 15% for a given month, the introduction of minimum loss provisioning, a ban on aggressive marketing, and requirements to verify the identify and incomes of all new customers. The impact of the increasing delinquencies and regulatory tightening was that consumption, after growing by close to 7% in 2002, declined by 1.4% in 2003. The authorities also set up several channels to deal with the debts of delinquent borrowers, including debt restructuring by financial institutions of credit card holders without multiple debts and the setting-up of a “bad bank” (Hanmaeum) to help those with debts to more than one institution. There has been a decline in delinquency rates as well as in the number of credit cards over the past two years. By 2005 credit card companies had again started to make large profits.
Moral hazard problems are a challenge. For example, the lack of established credit bureaus with sufficiently long data on household credit history means banks do not have adequate information about potential defaulters. Weak contractual rights of bank creditors make matters worse by reducing banks’ ability to recover their debt and encouraging delinquent behaviour among borrowers. Many countries are trying to establish credit bureaus and so enhance information-sharing among banks. In Korea, for instance, increased information-sharing among the credit card companies following the recent crisis has led to a reduction in the ratio of delinquent borrowers. In India, the recent legislation empowering banks to seize assets of defaulters appears to have had a similar effect. In Mexico, private credit bureaus have recently been set up to share information among firms that contribute to the database, thus removing a major constraint associated with the public register system, which was primarily used for research by financial institutions rather than for selection of debtors. 28
28
See Sidaoui in this volume.
BIS Papers No 28
27
In addition, banks have transferred a large part of their market risk to households. In countries with predominantly variable rate mortgage debts, households may have become highly exposed to future fluctuations in interest rates. In some countries, mortgage loans have been primarily short to mediumterm (less than three years), as banks have reduced the maturity gap between their assets and liabilities. A similar risk transfer is taking place in central Europe, where a large part of household debt is denominated in foreign currency (for instance, 25 to 30% in Hungary and Poland at the end of 2004). Low foreign interest rates and expected currency appreciation have increased household demand for foreign currency loans by reducing future loan liability.At the same time, a large buildup of foreign currency positions exposes households to future losses were the exchange rate to depreciate sharply. As discussed by Turner in this volume, a major policy concern is whether households are fully aware of the risks they are assuming and whether they can withstand large unexpected shocks that can quickly pile up their debt burden. An overheated property market could be another source of risk. For example, both demand and supply for housing loans may be sustained by overoptimistic expectations about property prices, liberal valuation of housing collateral and high loan-to-value ratios, exposing households and banks to a 29 downturn in property prices. In Hong Kong, for example, a decline in property prices of over 50% between 1997 and 2001 reduced the market value of property for a number of households below their outstanding mortgage debt. This was followed by a collapse of household lending. Several countries have recently seen large increases in property prices in real terms (Graph 7). In China, a sharp rise in bank credit to the real estate sector during 2002 and 2003 was accompanied by strong increases in property prices in several major cities (particularly Shanghai), triggering regulatory restrictions on bank lending. In Thailand, both residential and commercial house prices surged in 2003 with a rise in the share of real estate loans in total bank loans. Graph 7 Real house prices1 180
130 Hong Kong SAR Singapore South Africa
160
China Korea Indonesia Malaysia Colombia Hungary
140
120 110
120
100
100
90
80
2000 1
2001
2002
2003
2004
2005
2000
2001
2002
2003
2004
2005
80
2001 Q4 = 100. Deflated by year-on-year change in consumer prices. Definitions may differ across countries.
Sources: Jones Lang Lassalle; CEIC; national data.
Yet another potential vulnerability could stem from possible under-assessment of risks by banks while lending to households. Excess liquidity, competition in retail loan markets and the strong income growth seen recently in many countries could lead to procyclical lending behaviour, whereby banks ease lending standards by either charging excessively low interest rates or reducing collateral requirements to attract customers. In many countries, for instance, mortgage lending rates have been lower than the best or prime lending rate charged to corporate borrowers. While this may reflect a better collateral assessment of residential property, questions remain about whether such low rates accurately compensate for all possible risks. The fact that easier credit standards have coincided with strong household demand for bank loans has led to a reinforcing cycle of higher loan demand and growing risk concentration in banks in Poland. In this regard, Pruski and Żochowski in this volume discuss increased challenges to authorities in maintaining financial stability in the context of Poland.
29
28
Collyns and Senhadji (2002), for example, show the working of this mechanism in the build-up of pre-1997-98 Asian asset market bubble. In the industrial country context, Tsatsaronis and Zhu (2204) show that the risk of mutually reinforcing cycle of bank lending and property prices is higher when bank lending is highly dependent on collateral values.
BIS Papers No 28
Appendix 1 Panel model for private sector credit The panel is estimated using data for 21 countries from 1999 to 2004. The countries are Argentina, Brazil, Chile, China, Colombia, the Czech Republic, Hungary, India, Indonesia, Israel, Korea, Malaysia, Mexico, Peru, the Philippines, Poland, Russia, South Africa, Thailand, Turkey and Venezuela. The model is initially estimated using linear least squares for the entire pool of countries. The starting model is M0, which regresses changes in private bank credit on: (i) the output gap (GAP), (ii) changes in real per capita income (PPPYHEAD) in the previous period (a proxy for expected future income); (iii) non-performing loans of banks as a percentage of total assets (NPL), (iv) the real short-term interest rate (MR-PCH), (v) changes in the banking system’s loanable funds defined as banks’ total liabilities minus their capital and reserves, 30 and (vi) operating costs as a percentage of total assets. Excepting the output gap, the non-performing loan ratio, the real interest rate and operating costs, all variables are measured in the first difference logarithmic terms. Table A Impact on bank credit1 With constant and 2 no CFE Variable
With CFE
M0
M1
M2
M3
M4
GAP
1.28 (5.37)**
1.17 (6.99)**
1.15 (6.84)**
1.05 (5.91)**
1.04 (5.92)**
DLOG(PPPYHEAD(−1))* 100
0.76 (5.13)**
0.35 (2.72)**
0.37 (2.93)**
0.19 (1.51)
0.27 (2.26)*
–3.67 (–6.36)**
–3.93 (–4.27)**
–3.78 (–4.12)**
–3.88 (–4.49)**
–3.79 (–4.31)**
0.29 (4.39)**
0.26 (4.00)**
0.27 (4.38)**
0.32 (5.80)**
0.32 (7.41)**
LOG(NPL(–1)) DLOG(LF/CPI)*100 (MR–@PCH(CPI))
–0.06 (–0.90)
–0.25 (–3.07)**
–0.25 (–3.21)**
–0.16 (–1.96)
–0.17 (–2.22)*
D(OC(–1))
–1.24 (–1.69)
–2.12 (–2.56)*
–1.88 (–2.30)*
–3.27 (–4.20)**
–2.75 (–3.58)** 0.09 (3.28)**
0.09 (1.62)
DLOG(TTD(–1))*100 DLOG(CG/CPI)*100
–0.06 (–2.27)*
–0.05 (–2.03)*
R2
0.68
0.85
0.85
0.87
0.89
DW
1.16
2.04
2.02
2.02
1.97
1
The dependent variable is the percentage change in real bank credit to the private sector. The model is estimated through 2 panel regression allowing for heteroscedasticity across countries. CFE = country-specific fixed effect. *,** denote coefficients significantly different from zero at the 5% and 1% level, respectively. In parenthesis, t-statistics. Source: BIS estimates.
However, the individual residual means and variances revealed a great degree of heterogeneity across countries. To capture differences across countries we estimated the same model with country-specific fixed effects allowing for group-wise heteroscedasticity in model M1. In functional form: yi = Xi β + iα i + ε i where i is a column of ones and where the off diagonal terms of the general covariance matrix are restricted to zero. In the estimated model, all coefficients are significantly different from zero with
30
This follows the concept used by Ghosh and Ghosh (1999).
BIS Papers No 28
29
unbiased residuals across countries (see the attached graph). Hence model M1 becomes the benchmark model for further analyses. To test the significance of other variables the model is augmented in subsequent estimation by including changes in the terms of trade (TTD) and real bank credit to the government sector (CG). RES ID AR
BR
CL
8
1.5
3
6
1.0
2
0.5
4
1
0.0 2
0 -0.5
0
-1
-1.0
-2
-1.5
-4
-2.0 1999
2000
2001
2002
2003
2004
-2 -3 1999
2000
CN
2001
2002
2003
2004
1999
CO 8
20
4
6
10
2
4
0
0
2
-10
-2
0
-20
-4
-2
-30
-6
-4 2000
2001
2002
2003
2004
2001
2003
2004
2002
2003
2004
2002
2003
2004
2003
2004
2003
2004
2002
2003
2004
2002
2003
2004
-40 1999
2000
2001
HU
2002
2003
2004
1999
2000
2001
ID
12
2002
CZ
6
1999
2000
IL
20
4
10
3
8
2
0
1 4
-10 0 -20
-1
0 -30 -4
-2
-40 1999
2000
2001
2002
2003
2004
-3 1999
2000
IN
2001
2002
2003
2004
1999
2000
KR
2
2001
MX
8
6
6 1
4
4 2
0
2
0 -1
0
-2 -4
-2
-2
-6 -3
-8 1999
2000
2001
2002
2003
2004
-4 1999
2000
MY
2001
2002
2003
2004
1999
2000
PE
4
12
2
8
0
4
2001
2002
PH 3 2 1 0
-2
0
-4
-4
-1 -2 -3 -4 -5
-6
-8 1999
2000
2001
2002
2003
2004
-6 1999
2000
PL
2001
2002
2003
2004
1999
2000
2001
RU
6
12
4
2002
TH 15 10
8
2
5 4
0
0 0
-2
-5 -4
-4 -6
-10
-8 1999
2000
2001
2002
2003
2004
-15 1999
2000
TR
2001
2002
2003
2004
1999
2000
2001
VE
15 10
ZA
20
16
15
12
10
8
5
4
5 0 -5 -10
0
0
-5
-4
-15 -20 -25
-10 1999
30
2000
2001
2002
2003
2004
-8 1999
2000
2001
2002
2003
2004
1999
2000
2001
BIS Papers No 28
Graph A1 Actual and trend bank credit to the private sector1 Argentina
40
Level Trend
Brazil
100
Chile
90
80
80
60
70
40
60
20
50
30
20
1985
1990
1995
2000
Colombia
10 2005 25
1985
1990
1995
2000
0 2005
Mexico
40
1985
1990
1995
2000
Peru
40 2005 30 25
20
30 20 15
15
20 10
1985
1990
1995
2000
Venezuela
10 2005 40
1985
1990
1995
2000
10 2005
China
160
1985
1990
1995
2000
India
40
140
30
5 2005
35
120 20
30 100
10
1985
1990
1995
2000
Hong Kong SAR
0 2005 180
25
80
1985
1990
1995
2000
60 2005
Korea
100
1985
1990
1995
2000
Indonesia
20 2005 80
170
60 80
160 40 150 60 20
140
1985 1
1990
1995
2000
130 2005 1985
1990
1995
2000
40 2005
1985
1990
1995
2000
0 2005
As a percentage of GDP. Trend based on a HP filter applied to annual data.
Sources: IMF; BIS calculations.
BIS Papers No 28
31
Graph A1 (cont) Actual and trend bank credit to the private sector1 Malaysia
120
Philippines
60
Level Trend 100
Singapore
130
50
120
40
110
30
100
20
90
80
60
1985
1990
1995
2000
Thailand
40 2005 140
1985
1990
1995
2000
10 2005
Hungary
60
120
1985
1990
1995
2000
Poland
80 2005 30
50 20
100 40 80 10 30
60
1985
1990
1995
2000
Russia
40 2005 30
1985
1990
1995
2000
20 2005
Turkey
30
25
1985
1990
1995
2000
Saudi Arabia
0 2005 40 35
25
20
30 20
15
25 15
10
1985
1990
1995
2000
South Africa
5 2005
1985
1990
1995
2000
10 2005
20
1985
1990
1995
2000
15 2005
90
80
70
60
1985 1
1990
1995
2000
50 2005
As a percentage of GDP. Trend based on a HP filter applied to annual data.
Sources: IMF; BIS calculations.
32
BIS Papers No 28
Table A1 Real aggregate credit1 Share in aggregate credit Average growth rate
Other banks and non-bank financial institutions
Commercial banks
1995-99
2000-04
1994
1999
2004
1994
1999
2004
Latin America Argentina Brazil Chile Colombia Mexico Peru Venezuela
8.5 12.3 9.3 3.5 –13.1 19.8 –5.2
–2.7 4.6 5.3 1.5 9.2 –4.1 10.6
93 86 96 50 58 95 89
94 71 99 55 47 99 87
97 61 100 88 43 99 99
5 14 4 50 42 5 11
6 29 1 45 53 1 13
3 39 0 12 57 1 1
Asia China India Hong Kong SAR Singapore Indonesia Korea Malaysia Philippines Thailand
17.1 6.1 –4.1 11.3 –15.8 4.4 10.4 9.7 1.8
13.3 14.6 2.2 5.7 5.8 7.2 4.6 3.2 –0.5
100
100
100 97 100 92
0
0
0 3 0 8
49 69 84 70
57 75 92 79
62 87 92 76
51 31 16 30
43 25 8 21
38 13 8 24
92
100 92 96
98 93 74
0
0 8 4
2 7 26
52 46 90
58 48 95
70 56 97
48 54 10
42 52 5
30 44 3
23 47
17
18
77
83
82
Central Europe Czech Republic Hungary Poland
0.0 12.6
15.1 9.2
Israel Russia Saudi Arabia South Africa Turkey
5.7 1.5 4.9 6.9 11.0
4.2 16.8 8.1 6.1 8.8
Memo: United States Japan Euro area
10.1 –12.7 7.3
3.4 0.5 3.0
1
Referring to domestic credit to non-banks of commercial banks, other banks (excl central banks) and non-financial institutions (questionnaire) or, if not available, IMF, deposit money banks, (l.22, IFS) and other banking and non-bank financial institutions (l.42, IFS); deflated using annual percentage changes of the consumer price index. Sources: IMF; national data.
BIS Papers No 28
33
Table A2 Sources of finance in emerging markets1 Domestic bank credit
Domestic debt securities outstanding
Stock market capitalisation
Memo: International financing2
As a percentage of GDP 1999
2005
1999
2005
1999
2005
1999
2005
31 56 60 28 35 26 15
38 62 77 41 28 17 12
15 55 45 16 12 6
14 74 44 37 30 11
30 42 93 13 32 26 8
36 61 139 42 34 47 4
41 22 32 21 28 17 30
52 16 30 19 16 16 28
Asia China India Hong Kong SAR Singapore Indonesia Korea Malaysia Philippines Thailand
130 51 154 87 59 81 161 62 133
169 65 153 67 45 97 135 50 94
22 23 27 44 32 60 84 30 26
33 41 28 64 19 91 90 42 48
33 42 336 196 42 69 184 63 48
39 68 448 158 28 82 139 41 67
3 4 31 20 22 14 23 32 19
3 5 55 55 9 12 31 44 11
Central Europe Czech Republic Hungary Poland
50 43 35
41 52 39
41 34 17
59 49 40
22 34 18
31 30 37
7 37 9
18 47 24
Israel Russia Saudi Arabia South Africa Turkey
84 31 44 69 39
84 22 47 77 59
38
72
5
4 144 197 62
153 223 44
11 16 10 11 23
16 12 5 10 22
Memo: United States Euro area Japan
80 122 161
92 154 150
150 74 104
112 59 94
23
45
7
9
Latin America Argentina Brazil Chile Colombia Mexico Peru Venezuela
51 24
49 61
150
163
134
200
1
End of period; for 2005, latest available data extrapolated, if necessary. reporting banks and international debt securities outstanding.
2
Non-bank cross-border liabilities to BIS
Sources: IMF; International Finance Corporation; Datastream; BIS statistics.
34
BIS Papers No 28
Table A3 Real bank credit to the private sector1
Latin America Argentina Brazil Chile Colombia Mexico Peru Venezuela Asia India Hong Kong SAR Singapore Indonesia Korea Malaysia Philippines Thailand Central Europe Czech Republic Hungary Poland
1990-94
1995-99
2000
2001
2002
2003
2004
2000-04
20052
18.8 24.3 10.4 10.0 27.6 49.3 –18.9
5.7 0.9 8.8 5.2 –11.7 21.1 6.0
–3.1 –1.8 8.0 –4.3 –1.4 –6.8 11.7
–16.5 1.3 4.8 3.4 –13.6 –4.3 6.4
–38.1 –0.8 6.1 4.4 17.7 –2.0 –25.9
–18.5 4.1 4.5 2.3 –5.7 –7.0 –12.3
8.8 4.4 11.2 6.2 3.0 –3.7 75.1
–15.0 1.4 6.9 2.3 –0.5 –4.8 6.2
20.4 19.7 15.1 13.3 12.0 9.7 61.5
3.9 5.0 10.3 9.7 9.0
6.9 –4.5 9.6 12.3 –12.9 12.6 12.3 3.5
15.9 –4.5 3.8 15.4 8.3 4.6 –0.5 –16.9
3.9 –1.4 17.0 10.8 –2.0 5.2 –3.7 –10.2
17.8 3.4 –9.0 16.3 8.1 3.0 –0.7 14.4
5.7 3.4 4.7 5.3 13.1 3.1 2.8 4.7
25.8 6.9 3.1 –1.6 19.0 25.0 0.4 2.7
13.5 1.5 3.6 9.0 9.1 7.9 –0.4 –1.7
30.0 –6.3 2.4 1.5 24.5 12.2 –1.3 0.6
–1.2 2.9 14.6
–10.5 19.4 7.9
–24.3 3 9.1 3.7
–9.2 12.4 2.5
7.1 24.5 6.4
13.0 11.9 –0.4
–5.7 3 15.3 4.0
19.8 2.0 5.1
12.4 27.7 6.5 7.7 15.7
9.1 25.2 7.8 17.0 –31.1
–5.3 13.8 9.3 –6.6 –0.4
–1.4 27.7 16.3 26.0 15.7
–9.5 31.3 34.1 7.0 40.4
0.7 25.0 14.4 9.7 5.2
–7.8 31.3 24.4 11.7 20.3
7.8 –1.2 7.9 9.8
2.5 –1.1 5.8 9.7
2.4 –4.7 1.7 17.7
6.4 –3.6 3.6 17.0
6.5 –2.4 4.1 8.6
5.1 –2.6 4.6 12.5
10.9 –0.8 8.5 9.4
12.2 19.2
–15.6
Israel Russia Saudi Arabia South Africa Turkey
9.1
4.5 –0.8
0.8 –6.6 4.0 7.6 8.2
Memo: United States Japan Euro area China4
0.4 0.2 2.4 10.6
5.6 0.5 5.5 16.0
1
Annual changes, in per cent; referring to commercial banks (questionnaire). Where data were not available from the 2 Latest available data extrapolated until questionnaire, they have been taken from IMF, deposit money banks, l.22c+d. 3 end-2005, if necessary. Affected by bank restructuring (the Czech Consolidation Bank was removed from the banking 4 system). Credit to the non-government sector. Sources: IMF; national data.
BIS Papers No 28
35
Table A4 Structural bank indicators Non-performing loans1
Capital asset ratio2
Operating costs3
1999
2004
1999
2004
1999
2004
14.1 10.0 7.7 5.5 2.8
18.9 2.7 3.0 2.0 1.8 0.6
19.7 15.5 10.8 16.0 12.0 13.3
12.3 18.2 14.0 14.1 14.2 12.5
4.9 7.4 10.3 5.6 5.8 10.2
4.5 6.1 6.0 4.4 4.7 6.3
Asia China India Hong Kong SAR Singapore Korea Indonesia Malaysia Philippines Thailand
19.0 6.1 7.2 7.2 9.2 6.6 8.5 12.3 32.4
6.0 3.3 2.1 2.6 1.8 1.8 6.4 12.7 8.5
11.3 17.8 20.9 12.0 –6.7 12.8 15.74 12.4
12.9 15.4 16.1 11.8 20.9 14.3 18.4 13.1
1.3 2.4
1.1 2.3
1.6 2.8 1.7 3.3 2.1
1.5 3.2 1.5 3.1 2.0
Central Europe Czech Republic Hungary Poland
14.4 2.0 6.0
1.4 2.4 7.7
13.6 15.0 13.2
12.6 13.2 15.4
3.6 5.7 4.3
2.4 4.3 3.7
1.0 0.9 3.0 2.1
9.4 18.1 21.2 7.0
10.8 17.0 18.0 26.2
2.2 6.8
2.4 3.9
5.8
4.1
Latin America Argentina Brazil Colombia Mexico Peru Venezuela
Israel Russia Saudi Arabia Turkey
1.0 2.2 9.15 3.3
1
Of commercial banks; as a percentage of total commercial bank assets; for Argentina, as a percentage of total financing; for Brazil, Peru, China, Indonesia, the Czech Republic, Poland and Russia, referring to the major banks, and, for the 2 Philippines and Saudi Arabia, banks’ non-performing loans as a percentage of total bank loans. Bank regulatory capital as 3 4 5 a percentage of risk-weighted assets. As a percentage of total assets. Referring to 2001. Referring to 2000. Sources: Fitch; IMF, Global Financial Stability Reports; national data (questionnaire).
36
BIS Papers No 28
References Agénor, Pierre-Richard, Joshua Aizenman and Alexander Hoffmaister (2000): “The credit crunch in East Asia: what can bank excess liquid assets tell us?”, Policy Research Working Paper, 2483, The World Bank. Allen, Mark, Christoph Rosenberg, Christian Keller, Brad Setser and Nouriel Roubini (2002): “A balance sheet approach to financial crisis”, IMF Working Paper, wp/02/210. Bacchetta, Philippe and Stefan Gerlach (1997): “Consumption and credit constraints: international evidence”, Journal of Monetary Economics, 40, 207-38. Bank for International Settlements (2005): 75th Annual Report. Barajas, Adolfo and Roberto Steiner (2002): “Credit stagnation in Latin America”, IMF Working Paper, wp/02/53. Barth, James R, Gerard Caprio Jr and Ross Levin (2002): “Financial regulation and performance: cross-country evidence”, in Leonardo Hernández and Klaus Schmidt-Hebbel (eds), Banking, financial integration, and international crisis, Central Bank of Chile, Santiago, 113-41. Beck, Thorsten, Asli Demirgüç-Kunt and Vojislav Maksimovic (2003): ”Bank competition, financing obstacles and access to credit”, Policy Research Working Paper, 2996, The World Bank. Belaisch, Agnes (2003): “Do Brazilian banks compete?”, IMF Working Paper, wp/03/113. Bernanke, Ben S and Mark Gertler (1995): “Inside the black box: the credit channel of monetary policy transmission”, Journal of Economic Perspectives, 9 (4), 27-48. Bernanke, Ben S and Cara S Lown (1991): ”The credit crunch”, Brookings Papers on Economic Activity, 2, 205-46. Borio, Claudio and William White (2004): “Whither monetary and financial stability? The implications of evolving policy regimes”, BIS Working Paper, no 147. Braun, Mátias and Ricardo Hausmann (2001): “Financial development and credit crunches: Latin America and the World”, mimeo, Harvard University. Calvo, Guillermo A (1998): “Capital flows and capital-market crises: the simple economics of sudden stop”, Journal of Applied Economics, 1, 35-54. Cespedes, Luis, Roberto Chang and Andres Velasco (2000): “Balance sheets and exchange rate policy”, NBER Working Paper, 7840. Colllyns, Charles and Abdelhak Senhadji (2002): ”Lending booms, real estate bubbles and the Asian crises”, IMF Working Paper, wp/02/20. Committee on the Global Financial System (2005): “Housing finance in the global financial market”, CGFS publication No. 26 (January), Bank for International Settlements, Basel. Cottarelli, Carlo, Giovanni Dell’Ariccia and Ivanna Valdkova-Hollar (2003): “Early birds, late risers, and sleeping beauties: bank credit growth to the private sector in central and eastern Europe and the Balkans”, IMF Working Paper, wp/03/213. Dages, B, Linda Goldberg and Daniel Kinney (2000): “Foreign and domestic bank participation in emerging markets: lessons from Mexico and Argentina”, Economic Policy Review, September, Federal Reserve Bank of New York, 17-36. Debelle, Guy (2004): “Household debt and the macroeconomy”, BIS Quarterly Review, March. Dell’Ariccia, Giovanni, Enrica Detragiache and Raghuram Rajan (2005): “The real effects of banking crises”, IMF Working Paper, wp/05/63. Demirgüç-Kunt, Asli and Enrica Detragiache (2005): “Cross-country empirical studies of systemic bank distress”, Policy Research Working Paper, 3719, The World Bank. Detragiache, Enrica and Poonam Gupta (2004) : “Foreign banks in emerging market crises: evidence from Malaysia”, IMF Working Paper, wp/04/129. Djankov, Simeon, Caralee McLiesh and Andrei Shleifer (2005): “Private credit in 129 countries”, NBER working Paper, 11078, January.
BIS Papers No 28
37
Domanski, Dietrich (2005): “Foreign banks in emerging market economies: changing players, changing issues”, BIS Quarterly Review, December. Galindo, Arturo and Fabio Schiantarelli (2003): “Determinants and consequences of financial constraints facing firms in Latin America: an overview”, in Arturo Galinda and Fabio Schiantarelli (eds), Credit constraints and investment in Latin America, Inter-American Development Bank, Washington DC. Ghosh, Swati R and Atish R Ghosh (1999): “East Asia in the aftermath: was there a crunch?”, IMF Working Paper, wp/99/38. Glen, Jack and Ajit Singh (2003): “Capital structure, rates of return, and financing corporate growth: comparing developed and emerging markets, 1994-2000”, in Robert Litan, Michale Pomerleano and V Sunderarajan (eds), The future of capital markets in developing countries, Brookings Institutions Press, Washington DC, 373-415. Goldfajn, Ilan, Ketherine Hennings and Helio Mori (2004): “Brazil’s financial system: resilience to shocks, no currency substitution, but struggling to promote growth”, Working Paper Series, 75, Banco Central do Brasil. Gourinchas, Pierre-Olivier, Rodrigo Valdés and Oscar Landerretche (2001): “Lending booms: Latin America and the world”, NBER Working Paper, 8249, April. Gyntelberg, Jacob, Guonan Ma and Eli M Remolona (2005): “Corporate bond markets in Asia”, BIS Quarterly Review, December, 83-93. Hernández, Leonardo and Oscar Landerretche (2002): “Capital inflows, credit boom and macroeconomic vulnerability: the cross-country experience”, in Hernández and Schmidt-Hebbel (eds), Banking, financial integration and international crises, Central Bank of Chile, 199-233. Inter-American Development Bank (2002), “Unlocking credit: the quest for deep and stable bank lending”, Chapter 10, Washington DC. International Monetary Fund (2004a): “Are credit booms in emerging markets a concern?”, World Economic Outlook, Chapter IV, April, 147-65. ——— (2004b): “Emerging markets as net capital exporters”, Global Financial Stability Report, Chapter IV, September, 121-59. ——— (2005): “Corporate finance in emerging markets”, Global Financial Stability Report, April, 92-132. Jappelli, Tullio and Marco Pagano (2002): “Information sharing, lending and defaults: cross-country evidence”, Journal of Banking and Finance, 26, 2017-45. Jeanneau, Serge and Carlos Pérez Verdia (2005): “Reducing financial vulnerability: the development of the domestic government bond market in Mexico”, BIS Quarterly Review, December, pp 95-107. Kuijs, Louis (2005): “Investment and saving in China”, Policy Research Working Paper, 3633, The World Bank. Lim, Youngjae (2003): “Sources of corporate financing and economic crisis in Korea: a microevidence”, NBER Working Paper, 9575, March. Liping, He and Fan Gang (2002): “Consumer finance in China: recent development trends”, China and World Economy, 6, 12-17. Mendoza, Enrique G (1995): “The terms of trade, the real exchange rate, and economic fluctuations”, International Economic Review, 36 (1), 101-37. Mohan, Rakesh (2002): “Transforming Indian banking: in search of a better tomorrow”, valedictory address delivered at Bank Economists’ Conference, Bangalore, December 29, www.rbi.org. Montiel, Peter J (2000): “What drives consumption booms?”, World Bank Economic Review, 14(3), September, 457-80. Rajan, Raghuram and Luigi Zingales (1998): “Financial dependence and growth”, American Economic Review, 88 (3), 559-86.
38
BIS Papers No 28
Rath, Dilip, Philip Suttle and Sanket Mohapatra (2003): “Corporate financing patterns and performance in emerging markets”, in Robert Litan, Michale Pomerleano and V Sunderarajan (eds), The Future of Capital Markets in Developing Countries, Brookings Institutions Press, Washington DC, 417-55. Singh, Anoop, Agnes Belaish, Chares Collyns, Paula de Masi, Reva Kriger, Guy Meredith, and Robert Rennhack (2005): “Stabilisation and reforms in Latin America: a macroeconomc perspective on the experience since the early 1990s”, Occasional Paper, 238, International Monetary Fund. Stevens, G.R (1997): “Some observations on low inflation and household finances”, Reserve Bank of Australia Bulletin, October, 38-47. Tovar, Camilo E (2005): “International government debt denominated in local currency: recent developments in Latin America”, BIS Quarterly Review, December, pp 109-18. Tornell, Aaron and Frank Westermann (2002): “Boom-bust cycles in middle-income countries: facts and explanation”, IMF Staff Papers, 49, 111-55. Tsatsaronis, Kostas and Haibin Zhu (2004): “What drives housing price dynamics: cross country evidence”, BIS Quarterly Review, March. Yun, Seong-Hun (2004): “Impact of direct regulations on the Korean credit card market and consumer welfare”, Economic Papers, 7 (1), Bank of Korea, 141-59.
BIS Papers No 28
39
Privatisation, consolidation and the increased role of foreign banks Dubravko Mihaljek 1
Introduction This paper discusses three major structural changes - privatisation, consolidation and an increased role of foreign banks - that have been taking place in banking systems of emerging market economies, focusing on the period since 2000. It assesses, on the basis of standard indicators, how far the banking systems studied have increased intermediation efficiency as a result of these changes. In this regard the paper looks at both the productive efficiency of the banking industry itself and some aspects of allocative efficiency, focusing on changes in the composition of lending to different sectors of the economy. The issues of dynamic efficiency - the impact of changes in banking systems on economic growth and financial stability - are not discussed. The paper also identifies some challenges that the evolving banking structure might create for market discipline and supervisory oversight. When these issues were last discussed at a meeting of deputy governors in 2000, many emerging market economies were still recovering from financial crises of the second half of the 1990s (Hawkins and Mihaljek (2001)). Deregulation of financial services at the national level and opening-up to international competition were just beginning. Although privatisation was well advanced in central Europe and Latin America, many state-owned banks in these regions as well as Asia had yet to be privatised. The global financial industry was in the midst of an unprecedented boom in the use of information technology. Changes in corporate behaviour such as the growing use of debt markets and increased emphasis on shareholder value were also beginning to spread worldwide. Changes in the structure of the banking industry that have taken place over the past five years are important but perhaps less spectacular than what was expected in December 2000. Trends in privatisation, consolidation and the increased role of foreign-owned banks have continued, but the banking systems in many countries - particularly large Asian economies - have yet to be integrated fully with the global financial system. Improvements in the efficiency of intermediation have been more uniform, suggesting that benefits to industry and consumers from greater competitive pressure in banking have been widespread. But questions continue to be raised about the effectiveness of banking systems in Asian countries with high saving rates in steering funds towards the most productive uses from the global economy perspective (Bernanke (2005), Clarida (2005)). Banks in many Asian and central European economies have shifted lending from the public sector and corporations towards households and smaller firms, but in some Latin American countries the share of bank credit to the government has actually increased. The paper is organised as follows. Section 1 reviews broad changes in the structure of banking systems in emerging market countries since 2000, focusing on trends in privatisation and bank consolidation. Section 2 looks at the effects of these changes on the composition of bank lending and on bank efficiency. Section 3 concludes with a discussion of some policy challenges facing central banks and supervisory authorities in this new environment.
1.
Structural changes in the banking sector since 2000
Structure of the banking system Two main elements of the structure of banking systems that are considered in this section are the degree of government versus private domestic or foreign ownership of banks, and trends in
1
The author thanks David Archer, Philip Turner and Bill White for valuable comments, and Marc Klau for help with the data.
BIS Papers No 28
41
consolidation in the banking industry. There is a large literature on benefits and costs associated with privatisation and foreign ownership of banks in emerging market economies. 2 In general, studies suggest that productive, allocative and dynamic efficiency tend to be lower in banking systems dominated by state-owned banks, while privatisation and an increased role of foreign banks helps to improve at least some aspects of efficiency. There has been less research on bank consolidation in emerging market economies, partly because the relevant problem in many banking systems is excess fragmentation rather than excess concentration (see below). Research on industrial countries suggests that concentration in banking plays a more complex role than would be suggested for traditional industries such as manufacturing and trade. Commercial banks retain a dominant role in providing credit in emerging market economies (see the paper by Mohanty et al in this volume). Outside Latin America and a few Asian economies, non-bank financial institutions supply negligible amounts of aggregate credit. 3 Within the banking sector, commercial banks provide on average 90% of total credit. This share has actually increased over the past five years, in particular in Latin America, but also in some crisis-hit countries in Asia, where many fringe financial intermediaries have collapsed. Deposit-taking institutions other than commercial banks play a more important role only in Korea, Malaysia and Thailand, where they supply roughly a quarter of total credit. Changes in the ownership structure of banks have been more significant. As indicated in Graph 1, the share of state-owned commercial banks in total bank credit has declined or remained stable in all emerging market regions since 1999. 4 Except in China, India and Indonesia, state-owned banks are no longer major providers of credit to the economy. The declining role of state-owned banks has been particularly pronounced in central Europe, where bank privatisations have essentially been completed. Graph 1 Commercial banks by type of ownership Share in total bank credit, in per cent 100 80
15
11
11
78
71
16
6
30
31
33
18
42
13
60
20
10
1
14
48
77
21
40 5
20 0
45 2
1
11 34
15
5 79
55
47
1994
1999
2004
Latin America
17
24
1999 2004 China and India
Private domestic banks
73
57
56
67
80
1994
1999
2004
1994
1999
Other Asia Foreign-owned banks
83
34
2004 1994
Other EMEs
33
13
1999
2004
Central Europe
State-owned banks
Source: National data (BIS questionnaire).
2
See, for example, the review article by Barth et al (2004).
3
Unless otherwise indicated, the country groupings used in this paper are as follows: Latin America (Chile, Colombia, Mexico and Venezuela); other Asia (Indonesia, Korea, Malaysia and Thailand); central Europe (Czech Republic, Hungary and Poland); and other emerging market economies (Israel, Saudi Arabia and Turkey).
4
The small increase in the share of state-owned banks in total credit in other Asia in 2004 is due entirely to Indonesia, where the majority of commercial banks that failed during the 1999 crisis were nationalised and subsequently gradually privatised.
42
BIS Papers No 28
There have also been major shifts in the relative importance of domestic and foreign private banks. Continuing a trend that was observed five years ago, since 1999 the share of private domestic banks has declined in Latin America and central Europe (to 60% and 13% of total bank credit, respectively) while that of foreign-owned banks has increased significantly. But in some Asian countries (Indonesia, Malaysia and Thailand) and other emerging market economies (Israel, Saudi Arabia and Turkey), there has been no further penetration of foreign-owned banks since 1999. In terms of total assets, the share of foreign ownership ranges from nil in Saudi Arabia to 96% in the Czech Republic. The share is higher in central Europe and Latin America, and lower in Asia, Israel, Saudi Arabia and Turkey; it also tends to be higher in smaller economies than in larger ones. Upper middle income countries (eg Chile, Hungary, Mexico, Malaysia and Poland) tend to have a higher proportion of foreign ownership of bank assets. Interestingly, foreign banks own about the same percentage of bank assets in many high-income economies (eg Israel and Korea) as in lower-income economies (eg India and Indonesia). Overall, these comparisons do not reveal a simple relationship between country characteristics and degree of foreign ownership of banking assets. Table 1 provides some preliminary evidence on the extent of bank consolidation. Since 1999, the number of commercial banks has increased only in China, Saudi Arabia and Colombia, while in other economies mergers, acquisitions and liquidations have resulted in a decrease in the number of banks ranging from 10 to 30%. Graph A1 in the Appendix reveals another common pattern: after an initial increase - for instance, in Hong Kong SAR, Indonesia, the Czech Republic and Poland during the first half of the 1990s - the number of commercial banks has subsequently retrenched. The number of bank branches has also decreased in most countries over the past five years; large expansions in branch networks have taken place only in Chile, Colombia and Malaysia. As indicated in the second column of Table 1, bank consolidation had already started in the mid-1990s, but at that time the branch network was still growing in most countries, in particular in Asia and Latin America. With few exceptions, this has also resulted in a decrease in the number of bank employees per branch (Graph 2). Given that economies in the sample differ widely in terms of market size and level of financial development, it is hard to generalise about the future direction of change in banking density. Table 1 Number of commercial banks and branches1 1990-94
1994-99
1999-2004
Country
Banks
Branches
Country
Banks
Branches
Country
Banks
Branches
Czech Rep Hong Kong SAR Indonesia Colombia Saudi Arabia Thailand Singapore Chile Turkey Venezuela Malaysia
511 132 43 19 0 –3 –6 –8 –8 –10 …
–41 … 22 … 18 … 12 23 –7 24 29
Thailand Mexico Singapore Venezuela Hungary Poland Malaysia Israel Korea Saudi Arabia Chile Turkey Colombia Czech Rep Hong Kong SAR Indonesia
17 13 8 8 –2 –6 –8 –13 –17 –17 –19 –19 –23 –24 –25 –33
35 60 35 18 … –16 47 –2 44 –2 15 14 –3 … 2 3
China Saudi Arabia Colombia Chile Thailand India Hungary Venezuela Czech Rep Korea Singapore Argentina Indonesia Mexico Israel Turkey Hong Kong SAR Malaysia Poland
92 20 13 –10 –12 –13 –15 –17 –17 –19 –19 –20 –21 –21 –23 –23 –27 –29 –30
… 2 20 10 2 4 –3 2 –11 –5 –38 –12 –5 –3 –10 –11 –17 11 –16
1
Change in the number of commercial banks/bank branches during period, in per cent.
Source: National data (BIS questionnaire). BIS Papers No 28
43
In sum, banking systems in emerging market economies have generally continued to evolve towards more private and foreign-owned structures, with fewer commercial banks and often smaller numbers of bank branches. As discussed below, in some countries these trends have been the result of postcrisis weeding-out of weak financial institutions, and mergers encouraged by the authorities under financial sector “master plans” (eg in Indonesia, Malaysia and Thailand). Elsewhere, these developments have been mostly market-driven (eg central Europe, Mexico). However, the pace of structural change has slowed compared with the second half of the 1990s. Three main reasons come to mind: first, banking crises have been less widespread - Argentina’s and Turkey’s crises being the only major ones after 2001. Second, the transition towards market-based systems had been largely completed in central Europe by the early 2000s. And third, in the favourable macroeconomic and financial environment that has prevailed over the past five years there has been less urgency to reform banking systems. Graph 2 Employees per commercial bank branch
160
143
140 120 100
1999
80
2004
55
60
Argentina
Turkey
Chile
Malaysia
Hong Kong SAR
India
0
15
15
15
12 Korea
20
Poland
21
Mexico
21
20
Colombia
23
Czech Rep
26
Thailand
39
40
Source: National data (BIS questionnaire).
Privatisation Since 2000 there have been 51 partial or full privatisations in the 19 emerging market countries studied in this paper (Table 2). The major privatisations took place in Indonesia, Korea, Thailand and central Europe. In Indonesia, 15 banks accounting for 70% of total banking sector assets were sold in initial public offerings by the bank restructuring agency between 2000 and 2004. The Korean authorities privatised four banks nationalised during the 1997-98 crisis, representing 18% of total banking sector assets at the time of privatisation (see the paper by the Bank of Korea in this volume). In Thailand, the authorities reduced their shareholdings in three out of five major domestic banks taken over by the Financial Institutions Development Fund during the 1997 crisis. The government still retains large holdings in three major domestic banks - including Krung Thai Bank, one of the largest in the country - and is waiting for favourable market conditions to sell these stakes. Privatisations have largely been completed in the Czech Republic and Hungary, but have yet to run their course in Poland. In the Czech Republic, the government sold holdings in two major banks (accounting for 38% of total banking sector assets in 2001) to strategic foreign investors in 2000-01. In Hungary, three smaller banks with a combined market share of 7% were sold in 2003. In both countries, government ownership is now restricted to special purpose institutions which provide support to exporters, small firms and municipalities (Czech Republic), or were set up to develop the mortgage bond market (Hungary). In Poland, the government sold 30% of shares in the country’s largest retail bank, PKO BP, at the Warsaw Stock Exchange in late 2004. However, the government still retains a majority stake in the bank.
44
BIS Papers No 28
Table 2 Commercial bank privatisations, 2000-05 Country
Number and main characteristics of privatised banks
Guarantees extended
Colombia
0 But privatisations initiated for 2 banks intervened in late 1990s
Yes
Mexico
2 smaller banks intervened in 1999 auctioned off in 2000 and 2001
Yes
Venezuela
0 Privatisations were carried out during 1992-98
China
India
Singapore Indonesia
14 joint stock commercial banks sold shares to foreign investors. No plans to initiate widespread privatisation, but shares of 2 state banks to be sold in public offerings 0
Yes
15 banks, accounting for 70% of total assets, sold in IPOs
Yes
4 banks nationalised during 1997-98 crisis sold through private placement, tender and auction
Yes
Thailand
3 large banks out of 5 taken over during 1997-98 crisis sold through public offering to strategic partners 2 major banks (38% of total assets) sold in 2000-01 through tender to strategic foreign investors 3 banks (7% of total assets) sold through public offerings, tender or auction 5 banks with majority or minority state ownership were partially privatised to domestic and foreign investors 1 bank set up in 1993 to implement priority investment projects 0 Initiated restructuring ahead of privatisation of 2 major banks
Yes
2 One small bank privatised; one major bank (16% of total assets) currently being privatised 0 Partial privatisations in 1980s and 1990s of banks rescued during the 1960s crisis
No
Hungary
Poland
Russia Turkey
Israel
Saudi Arabia
Implicit guarantees to depositors
0
Korea
Czech Republic
In the past; depositors, employees’ pensions Assets not adequately valued; hidden liabilities
Yes
Yes
No
Guarantees to depositors; gradually reduced Deposits; bad loans; contingent liabilities (subject to limit; none in some cases) Limited compensation for NPL losses Impaired assets guaranteed or transferred to a special purpose entity Impaired assets; contingent liabilities Employment guarantee schemes (2-3 years) as part of privatisations
Residual state ownership 3 banks acquired during crisis in late 1990s None; minority holdings in previous privatisations 2 state-owned banks; no privatisation plans 1 failed bank taken into state ownership in 2000 Majority state holding of shares in all major banks; plans to reduce shareholdings in the long run 28 public sector banks; government shareholding cannot fall below 51% Less than ⅓ shareholding in former development bank Minority ownership in a number of banks; to be sold Plan to sell 32% in one major bank; privatise holding company with 4 state bank subsidiaries Holdings (incl majority) in 3 major banks, waiting for market opportunity to sell 2 special purpose banks (state support of exporters, small firms, municipalities) Residual shares in several banks (mostly small); full share in mortgage bank 1 fully owned state bank; 1 major and 3 smaller banks with majority share; 8 banks with minority share State ownership in banking sector remains dominant 12 banks taken over during 2001 crisis; 11 since sold, merged or liquidated Plans to privatise major state-owned bank (30% of total assets) Shareholdings of 10-80% in 4 out of 11 domestic banks; held largely by 3 govt funds as passive investors
Note: There were no privatisations in Chile, Hong Kong SAR or the Philippines. Source: Central bank answers to BIS questionnaire. BIS Papers No 28
45
Elsewhere, progress in privatisation has been mixed. The authorities in China are focusing on four large state-owned banks, which control 60% of the market. The goal is to diversify their ownership rather than privatise the banks. Since 2003, three state-owned banks have become joint stock companies in preparation for partial privatisation. The authorities have exposed their non-performing loans and allowed foreign strategic investors to buy shares. Bank of Construction has been listed on the Hong Kong Stock Exchange, while Industrial Bank and Bank of China could be listed in 2006. As with the large state-owned banks, one goal of reform with respect to other joint stock banks with part local government, part private ownership is to expand foreign ownership and participation in management. Presently, 17 joint stock banks have 22 foreign strategic investors and a large number of foreign professionals work in these banks (see the contribution by The People’s Bank of China in this volume). Another important area for China is cooperative banks. As 60% of the population lives from agriculture, China has over 30,000 credit cooperatives. The government has invested large sums of money in restructuring with a view to ensuring that cooperative banks become profitable, commercially oriented and founded on mixed ownership. In India, no state-owned commercial bank has been privatised since 2000, nor are there any plans for divesting government shareholdings. India’s 28 public sector banks account for 80% of total commercial bank credit and by law the government’s shareholding in these banks cannot fall below 51%. There is a new roadmap for opening up the banking sector which envisages a greater role for foreign banks after 2009, by which time the consolidation process of domestic banks is expected to be completed. Russia privatised one state-owned bank in the period under review, in June 2005. The government’s strategy for the banking sector does not set out any significant steps to reduce the dominance of stateowned banks (Lohmus and Teo (2005)). Russia’s largest bank, Sberbank, accounts for 28% of total banking sector assets, 42% of total deposits and 30% of credit to the economy. The gradual decline in Sberbank’s dominance - its share in total household deposits declined from 75% in 2000 to 60% in 2004 - has been offset by the expansion of other state-controlled banks. The Turkish authorities have initiated restructuring of two state banks which they plan to privatise in 2006. The only privatisations in the four Latin American countries for which data are available are those of two smaller banks in Mexico, which were acquired during rescues in 1999. As in the 1990s, the primary motive for privatisations over the past five years has been to sell the stakes held by the government to investors with the skills and experience necessary to complete the restructuring of banks and transform them into viable business-oriented organisations. More specifically, governments of emerging market economies have generally wanted to strengthen banks’ capital and overall stability, increase their profitability and competitiveness, broaden the range of products and services offered and increase the overall efficiency of financial intermediation. Considering the huge fiscal costs of banking crises in the 1990s, many governments also wanted to limit the size of any potential future intervention in the banking system. Regarding privatisation methods, in the late 1990s impaired assets of many banks nationalised during the crisis in Asia were disposed of by asset management companies, while in central Europe and Latin America state-owned banks were often sold to strategic foreign investors. By contrast, during 2000-04 several different methods were used, including the sale of shares through initial and subsequent public offerings; sale of shares through tender or auction; and, in some cases, sale of shares through private placement, often to strategic investors. These changes in privatisation methods have reflected normalisation of the banking industry after the crises and, in central and eastern Europe, the completion of the systemic transformation towards a market-based economy in the late 1990s. So far, there have been no comprehensive analyses of net costs of bank rescues and privatisations for 5 taxpayers. Cost-benefit considerations seem to be largely absent when banks are rescued during systemic crises. Limited evidence from individual bank cases suggests that, even under the best of circumstances - a rescue quickly followed by successful privatisation - the net costs are very large, which perhaps explains why governments prefer not to know exactly how much money taxpayers lose when the state restructures and recapitalises distressed banks before selling them to new owners. 6
5
On aggregate costs of banking crises see eg Honohan and Klingebiel (2001) and Sherif (2004).
6
One well documented case is the rescue of Hungary’s Postabank in 2000. The rescue cost the state around HUF 150 billion (about EUR 580 million), and the bank was sold for HUF 100 billion at end-2003, implying a net loss of 33%. Another
46
BIS Papers No 28
Several central banks observed in this context that recapitalisation rarely solved banks’ problems, but many governments nonetheless saw it as necessary because banks could not have otherwise found strategic partners. With the exception of Israel and Poland, governments extended guarantees to depositors in privatised banks and to purchasers of state-owned banks, covering various impaired assets and contingent liabilities. In many countries, limits on guaranteed deposits were reduced over time and guarantees for contingent liabilities were subject to a ceiling. As already indicated, the public sector still has a major residual role in many emerging market banking systems, in particular in large economies such as China, India and Russia. Expectations expressed in Hawkins and Mihaljek (2001) that this role would diminish relatively quickly have proved to be overly optimistic. Outside of central Europe, Mexico, Hong Kong and Singapore, policymakers in many countries apparently still see a useful role for state-owned commercial banks, not just in serving customers in remote areas or certain types of customers (farmers, small firms), but more generally, as necessary for socio-economic development. In view of the strong conclusions reached in the empirical literature on the inefficiency of using state ownership of banks as a social and development tool, why such perceptions are still held remains an open question. As discussed below, one reason might be that the remaining state-owned commercial banks have been subjected to greater market discipline and have become less inefficient than in the past.
Consolidation In the late 1990s, the banking systems of many emerging market economies were highly fragmented in terms of the number and size of institutions, ownership patterns, profitability and competitiveness, use of modern technology, and other structural features. Very often, three or four large commercial banks coexisted with a large number of smaller urban and rural banks, many of them family-owned (especially in Asia) or under the influence of the public sector (as in Latin America and central Europe). In general, few commercial banks, even larger ones, were listed on a stock exchange. Profitability varied widely, with some banks earning high gross returns but operating very inefficiently, and others competing fiercely for a narrow segment of the market. Likewise, while some banks used advanced technology and financial innovation, many were still struggling with basic operations such as credit risk assessment and liquidity management. In this environment, bank mergers were considered to be a potentially important vehicle for improving the structure and efficiency of the banking industry. They were expected to derive both cost reductions (from economies of scale, improved organisational efficiency, lower cost of funding, greater risk diversification, and economising on capital) and revenue gains (by exploiting economies of scope, making large deals possible, etc). In many crisis-hit countries, mergers and acquisitions were seen as an exit strategy for weak banks; while in others, officials wanted domestic banks to be large enough to compete with foreign entrants. The drive towards consolidation has continued. The number of mergers and acquisitions has declined since 2000, but only slightly. As shown in Table 3, during 2000-04 there were 99 M&A deals between domestic institutions and 45 deals between domestic and foreign-owned institutions. The corresponding figures for 1995-99 were 108 and 31 deals, respectively. In addition, domestic banks from Hungary, Malaysia and Singapore acquired a total of 11 banks abroad during 2000-04; while subsidiaries of foreign-owned banks in Colombia, Hungary, the Philippines and Turkey were involved in a total of eight mergers and acquisitions in these host and other countries. Moreover, the total value of assets of institutions merged since 2000 now exceeds USD 270 billion, compared with USD 170 billion in the second half of the 1990s. One should note that the figures on the value of mergers do not include data for several countries with significant M&A activities, such as the Czech Republic, Hong Kong SAR, Poland, Russia and Turkey. The largest numbers of deals were completed in Hong Kong, Korea, Malaysia, Poland and Russia. By far the biggest deals involved Mexican banks, followed by Thai, Korean and Philippine banks. Mergers and acquisitions in Poland and Russia have involved mostly smaller banks. In central Europe, merger
exception to the lack of transparency about costs and benefits of bank rescues is the Czech Republic - Barta and Singer (in this volume) calculate costs of both bank crises and delays in privatisation.
BIS Papers No 28
47
activity was strong in both periods. During the 1990s, however, this activity was mostly domestic; while since 2000, many mergers and acquisitions have also involved domestic and foreign banks, reflecting merger activity among parent banks from the European Union. Despite numerous mergers and acquisitions, the number of commercial banks in Indonesia and central Europe remains large (see Appendix Graph A1). Table 3 Mergers and acquisitions (M&As) in commercial banking sectors 1995-99 Type of M&A
2000-04
Country
Number of M&As
Colombia Chile Mexico Singapore Indonesia Korea Malaysia Philippines Thailand Czech Rep Hungary Poland Russia
6 2 6 2 1 10 2 2 1 4 5 9 58
20 480 64,600 1,700 … 13,500 20 6,900 47,700 … 3,000 … …
108
137,920
2 2 2 1 4 5 2 13
20 380 17,300 860 10,000 … 4,700 …
31
33,260
Cross-border M&As Chile by domestic Singapore institutions2
1 6
10 1,200
Total
7
1,210
Cross-border M&As Colombia by foreign-owned Hungary 3 institutions Poland
1 4 1
0 920 …
Total
6
920
152
173,310
M&As between domestic institutions
Total M&As between domestic and foreign-owned institutions
Colombia Chile Mexico Korea Thailand Czech Rep Hungary Poland
Total
All M&A activities 1
Value 1 (USD m)
Country Colombia Chile Mexico China Hong Kong SAR Singapore Korea Malaysia Philippines Thailand Czech Rep Poland Russia Turkey
Colombia Chile Mexico Korea Philippines Czech Rep Hungary Poland Turkey
Singapore Malaysia Hungary
Colombia Philippines Hungary Turkey
Number of M&As
Value 1 (USD m)
7 2 1 1 14 2 5 15 9 2 1 11 29 9
10 530 18,600 … … 8,000 23,480 40 16,400 28,000 … … … …
99
95,060
1 4 4 2 3 2 2 19 8
10 690 152,000 3,930 300 … 12,200 … …
45
169,130
6 1 4
3,400 2,980 …
11
6,380
3 1 3 1
30 1,040 5,790 …
8
6,860
163
277,430
2
Value of assets of merged institutions, rounded up to the nearest USD 10 million. Acquisition by domestic institutions of 3 banks in other countries. Acquisition by foreign-owned institutions in host country of banks in host and other countries.
Source: Central banks (BIS questionnaire).
48
BIS Papers No 28
Mergers in Latin America, central Europe and Hong Kong seem to have been by and large marketdriven. This is evident from central bank responses to the BIS questionnaire. The central bank, the supervisory authorities and the competition authorities in these countries generally have a neutral stance vis-à-vis mergers and acquisitions in the banking sector, which are considered to be private business deals. The authorities fulfil their respective duties if financial institutions apply for registration of such deals by considering, among others, standard industrial organisation criteria to assess the impact on competition and concentration in the banking industry. However, the authorities take a neutral stance towards the broader impact of such deals on financial market development and the economy - market forces are presumed to work, and the satisfaction of standard prudential and competition criteria is regarded as sufficient to assure favourable effects on the market and fiscal development. By contrast, in many Asian countries (including Indonesia, Malaysia, the Philippines and Thailand), mergers and acquisitions have been more or less actively promoted by the authorities. The Thai approach is illustrative in this respect (see the paper by Bank of Thailand in this volume). Since January 2004, the Bank of Thailand has, together with the finance ministry, started to implement the Financial Sector Master Plan, a medium-term development plan for Thailand’s financial sector. The purpose of this plan is to develop a “competitive, efficient, stable, and balanced financial system, capable of servicing both sophisticated and unsophisticated users”. One of the key policies under the plan is a new licensing regime, which foresees only two types of deposit-taking institutions commercial banks and retail banks - in lieu of the current four. In line with this new regime, existing financial institutions have to apply for a change in their licensing status. For instance, finance companies or real estate (credit foncier) companies may merge with one another to become commercial banks; if they do not wish to merge, they can submit an application to become retail banks on their own. In Indonesia, where bank mergers have also been actively encouraged, there has been little dynamism in M&A activity so far, partly because owners of small banks have been reluctant to give up ownership without special incentives (see the paper by Goeltom in this volume). Singapore has pursued a different, facilitative approach. Recognising that increasing globalisation of financial markets and cross-border competition offered Singapore the opportunity to become an Asian financial hub, the authorities launched a phased opening-up of the domestic financial market in 1999. The policy involved encouraging the local banks to engage in mergers and takeovers in a bid to realise economies of scale, as well as to strengthen their capability to invest in technology and management systems and to attract talent. However, the authorities did not seek to influence the outcome of mergers and takeovers, letting the new configuration be determined by market forces. How effective the different approaches to consolidation will in the end prove to be remains to be seen. So far, there have been no unintended consequences of either the neutral or the more active stance vis-à-vis bank consolidation. A key reason might be that issues of excessive concentration have not 7 yet arisen in emerging market banking industries. By and large, central banks and other authorities have not yet seen an increase in market concentration resulting from domestic bank mergers sufficient to raise concerns about market competition. However, concerns have emerged about increased regional concentration of banks’ activities in some countries. Moreover, as will be discussed in Section 3, cross-border mergers among large institutions that own subsidiaries in emerging market countries with an already large presence of foreign-owned banks could bring such issues to the fore of the policy agenda in the near future.
2.
Impact on financial intermediation
At the time of the Deputy Governors meeting in 2000, the impact of structural changes in the banking industry on financial intermediation could not yet be discerned. Growth of bank credit to the private sector was weak in most countries and falling sharply in those that had experienced a banking crisis in the late 1990s. Newly established domestic and foreign-owned banks were in many cases in the midst
7
One concentration issue that has arisen in a number of countries is provision of non-bank financial services by commercial banks. In Israel, for instance, commercial banks have typically been advisers to and providers of mutual funds, putting them into conflict of interest situations. In 2005, the authorities required the banks to divest such non-banking activities (see the paper by Sokoler in this volume). In many central and eastern European countries, commercial banks own leasing companies, which provide increasing amounts of credit to consumers.
BIS Papers No 28
49
of restructuring and were reluctant to extend credit to customers other than large corporations or the government. Intermediation margins were very wide, and lending to households and small and medium-sized enterprises (SMEs) was largely absent. In many emerging market countries policymakers complained about “cherry-picking” by foreign-owned banks, and some even lamented the diminishing role of state-owned banks, which were seen as key providers of credit to small firms and households. They also referred to evidence that lending by state-owned commercial banks was less procyclical than lending by private domestic and foreign-owned banks. Graph 3 Credit growth and bank ownership As a percentage of GDP State-owned banks
Credit extended by SOCBs/GDP
60 50 40 30
y = 0.048x + 7.6 R 2 = 0.03
20 10 0
50
0
100
150
200
Total commercial bank credit/GDP
Private domestic banks
Credit extended by PDBs/GDP
200 160 120 80
y = 0.807x –13.1 R 2 = 0.86
40 0
0
50
100
150
200
–40 Total commercial bank credit/GDP
Foreign-owned banks
Credit extended by FOBs/GDP
80
60
40
y = 0.145x + 5.5 R 2 = 0.15
20
0 0
50 100 Total commercial bank credit/GDP
150
200
Source: National data (BIS questionnaire).
50
BIS Papers No 28
Since late 2000 there has been a sea change in the bank lending landscape, so much so that policymakers in many emerging market countries have started to worry about - and in several cases seek to limit - too rapid growth of bank credit to the private sector, and in particular to households. The factors explaining the resurgence of private sector credit are discussed in the paper by Mohanty et al in this volume. This section will focus on the evolving composition of private sector credit and bank performance by different types of banks (state-owned, private domestic, foreign-owned), rather than on the performance and impact of banking systems as a whole. Impact on bank lending Graph 3 assesses how far banks with different ownership structures have participated in the process of financial deepening observed over the past 10 years. Points in this graph match total commercial bank credit as a percentage of GDP in 1994, 1999 and 2004, with the corresponding shares of stateowned, domestic and foreign-owned bank lending (as a percentage of GDP) for 14 emerging market economies for which data were available. Over the past 10 years, private domestic banks have participated in total credit expansion to a considerably greater extent than either foreign- or stateowned banks: for every 10 percentage point increase in the credit to GDP ratio, credit extended by private domestic banks has expanded on average by 8% of GDP, while the share of foreign-owned banks has increased by about 1½% of GDP, and that of state-owned banks by less than half a percentage point. Over the past five years, however, foreign-owned banks have expanded lending more rapidly than private domestic banks in several countries, including Chile, Korea and Mexico (Graph 4). In Brazil, by contrast, the share of foreign-owned banks stabilised at about 20% of total loans and their role in the domestic banking system has not grown, as private domestic banks seemed more capable of profiting from the growing domestic market. Private domestic banks also led the credit expansion in this period in Argentina, Colombia and Hungary. The contrast in lending by different types of banks is particularly stark in the case of Mexico, where foreign-owned banks expanded credit fivefold, while credit by private domestic banks contracted by almost 50% during 2000-04. Turkey is one of the few examples 8 of state-owned banks dominating credit expansion in recent years. Graph 4 Cumulative growth of bank credit, 2000-04 Per cent, in real terms
Thailand
–10
Argentina
–9
2 61 60 38
Foreign-owned banks Private domestic banks State-owned banks
109 86 67 114
Colombia Turkey Hungary
159 113 129
53
Korea
27
Chile Mexico
247
106 114
–46
–100
223
80
0
100
555 200
300
400
500
600
Sources: IMF; national data (BIS questionnaire).
Further insights can be obtained from the data on the composition of bank lending (Table 4 and Graph 5). Focusing first on credit to the government, it is interesting that, on average, both state- and foreignowned banks increased their lending to the government relative to lending to other sectors between 1999 and 2004, in particular in Argentina, Colombia and Turkey (state-owned banks) and Argentina,
8
Other examples would include China and India, for which the same breakdown of credit expansion is not available.
BIS Papers No 28
51
Colombia, Hungary, Korea, Mexico and Thailand (foreign-owned banks). While fiscal dominance seems a plausible explanation for the increased lending by state-owned banks (especially in Argentina and Turkey, which experienced crises in 2001), why foreign-owned banks would increase lending to the government in countries such as Colombia, Korea, Mexico and Thailand is puzzling.
Table 4 Composition of lending1 State-owned banks 2
Corporate
Government
Household
1999
2004
1999
2004
1999
2004
6.3
4.9
76.1
58.6
15.6
36.5
35.8
77.4
31.0
9.7
33.2
12.8
0.1
0.4
53.2
47.9
46.7
51.7
Colombia
20.0
50.6
44.5
34.3
35.5
15.1
Hungary
49.4
30.4
48.4
30.4
2.2
39.3
Turkey
30.3
65.2
64.9
27.7
4.8
7.1
Israel
34.7
33.9
52.1
52.7
13.1
Average
25.2
37.5
52.9
37.3
21.6
25.1
Korea Argentina Chile
13.4
Private domestic banks Korea
8.4
5.2
61.1
42.7
30.5
52.2
Thailand
4.5
4.9
68.1
66.9
27.4
28.2
Argentina
25.6
64.8
32.2
18.4
42.2
16.8
1.0
0.6
64.0
66.6
35.0
32.8
Colombia
14.4
30.7
62.2
55.6
23.4
13.7
Mexico
45.4
23.6
33.0
56.2
21.6
20.2
Hungary
39.2
18.8
36.9
29.7
23.9
51.4
Turkey
27.2
22.6
64.2
60.6
8.5
16.9
Israel
10.8
7.2
89.2
92.8
9.0
18.2
Average
21.0
21.7
56.2
55.9
23.9
24.8
Chile
Foreign-owned banks Korea
8.1
23.1
75.2
41.2
16.8
35.7
Thailand
5.6
13.0
89.7
75.0
4.7
13.0
Argentina
26.2
60.1
45.5
25.9
28.3
13.9
Chile
1.6
1.4
86.0
73.6
12.4
24.9
Colombia
9.5
32.6
73.7
47.6
16.8
19.8
Mexico
36.3
55.2
51.1
22.7
12.7
22.0
Hungary
14.2
14.6
80.5
65.1
6.4
20.3
Turkey
59.2
15.8
38.4
57.2
2.4
27.0
Average
20.1
27.0
67.5
51.0
12.6
22.1
1
As a percentage of total credit, excluding interbank credit.
2
Net claims on the government for most countries.
Source: Central banks (BIS questionnaire).
52
BIS Papers No 28
Graph 5 Change in the composition of lending between 1999 and 2004 Percentage points of total bank lending Credit to the government 35 15 -5 –25 –45
State-owned banks
Private domestic banks
Foreign-owned banks
AR TR CO CL IL KR HU AR CO TH CL KR IL TR HU MX AR CO MX KR TH HU CL TR
20
Credit to enterprises
0
–20
–40 IL CL CO KR HU AR TR MX IL CL TH TR CO HU AR KR TR CL TH HU AR CO MX KR
Credit to households 30
10
–10
–30 HU KR CL TR IL AR CO HU KR IL TR TH MX CL CO AR TR KR HU CL MX TH CO AR
Source: National data (BIS questionnaire).
The share of loans to the corporate sector declined in all three types of banks in almost all countries between 1999 and 2004, with the largest average declines occurring for state- and foreign-owned banks. The exceptions are few: Chile, Israel, Mexico (private domestic banks) and Turkey (foreignowned banks). Much of this decline is healthy, reflecting deleveraging by large firms and diversification of their sources of finance (to corporate bonds, equity and, in some cases, borrowing from banks abroad). Data for countries in central Europe indicate, for instance, a strong increase in lending to SMEs in recent years, which in several countries rivals lending to households in terms of the pace of credit expansion. Some of the decline in corporate lending also reflects post-crisis risk aversion and balance sheet repair on the part of banks. The most significant change in the composition of bank lending in the last five years has been a shift towards lending to households. Foreign-owned banks in particular have offset the large decline in the share of corporate loans (by 17 percentage points) with a rise in the share of household loans in total loans. Even state-owned banks increased lending to households between 1999 and 2004 (with the exception of Argentina and Colombia). The increase in the share of loans to households has been most pronounced in Hungary, Korea and Turkey. BIS Papers No 28
53
Comparing the composition of loans across banks, household loans accounted for roughly one quarter of total lending for all three types of banks in 2004 (Table 4). The big differences are in lending to corporations and the government. Private domestic banks lend mostly to the corporate sector (60% on average) and relatively little to the government (with the exception of Argentina, 15% on average). For state-owned banks, government and corporate loan portfolios are on average of the same size. Foreign-owned banks also lend primarily to the corporate sector, but unlike private domestic banks, the government accounts for over a quarter of their loan book; moreover, with the exception of Chile, Hungary and Turkey, this share has increased significantly since 1999. These differences in the composition of loans probably reflect the different business strategies, risk attitudes and histories of state-owned, private domestic and foreign-owned banks. Today’s stateowned banks for the most part inherited a large portfolio of loans to the public sector and corporations, including in several countries not just large corporations but also SMEs, which are supported by various government credit schemes (Mihaljek (2004)). Initially, they did not lend much to households, except in some cases under subsidised housing schemes. But over time, as competitive pressures have increased and state-owned banks have become more business- and profit-oriented, they have increasingly turned to the household sector, in many countries providing both consumer and housing loans. Korea and Hungary are clear examples in this respect. Nonetheless, state-owned banks still lend disproportionately to the government. From a governance point of view, one might argue that the lack of independence of state-owned banks from their owners is similar to connected lending practices in the private sector, with similar risks to profitability and soundness, and in principle would have to be sanctioned as such by independent supervisory authorities. Private domestic banks, on the other hand, emerged from the crises and restructuring of the late 1990s holding portfolios that consisted mainly of corporate loans (about 60%) and roughly equal proportions of claims on the government and the household sector. As macroeconomic conditions improved, they shifted their business towards households to a greater extent and more quickly than did state-owned banks. The fall in corporate lending shares also reflects an overextension of corporate lending in the past. As a result, both supply side (a pullback of banks from corporate lending) and demand side factors (weak corporate borrowing) have been at play. Russia’s experience is particularly interesting in this regard. A few years ago foreign-owned banks accounted for only 5% of total bank loans in Russia (including cross-border loans); in 2005, the figure had risen to 40%. The main customers of foreign banks have become big Russian exporters, which used to be serviced by large domestic banks in the past. These domestic banks have reoriented their lending towards SMEs, which used to be serviced by medium-sized banks in the past. These banks, in turn, have reoriented lending towards households, which used to be served by small banks. As a result of this domino effect, many small banks are being taken over or closed. Foreign-owned banks that entered emerging markets by buying local state-owned banks also inherited a large portfolio of loans to the government and the corporate sector. Like private domestic banks, these foreign-owned banks initially focused on the corporate sector (see the paper by Pruski and Zochowski in this volume). Other foreign banks, which entered emerging markets either as greenfield operations or by buying local mid-sized state-owned banks, were from the start more oriented towards households. As the financial position of large firms strengthened over time and many of them started to issue bonds and equity, foreign-owned banks that serviced them also started to turn to the household sector in search of higher margins. And as competition in consumer and housing credit markets has intensified, foreign-owned banks in some countries - in particular in central Europe - have turned to the next underserved segment of the market: SMEs. More recently, larger corporations in countries such as Hungary and Mexico have again begun to borrow from domestic banks, partly because the banks are offering them new types of loans at lower interest rates, including foreign currency loans. The development cycle of different loan products has thus turned full circle in some countries and a new cycle has begun.
Impact on bank efficiency In the wake of the emerging market banking crises of the 1990s, a growing number of studies have 9 found evidence that foreign bank entry tends to benefit the host country. It has been argued in
9
54
See eg Claessens et al (2001) and Demirgüç-Kunt and Huizinga (2001).
BIS Papers No 28
particular that foreign bank entry may stimulate competition in the banking industry, leading to higher efficiency for domestic banks, and result in improvements in the quality and accessibility of financial services for host country firms and individuals. Data provided by central banks for this meeting confirm that structural changes in emerging market banking systems have generally led to an improvement in standard prudential and efficiency indicators over the past five years. However, it has not been possible to assess improvements in the quality and accessibility of financial services. The average share of non-performing loans (NPLs) in total loans declined significantly for all types of banks between 1999 and 2004 (Table 5). The largest improvements were on average achieved by state-owned banks. Israel is the only country where there was an increase in the share of NPLs for all three bank categories. Other exceptions are Hungary and Venezuela for state-owned banks and Turkey for private domestic banks. The improvement in NPL ratios has been fairly uniform across countries and regions. Table 5 Non-performing loans1 State-owned banks
Private domestic banks
Foreign-owned banks
All commercial banks
1999
2004
1999
2004
1999
2004
1999
2004
23.4
13.7
13.6
12.5
12.0
7.1
16.5
11.1
1.4
0.8
1.7
1.1
1.8
1.5
1.7
1.2
22.8
3.5
7.1
3.8
7.3
2.1
10.0
3.4
…
…
10.8
1.2
2.2
2.2
9.2
2.1
24.0
29.5
6.2
1.6
5.1
0.7
6.1
1.7
China
22.4
15.6
12.0
4.9
…
…
…
…
India
16.0
8.1
10.3
5.9
7.2
4.9
14.6
7.4
Korea
15.0
1.9
8.7
2.0
20.6
1.6
11.4
1.9
Thailand
55.3
9.6
21.6
12.8
7.5
2.6
31.2
10.9
Hungary
4.3
17.6
4.4
2.0
3.7
2.9
3.9
3.5
11.3
11.4
3.8
5.1
2.4
3.3
6.1
6.4
4.9
6.5
0.6
3.5
…
…
1.7
4.2
10.7
8.4
4.7
7.0
2.9
10.2
4.9
Argentina Chile Colombia Mexico Venezuela 2
Turkey Israel Average 1
18.3
As a percentage of total loans. commercial banks.
2
Based on five-tier classification. Data for private domestic banks are for joint stock
Source: Central banks (BIS questionnaire); IMF.
One should note that much of this improvement probably reflects the business cycle and is not necessarily the result of different behaviour of representative bank categories. In addition, many banks, in particular state-owned ones and those that were sold to foreign strategic investors, unloaded a significant portion of their NPL portfolios to asset management companies and other vehicles for resolution of bank distress. This is partly confirmed by central bank answers to the questionnaire on guarantees offered to buyers of privatised banks (see Table 2 above). Nevertheless, there seems to have been some structural improvement in NPLs, as the 2004 NPL ratios shown in Table 5 are generally below those observed during the previous cyclical upturn in the mid-1990s (cf Hawkins and Mihaljek (2001)). Provisioning against loan losses has also risen significantly (Graph 6). Banks in most countries had set aside provisions for at least two thirds of NPLs at end-2004; in Chile, Korea, Mexico and Saudi Arabia cover exceeded 100% of NPLs. Cover seems relatively low only in central Europe, India, Malaysia and Venezuela, and these provisioning ratios are in many cases considerably higher than prior to the crisis in the mid-1990s (in the case of Turkey, prior to 2001).
BIS Papers No 28
55
Graph 6 Total provisions against loan losses, as a percentage of NPLs
VE MY
24
129 44 44 55
PL
IN IL TH
39 44
CO TR
62
2004 1999
69
47
SG CZ
104
55 58 58
HU
60 44
73 73 85
41
88
47
KR SA
119
74
CL MX
164
99 152 104
165 202
Sources: Central banks; IMF
Capital adequacy has generally improved for state-owned banks, and has stayed relatively high for private domestic and foreign-owned banks (Table 6). With risk-adjusted capital/asset ratios (capital adequacy ratios) of around 32-37%, state-owned banks in the Czech Republic, Hungary, Thailand and Turkey are probably overcapitalised while those in China, with an adjusted CAR of below 7% in 2004, are clearly undercapitalised. In Korea and the Czech Republic, foreign-owned banks have reduced capital adequacy ratios that were perhaps unsustainably high for a competitive banking environment to more normal levels. In most other countries, including India and Turkey, private banks have either increased or maintained relatively high levels of capital adequacy. Again, these levels compare favourably with capital adequacy ratios from pre-banking crisis periods. Structural changes have also had a visible impact on bank profitability, as measured by returns on assets and equity. State-owned banks in particular have significantly improved both their return on assets (Appendix Table A1) and their return on equity (Appendix Table A2) since 1999, as well as with respect to the mid-1990s. Improvements in these indicators were also pronounced for private domestic banks in Colombia, the Czech Republic, Hungary, Korea, Saudi Arabia and Thailand. For instance, in 2004 the return on equity of private domestic banks in Colombia, Hungary and Venezuela exceeded 30% and the return on assets exceeded 3%, with banks in Saudi Arabia realising slightly lower but still fairly high returns. The improvement since 1999 has been less pronounced for foreign-owned banks, whose profitability was already somewhat higher in 1999 than that of private domestic banks. In Argentina, profitability of foreign-owned banks declined drastically after the 2001 crisis. Changes in net interest income and other income have been less pronounced. State-owned and private domestic banks generally increased net interest income relative to total assets between 1999 and 2004 (Appendix Graph A2). But for foreign-owned banks net interest income ratios were either constant or declined in most countries, reflecting the narrowing of interest rate margins brought about by greater competition. In Hungary, Turkey, Colombia and Venezuela, net interest income ratios for most banks exceeded 4% in 2004, suggesting that intermediation margins were still quite high. In Hungary, Turkey and Venezuela, high interest margins in addition partly reflected relatively high real interest rates in an environment of rapid disinflation.
56
BIS Papers No 28
Table 6 Capital adequacy1 State-owned banks
Private domestic banks
Foreign-owned banks
All commercial banks
1999
2004
1999
2004
1999
2004
1999
2004
Argentina
16.5
9.1
31.5
16.3
16.3
11.9
19.7
12.3
Chile
13.3
10.1
11.4
12.0
15.4
16.7
13.5
13.6
9.1
8.3
11.7
11.1
12.0
11.1
11.2
10.7
…
…
16.4
17.8
14.6
13.2
16.0
14.1
15.2
10.9
12.8
12.6
13.6
12.6
13.3
12.5
China
5.4
6.8
…
7.6
…
…
…
…
India
11.3
13.2
11.9
11.2
10.8
15.0
11.3
12.9
Korea
9.3
12.5
11.6
11.3
21.9
13.1
12.0
11.8
24.4
31.9
16.3
13.7
13.8
12.1
15.0
13.2
…
31.6
11.5
14.0
18.6
12.1
13.6
12.6
24.4
31.9
16.3
13.7
13.8
12.1
15.0
13.2
Poland
8.8
16.3
12.6
15.1
15.0
15.4
12.4
15.6
Turkey
11.7
36.8
17.2
22.3
22.5
26.9
7.0
26.2
9.6
10.8
9.3
10.7
…
…
9.4
10.8
13.3
13.7
14.7
13.5
15.7
14.4
13.0
13.8
2
Colombia Mexico
Venezuela 3
Thailand Czech Rep Hungary
Israel Average 1
2
Risk-weighted capital adequacy ratios, in per cent. Total capital over total assets. 2004, respectively. Data on private domestic banks are for joint stock commercial banks.
3
Data refer to end-2001 and June
Source: Central banks (BIS questionnaire); OECD.
Graph 7 compares sources of income (upper panel) and profits and costs (lower panel) for different categories of banks in 2004. With the exception of Argentina, net interest income is still the main income source for most banks, regardless of ownership structure. But the share of non-interest income is generally higher for foreign-owned banks than for state-owned or private domestic banks, reflecting the broader range of products offered by foreign banks. For all three types of banks there has been a widespread increase in this share since 1999 (Appendix Graph A2), suggesting an expanding scope of financial intermediation as banks have introduced new fee-based products and services. Increased competition in the banking industry has also been reflected in generally lower interest rate margins. As shown in Graph 8, with the exception of Hong Kong SAR and Turkey, the spread between representative bank lending rates and customer deposit rates declined from an average of 6.1 percentage points in 1999 to 4.1 percentage points in 2004. The narrowing of interest margins has been particularly pronounced for state-owned banks, suggesting that large rents were extracted in the past from their dominant position in many countries. There has also been a substantial narrowing of interest rate margins for foreign banks, with private domestic banks making on average less progress. Pre-tax profits have risen in most countries and operating costs have generally declined since 1999 (Appendix Graph A3), as well as with respect to the mid-1990s. For both profits and costs, the magnitude of these improvements has been similar across different types of banks. The absence of clear “winners” suggests that increased competition has provided state, private domestic and foreignowned banks with roughly equal incentives to improve performance. What differences remain probably reflect different starting positions. As shown in the lower panel of Graph 7, foreign-owned banks tend to have slightly higher pre-tax profits (2.2% of total assets on average, compared with 1.8% for private domestic and state-owned banks), but they also have higher costs (3.9% of total assets, compared with 3.2% for domestic banks and 2.6% for state-owned banks). It is not entirely clear what factors have contributed to these differences. One reason might be that, compared with foreign banks, state banks often own real estate in attractive locations (or rent it at low cost from city authorities), and can offer their staff higher state benefits in exchange for somewhat lower salaries. BIS Papers No 28
57
Graph 7 Net interest and other income, 2004 As a percentage of total assets
10
Net interest income Other income
8
6
4
2
0 SO DO FO Czech Rep
SO DO FO
SO DO FO
SO DO FO
SO DO FO
SO DO FO
SO DO FO
SO DO FO
SO DO FO
Turkey
Israel
Korea
India
Argentina
Colombia
Mexico
Venezuela
Note: SO = state-owned banks; DO = private domestic banks; FO = foreign-owned banks. Source: Central banks.
Profits and costs, 2004 As a percentage of total assets
8
Pre-tax profits Operating costs 6
4
2
0 SO DO FO SO DO FO SO DO FO SO DO FO SO DO FO SO DO FO SO DO FO SO DO FO SO DO FO SO DO FO Czech R.
Hungary
Turkey
Israel
Korea
India
Argentina
Colombia
Mexico
Venezuela
Note: SO = state-owned banks; DO = private domestic banks; FO = foreign-owned banks. Source: Central banks.
In sum, several indicators point to a positive impact overall of structural change on bank lending and efficiency. The structure of lending has become more diversified, with less credit going to the government and large enterprises and more to households and - at least in central Europe - smaller enterprises. Banks in emerging market countries have by and large also become financially stronger and operationally more efficient. Greater foreign bank participation has helped improve bank governance. Yet differences between state-owned and other banks still remain. Compared with foreign-owned banks, for instance, state-owned banks have generally been slower in diversifying their lending and reducing non-performing loans; but have been recapitalised to a greater extent (perhaps excessively
58
BIS Papers No 28
so in some countries), and have done more to improve return on equity/assets and narrow interest rate margins, albeit often from worse starting positions. 10 Positive effects of competition on bank performance have also been visible in the case of private domestic banks. This is perhaps the most significant development, considering that in many countries these banks had to cope with restructuring at their own shareholders’ expense, whereas the state-owned banks were typically restructured at taxpayers’ expense and subsequently sold to foreign-owned banks, in most cases below the cost of restructuring. Graph 8 Interest rate margins
Bank lending minus deposit rate, %
20
19.0
18
16.3
15.7
16 1999
14
2004
12
9.3
10 7.4
8
6.6
6.3 5.1
6 4 2
8.9
5.0 3.8
3.5
3.6
3.9
3.5 2.2
1.4
4.2 3.0
2.3
1.9
2.4
0 HU
PL
TR
IL
HK
KR
MY
SG
CL
CO
VE
Source: National data (BIS questionnaire).
3.
Challenges for market discipline and supervision
The changing structure of the emerging economies’ banking systems has many implications for financial stability and in particular the supervisory regime. This section addresses two specific issues that arise in this context: first, supervision of foreign-owned banks; and second, the impact of delisting of large domestic banks from local stock exchanges after takeovers by foreign-owned banks. The presence of foreign banks has generally led domestic supervisory authorities to upgrade the quality and increase the size of their staff in order to supervise the more sophisticated activities and new products being introduced by these banks. In addition, supervisory authorities in banking systems dominated by foreign-owned banks have had to cooperate with home country supervisory authorities to a greater extent. In virtually all countries attending the meeting, domestic supervisory authorities have established formal channels of communication with the authorities in charge of financial supervision in parent banks’ home countries. In most cases, the framework for cooperation is set out in bilateral memoranda of understanding. Areas of cooperation typically cover: exchange of information on operations of foreign-owned banks in host and home countries; exchange of information on management of foreign-owned banks; and joint consultations and visits to foreign-owned banks. Cooperation is generally judged to be smooth, and the main obstacle in establishing closer working relationships with foreign supervisory authorities is usually seen to be the different legal treatment of confidential data and information in various jurisdictions.
10
One common complaint about foreign banks in Latin America is that their managers have very short time horizons and tend to act procyclically (see the paper by Betancourt et al in this volume). By contrast, publicly owned banks tend to have longer time horizons.
BIS Papers No 28
59
Yet some central banks have expressed more general scepticism about overly legalistic modes of communication among supervisors. In practice, the consolidated (home) supervisor has tended to dominate the host country supervisor even in the case of subsidiaries. Moreover, comments provided in the BIS questionnaire suggest that some host country authorities were not always fully informed about the situation of parent banks in home countries. One special challenge is governance: foreignowned banks are managed from their headquarters from a global perspective, which means that different transactions are booked in different banking hubs around the world. As a result, some subsidiaries end up with a greater concentration of certain risks than would otherwise be the case. As reporting lines for different operations often bypass local managers, central banks in host countries might not always be informed in time about issues such as liquidity problems of local subsidiaries. Different accounting standards also create problems, in part because they affect the type of business activities that foreign banks carry out in host countries. Several central banks noted that foreign bank affiliates are often of marginal importance from the parent perspective, but might well be systemically important for the host country. One issue that arises in this context is what would happen if a foreign-owned subsidiary that was systemically important locally ran into problems. One central bank acknowledged that it did not know what parent banks would do in such a case. There were cases where a parent company had helped its subsidiary immediately, without asking host country authorities for any assistance. But there were also some 11 cases of a parent abandoning its subsidiary. The response would seem to depend on financial health of the parent - if the parent was in weak shape, it might care less about reputation costs and abandon its subsidiary. Another central bank attached less probability to foreign parents abandoning their subsidiaries than to foreign owners more generally not acting in the interests of local shareholders. A related issue in this context is the possible conversion of systemically important subsidiaries of foreign-owned banks into branches. This development has been facilitated in the European Union by the adoption of the single EU banking passport. But the issue is more general, as the centralisation of the decision-making process in global financial institutions has led to a system in which subsidiaries operate more or less like branches anyway. 12 The issue in this case is less whether such systemically important branches (or quasi-branches) might be abandoned in a period of distress - legally, branches cannot be “abandoned” because claims on the bank stay with the parent - and more how the central bank and supervisory authorities in the host country might deal with the loss of liquidity in the domestic banking system and disruptions to the payment system if the parent institution decides to close a branch that is small for the parent, but systemically important for the host country. Developments in the global banking industry are important for market discipline and supervision in emerging market host countries for yet another reason: mergers between parent institutions in industrial countries might result in a significant increase in concentration in host countries. For instance, the merger between Unicredito and HVB has implications for competition in the Polish banking market, as these two parents own the second and third largest banks in Poland. As noted above, bank consolidation in most emerging economies has not yet been associated with any marked rise in concentration, as most mergers have involved smaller banks. But mergers between large domestic institutions that reflect merger activity outside the borders of the host country might be harder to resist. What could supervisory authorities do in such circumstances if they cannot challenge such domestic mergers on legal grounds? The delisting of foreign-owned subsidiaries from local stock exchanges raises a different set of concerns. Among countries attending the meeting, such delisting has occurred in the Czech Republic, Hong Kong SAR, Korea, Mexico and Poland. In the Czech Republic, it involved one institution with a 12% share in market capitalisation; in Hong Kong, one very small bank; in Korea, two institutions with a 0.8% share in total market capitalisation each; and in Poland, three institutions with a combined share in stock market capitalisation of 5%. Delisting has been by far the biggest issue in Mexico (see the paper by Sidaoui in this volume). During 2000-05, five of the largest institutions in Mexico, representing 77% of total bank assets, were
11
One well known case is that of Riječka banka, Croatia’s third largest bank, in which a currency trader caused losses of nearly USD 100 million, or three quarters of the bank’s capital, in 2002. Germany’s Bayerische Landesbank decided to sell its 59% share in the bank for a symbolic price of USD 1 to the Croatian government when the losses were discovered. The government subsequently sold the bank to Austria’s Erste Bank for EUR 55 million plus a capital increase.
12
See CGFS (2004, 2005) and Domanski (2005).
60
BIS Papers No 28
acquired by foreign-owned banks (foreign-owned banks now account for 82% of the country’s total bank assets). All of these five institutions were subsequently delisted from the Mexican stock exchange, leading to a significant loss of market prices and scrutiny by independent analysts. Moreover, as these banks represented 15% of total stock market capitalisation at the time of acquisition (11% at the time of delisting), their delisting affected the development of the Mexican capital market more generally. Even though supervisors required subsidiaries to report as if they were listed, that information did not benefit the local market. In addition, the disclosure of timely and meaningful information about developments in institutions accounting for close to 80% of Mexico’s banking sector was impaired, making it necessary to significantly improve information flows from parent banks to markets, and from home supervisors to host authorities. The delistings also raise broader questions about financial and corporate development in emerging market economies and possible policy responses.
BIS Papers No 28
61
Appendix Graph A1 Number of commercial banks 70
Latin America
65
60
52
50
40
42
37
40
30
27
26
2004
1994
30
31
30
24
41
38
34
34
27
20 10 0 1999
2004
1990
1994
Argentina
1999
Chile
1999
172
150
103
90
1999
2004
100 50 0 1999
2004 China
1999
2004
1990
1994
Mexico
380
400 350 300 250 200 150 100 50 0
300 250 200
1994
Colombia
China and India 330
350
2004
Venezuela
Hong Kong SAR and Singapore
208
165
1990
1994
1999
2004
141
132
142
1990
1994
1999
Hong Kong SAR
115
2004
Singapore
Other Asia
230
200
161
154
150 100
2004
285
India
250
1999
122 76
63
51
50
38
35
1994
1999
25
30
29
34
30
2004
1990
1994
1999
2004
0 1994
1999
2004
Korea
Malaysia
1990
Thailand
1994
1999
2004
Indonesia
Central and eastern Europe 82 77
90 80 70
55
60
54 42
50 40
42
41
1994
1999
35
59
54 44
35
34
30 20 10
9
0 1990
1994
1999
2004
Czech Republic
Hungary
2004
1994
1999 Poland
2004
1990
1994
1999
2004
Turkey
Source: National data (BIS questionnaire).
62
BIS Papers No 28
Table A1 Return on assets State-owned banks
Argentina Chile Colombia Mexico Venezuela China India Korea Thailand Czech Rep Hungary Poland Turkey Israel Saudi Arabia Average1 1
Private domestic banks
Foreign-owned banks
All commercial banks
1999
2004
1999
2004
1999
2004
1999
2004
–0.1 0.7 –14.5 … 0.7 0.1 0.4 –3.7 … … 0.6 1.1 1.1 0.5 ... –1.3
0.3 0.5 3.0 … 1.5 0.3 1.1 1.9 … 0.9 2.5 1.8 2.5 0.6 … 1.5
1.4 0.5 –0.2 1.8 2.6 … 0.7 –0.0 –6.0 –1.0 1.5 2.0 4.3 0.6 1.7 0.7
1.1 1.5 3.5 1.0 4.2 … 1.0 0.7 1.2 0.4 3.7 0.5 1.6 0.7 2.7 1.7
–0.1 0.8 –1.4 0.7 3.5 … 0.9 –1.0 –0.2 0.7 0.1 1.2 5.4 … … 1.0
–3.0 1.3 2.4 1.1 4.9 … 1.6 0.6 2.3 1.4 1.7 1.4 2.3 … … 0.9
0.2 0.7 –3.7 1.5 2.9 … 0.5 –1.2 –5.2 –0.3 0.5 1.4 –0.7 0.6 1.7 –0.1
–0.5 1.2 3.2 1.1 4.2 … 1.1 0.8 1.4 1.3 2.4 2.0 2.1 0.7 2.7 1.9
Excluding Argentina.
Source: Central banks (BIS questionnaire); IMF.
Table A2 Return on equity Private domestic banks
Foreign-owned banks
All commercial banks
2004
1999
2004
1999
2004
1999
2004
3.6
6.9
8.4
–0.8
–30.3
1.9
–4.9
State-owned banks 1999 Argentina Chile Colombia
–1.3 12.9
12.1
9.6
21.0
8.6
14.0
9.4
16.7
–159.0
36.3
–1.5
31.1
–11.9
21.3
–32.5
29.9
…
…
17.6
11.9
10.5
12.4
16.3
12.3
Mexico Venezuela
4.3
13.7
20.2
32.7
26.0
38.7
21.7
34.0
India
8.5
20.9
12.5
16.3
9.9
15.4
9.2
19.3
Singapore Korea
…
…
10.5
13.5
…
…
10.5
13.5
–60.1
29.6
–0.5
15.0
–7.8
11.2
–17.5
16.5
Czech Rep
…
14.9
–16.8
9.6
9.8
25.1
–4.3
23.4
4.0
19.1
27.2
41.2
1.2
22.7
6.3
28.5
Poland
18.7
27.3
19.5
8.5
13.7
16.9
16.3
18.3
Turkey
27.6
26.6
33.2
10.3
44.9
–61.9
–14.0
14.0
Israel
10.5
11.4
11.8
11.6
…
…
11.3
13.2
…
…
15.8
26.2
…
…
15.8
26.2
–14.7
21.2
12.2
19.1
10.5
11.6
3.7
20.4
Hungary
Saudi Arabia Average1 1
Excluding Argentina.
Source: Central banks (BIS questionnaire).
BIS Papers No 28
63
Graph A2 12
10
8
Net interest income As a percentage of total assets State-owned banks Private domestic banks Foreign-owned banks
6
4
2
0
99 CZ 04
99 HU 04
99 TR 04
99 IL 04
99 KR 04
13
11
99 TH 04
99 IN 04
99 CO 04
99 MX 04 99 VE 04
Other income State-owned banks
As a percentage of total assets
Private domestic banks Foreign-owned banks
9
7
5
3
1
–2
99 CZ 04
99 TR 04
99 IL 04
99 KR 04
99 IN 04
99 CO 04
99 MX 04
99 VE 04
Source: Central banks (BIS questionnaire).
Graph A3 9
Operating costs As a percentage of total assets
8 State-owned banks
7
Private domestic banks Foreign-owned banks
6 5 4 3 2 1 0
99 CZ 04
99 HU 04
99 TR 04
99 IL 04
10
99 KR 04
99 IN 04
99 CO 04
99 MX 04
99 VE 04
Pre-tax profits As a percentage of total assets
5
0
99 CZ 04
–5
99 HU 04
99 PL 04
99 TR 04
99 IL 04
99 KR 04
99 IN 04
99 CO 04
99 MX 04 99 VE 04
State-owned banks Private domestic banks Foreign-owned banks
–10
–15
Source: Central banks (BIS questionnaire).
64
BIS Papers No 28
References Andrews, A (2005): “State-owned banks, stability, privatisation and growth: practical policy decisions in a world without empirical proof”, IMF Working Paper no 05/10, January. Bank Austria (2004): Banking in central and eastern Europe, April. Barnett, S (2004): “Banking sector developments”, in E Prasad (ed), “China’s growth and integration into the world economy: prospects and challenges”, IMF Occasional Paper no 232. Barth, J, G Caprio and D Nolle (2004): “Comparative international characteristics of banking”, Office of the Comptroller of Currency, Economic and Policy Analysis Working Paper no 1, January. Berger, A, G Clarke, R Cull, L Klapper and G Udell (2005): “Corporate governance and bank performance: a joint analysis of the static, selection and dynamic effects of domestic, foreign and state ownership”, World Bank Policy Research Working Paper no 3632, June. Bernanke, B (2005): “The global saving glut and the US current account”, remarks at the Sandridge Lecture, Virginia Association of Economics, Richmond, VA, 10 March. Claessens, S, A Demirgüç-Kunt and H Huizinga (2001): “How does foreign entry affect domestic banking markets?”, Journal of banking and finance, vol 25, no 5, May. Clarida, R (2005): “Japan, China and the US current account deficit”, Cato Journal, vol 25, no 1. Committee on the Global Financial System (2004): Foreign direct investment in the financial sector of emerging economies, Basel, BIS, March (www.bis.org). ——— (2005): Foreign direct investment in the financial sector: experiences in Asia, central and eastern Europe and Latin America, summary of follow-up workshops to the CGFS report Foreign direct inflation in the financial sector of emerging economies, Basel, BIS, June (www.bis.org). Demirgüç-Kunt, A and H Huizinga (2001): “Financial structure and bank profitability”, in A DemirgüçKunt and R Levine (eds), Financial structure and economic growth: a cross-country comparison of banks, markets and development, Boston, MIT Press. Demirgüç-Kunt, A, L Laeven and R Levine (2003): “Regulations, market structure, institutions and the cost of financial intermediation”, NBER Working Papers, no 9890, July. Domanski, D (2005): “Foreign banks in emerging market economies: changing players, changing issues”, BIS Quarterly Review, December (www.bis.org). Hawkins, J and D Mihaljek (2001): “The banking industry in the emerging market economies: competition, consolidation and systemic stability - an overview”, BIS Papers, no 4, August (www.bis.org). Honohan, P and D Klingebiel (2001): “Controlling the fiscal costs of banking crises”, in D Klingebiel and L Laeven (eds), “Managing the real and fiscal effects of banking crises”, World Bank Discussion Paper no 428. Lohmus, P and L Teo (2005): “Russian banking sector: recent developments and remaining challenges”, in IMF, Russia: Selected issues, Washington. Mihaljek, D (2004): “Banking industry in central and eastern Europe: the unexpected leader in the transition and integration with the EU”, in D Masciandaro (ed), Financial intermediation in the new Europe: banks, markets and regulation in EU accession countries, Cheltenham: Palgrave, pp 3-27. Organisation for Economic Cooperation and Development (2005): China: economic review, OECD, Paris. Sherif, K (2004): “Fiscal costs of state-owned banks in selected economies of central and eastern Europe”, in K Liebscher et al (eds), The economic potential of a larger Europe, Cheltenham, Edward Elgar. Song, I (2004): “Foreign bank supervision and challenges to emerging market supervisors”, IMF Working Paper no 04/82, May.
BIS Papers No 28
65
The changing nature of risks facing banks Ramon Moreno 1
Introduction Emerging market financial systems have proved to be less resilient than the banking systems of developed countries. Views differ about the reasons for this. Some argue that an unstable macroeconomic environment is the main culprit. Others blame poor risk management. In this note we draw on the results of a survey of emerging market central bank meeting participants to shed light on the possible contributions of these two broad factors to changing banking resilience. We explore: (1) the changing nature of macroeconomic risks; (2) new forms of risk to banks; and (3) whether the capacity to manage risks has improved. We conclude the paper with an overview of what we know about the vulnerability of the banking sector in emerging markets at this time.
1.
The changing nature of macroeconomic risks
Emerging economies are exposed to larger shocks than are developed countries. 2 Annex Table A1 shows that in the second half of the 1990s, the volatility of growth in output, consumer prices, and the real exchange rate, as well as that of the ratio of bank credit to the private sector to GDP, was consistently much higher in emerging than in developed market economies. Macroeconomic volatility would discourage the provision of credit by increasing uncertainty about prospective returns and exposing banks to potentially large losses. However, more recently macroeconomic conditions appear to have improved considerably: Annex Table A1 also reveals a sharp decline in the volatility of these macroeconomic indicators in emerging economies in the last decade, although it still tends to be higher than in developed countries. Whether the recent period of low volatility will continue remains uncertain, but a number of structural changes have occurred which might be expected to enhance macroeconomic resilience and stability. Some emerging market economies have succeeded in reducing economic imbalances, thus lowering their vulnerability to external or domestic shocks. As shown in Graph 1, external vulnerability indicators 3 developed at the BIS have broadly declined. Indicators of currency mismatches have also fallen significantly since the late 1990s. 4 Budget deficits and ratios of public debt to GDP have improved in some important emerging markets. Finally, resilience has also been enhanced in those countries which adopted floating exchange rates along with more stable, and increasingly more credible, monetary policy regimes. Nevertheless, a number of risks remain. First, large global imbalances - notably fiscal and current account deficits in the United States, and large current account surpluses in Asia - could reverse abruptly. A sudden correction, resulting in sharply lower global growth, higher US interest rates and a steep dollar depreciation could be harmful to some emerging market economies, in some cases by
1
Comments by Philip Turner, William White and Már Gudmundsson, helpful discussions with Christian Upper and Agustin Villar, and the research assistance of Marjorie Santos and Gert Schnabel are gratefully acknowledged.
2
Inter-American Development Bank (2005, p 8).
3
Based on the behaviour of the real effective exchange rate, the current account, export growth, external debt level and growth, and short-term debt in relation to foreign reserves. See Hawkins and Klau (2000, Annex B) for details.
4
For a discussion of the relationship between currency mismatches and the severity of crises, see Goldstein and Turner (2004). The graph measures the extent to which the proportion of foreign currency denominated debt is offset by the size of the export sector, or the presence of a “natural hedge”.
BIS Papers No 28
67
inducing “sudden stops” in capital flows. 5 Many are exposed in addition to sharp fluctuations in commodity prices. Graph 1 External vulnerability, currency mismatch and fiscal balances External vulnerability indicator1
Currency mismatch indicator5
2, 3
2, 6
Asia, large Asia, small2, 4
Latin America Central Europe2, 7
9
Fiscal balances8 0
200
–4 150
6
–8 3
Turkey
100 –12
0 50
–16
–3
1996 1
1998
2000
2002
2004
–6
1996
1998
2000
2002
2004
0
1996
1998
2000
2002
2004
–20
2
Based on Hawkins and Klau (2000); the higher the “score”, the greater the vulnerability (maximum = 10). Weighted 3 4 China, India, Korea and Taiwan (China). Indonesia, Malaysia, the Philippines and average of the economies listed. 5 6 Thailand. Foreign currency share of total debt divided by the ratio of exports to GDP. Argentina, Brazil, Chile, Colombia, 7 8 Mexico, Peru and Venezuela. The Czech Republic, Hungary and Poland. As a percentage of GDP. Data not shown: –30% in 2001 for Turkey. Sources: Asian Development Bank; Economic Commission for Latin America and the Caribbean; IMF; national data; BIS.
Second, some emerging market economies still face domestic imbalances that could raise concerns. In China, efforts to adjust the composition of domestic demand from investment to consumption are having uncertain effects on bank asset quality; other countries might be vulnerable to credit to the consumer sector as well (see the paper by Mohanty et al in this volume). High public debts are also a concern in a number of emerging markets, including in India and the Philippines, Turkey and a number of Latin American countries. In some cases budget deficits are a related concern; in Poland, for example, rising deficits could adversely affect the prices of long-term securities held by banks. In part this could occur via a resultant need to tighten monetary policy and in part because it might contribute to a delay in Poland’s adoption of the euro. A more general concern is that in the current benign environment, domestic borrowers might become overextended and thus become vulnerable to a cyclical downturn. An additional perspective on changing exposure to macroeconomic risks is provided by central bank responses to the questionnaire mentioned above. Central banks were asked what they thought was the probability of significant harm to the financial sector in the event of a large shock today, and to compare this probability to what their assessment might have been 10 years earlier (Graph 2). Their responses give a distinct impression that banking sector vulnerability to large shocks has declined over this period.
5
68
A sharp correction of imbalances in the United States and China is a key element of the crisis scenario developed in Goldstein (2005).
BIS Papers No 28
Graph 2 Probability of significant harm to financial sector in case of large shock1 Certain harm High probability
Low probability Nil
100
100
75
75
50
50
25
25
0
A
A-10 B
B-10 C
C-10 D
D-10 E
E-10 F
F-10 G
G-10 H
H-10
I
I-10
J
J-10 K
K-10
0
Note: A = terms of trade; B = world interest rates; C = sovereign spread; D = capital flows; E = third country exchange rates; F = own exchange rate; G = global demand for exports; H = domestic demand; I = domestic interest rates; J = domestic equity prices; K = domestic property prices. 1
Percentage of economies which gave the answer indicated. X = shock today, X-10 = shock 10 years ago. Respondents comprise Chile, China, Colombia, the Czech Republic, Hong Kong SAR, Hungary, Indonesia, Korea, the Philippines, Poland, Russia, Saudi Arabia, Singapore, Thailand and Turkey. Source: Central banks.
•
There is a perception of reduced vulnerability to shocks arising from external sources (terms of trade and export demand). This is of particular interest in the light of large external imbalances and a recent analysis that suggests that a global crisis could be triggered by a slowdown in growth in the United States and China (Goldstein (2005)). It is less clear that perceived risks arising from domestic demand have fallen; although no respondent reported certain harm; more respondents assigned a high probability of harm to the financial sector.
•
The number of countries reporting certain or high probability of harm from external financial shocks or capital flows appears to have remained stable or fallen (see responses for world interest rates, capital flows, third country exchange rates and own exchange rate). However, a small subset of countries sees certain harm from sharp increases in sovereign spreads and capital flow reversals; they did not perceive such high risks 10 years ago. 6
•
Exposure to perceived risks arising from high domestic asset prices has also fallen (see responses for domestic interest rates, equity prices and property prices).
Thus, notwithstanding the impression of reduced vulnerability, the responses still indicate a high probability of significant harm from a wide range of (large) shocks. 7 To sum up, while the macroeconomic environment and central bank assessments point to distinct improvements in the resilience of banking systems to shocks, significant vulnerabilities apparently remain. In this context, a key challenge confronting policymakers that may have succeeded in addressing old vulnerabilities is to identify and manage new ones. To provide further perspective on this issue, we next review new forms of risks for banks.
6
For capital flows, certain harm was indicated by a small fraction of respondents, whereas it would not have been indicated 10 years previously. However, the number of respondents indicating high probability or certain harm overall fell.
7
Questionnaire responses may also understate shocks if respondents assumed shocks would occur independently but instead they occur in combination.
BIS Papers No 28
69
2.
New forms of risks for banks
The resilience of banks in emerging markets depends in part on their exposure to new forms of risks and their ability to manage them. We focus on trends in credit, market and liquidity risks. 8 Credit risk Credit operations are traditionally the main source of income as well as risk for banks. Many emerging market economies appear to have compensated for the adverse effects of recent banking crises on corporate credit growth. In line with this, around 40% of respondents to the questionnaire cited credit to households as an important or somewhat important source of credit risk. The following aspects may be highlighted. First, a distinct increase in credit to the household sector has altered risk exposures. 9 Although the share of credit to households in some cases is still small (Graph 3, left-hand panel), it is growing rapidly. On balance, credit risks might be expected to fall as a result of the shift to households because: (i) it means that there is lower overall concentration in bank assets; (ii) consumer credit diversifies risks among a larger number of borrowers than does credit to corporations; (iii) profits from consumer lending tend to be more stable and are higher; and (iv) implicit or explicit guarantees, or bankruptcy protection (all of which can encourage risk-taking by the borrower) might be lower for households than for corporations. However, a concern, cited by one central bank respondent, is that banks know less about their household borrowers than they do about their corporate borrowers. In any case, experience shows that risks in lending to households can be significant, as in the example of Korea cited in Mohanty et al’s contribution to this volume. Credit risk in Korea now appears to have declined because of adjustments following recent crises and the cleaning-up of non-performing loans (NPLs). However, stress tests for credit risk exposures, which are done occasionally, indicate that it is still the largest part of risk exposure. Another example is India, where the possibility that rapid rates of growth in credit card lending (about 30-40% a year over the past five years) might increase risk exposures is a concern (Merchant (2005)). Graph 3 Trends in credit to the private sector and residential property prices Credit to private sector1 Housing credit Consumer credit Other credit
ID TH CL2 MX CZ3 HU PL TR
Volatility of property prices4
Property price index5
120
20
90
15
60
10
30
5
0
CN HK ID KR TH ZA NL AU
0
China Hong Kong SAR Indonesia Korea Thailand South Africa Netherlands Australia
225
175
125
75
2000
1
2002
2004
25
2
As a percentage of total domestic credit. First column refers to end-1999, second column refers to mid-2005. First column 3 4 refers to end-2001. First column refers to end-2002. Estimated as a standard deviation over 1995-2004 of the year-on5 2002 = 100. year changes of the quarterly data; for China, 2000-04, for Indonesia, 2003-04. Sources: IMF; CEIC; national data.
8
This paper will not focus on operational risk. This is a new issue, and could involve significant costs to banks, but our inquiries suggest that domestic banks in a number of emerging markets have neither data to estimate it nor procedures to manage it. In the context of the discussion in this paper, a key concern is that the exposure to new types of credit, and the growing reliance on tradable securities and credit derivatives, as well as new techniques of risk assessment, could increase the risk of errors in modelling or product design, or complicate settlement.
9
For a discussion on reasons for this shift, see the paper by Mohanty et al in this volume.
70
BIS Papers No 28
Second, in some countries there are significant credit risks on the banking book associated with asset price fluctuations. For example, households which have taken out mortgages bear unhedged interest rate risk and are also exposed to fluctuations in real estate prices which might be related to interest rate movements or the stage of the cycle. As can be seen in Graph 3, property prices in emerging markets are in many cases at least as volatile as they are in two developed countries where volatility is high (Australia and Netherlands). Cumulative changes in these prices have been large; since the end of 2002, real estate prices have approximately doubled in South Africa, and increased up to 60% in Hong Kong SAR. Risks from property price increases depend on exposures, which vary considerably. Lending for residential real estate accounts for around 25% of total loans in Hong Kong and Korea, around 19% in Hungary, Poland and Israel, but 12% or lower in Colombia and Mexico (see Annex Table A2). In some cases, such as Korea or Hong Kong, bank exposure is limited by ceilings on loanto-value. However, in Korea there is still concern that a fall in property prices could adversely affect aggregate demand or employment. In one country, a stress test conducted in 2004 indicates that an isolated and local sharp fall in real estate prices would not have systemic effects; however, the financial situation of many banks could deteriorate significantly if a real estate crisis were accompanied by a general economic crisis. One big risk to banks is that households will service their debts but will then cut back on spending to do so. A broader recession would then affect banks in other ways. The Bank of Thailand’s contribution to this volume discusses the simulated effect of a policy rate hike on financial stability; the risks of a disruption are limited, but market conditions warrant monitoring. 10 In some countries dollarisation is a potential source of exchange rate-related credit risks. Some banking systems have significant liabilities in dollars and attempt to compensate by extending dollardenominated loans to domestic residents (De Nicolo et al (2003), Cayazzo et al (forthcoming)). While banks thus hedge their currency positions, most borrowers earn in local currency and do not hedge their borrowing. Dollarisation is significant in Latin America, Turkey and central and eastern Europe (CEE). In Peru, for example, 70% of deposits and 60% of credit is in US dollars. Exchange rate risk is also present in the books of borrowers in Turkey, but for a different reason; in this case it is because companies have borrowed heavily from abroad. In Poland, an increasing share of banks’ loan portfolios is in foreign currency, mainly in the form of long-term loans for financing purchases of property. 11 Bank vulnerability in this situation is in some cases potentially limited by policy or by specific conditions. For example, in Chile banks are required to provision for this indirect foreign exchange risk. In CEE, the risks associated with high rates of dollarisation are attenuated by an exit strategy, which is the adoption of the euro.
Market risk A number of questionnaire respondents noted that the growth in bank trading books has increased exposure to market risk in a number of economies; such risk was generally not considered significant (and was not analysed) 10 years ago. However, exposure to market risk is in many cases still quite small. To illustrate the range of exposures, in Korea marketable securities grew 21% in 2004, to reach over 14% of total assets. In Mexico, about 75% of the total risk of financial institutions, as measured by value-at-risk (VaR), can now be traced to market risk (from positions that are sensitive to interest rate fluctuations); 10 years ago the main source of risk was credit risk. In the Czech Republic, capital requirements for market risks (trading book, including capital requirements for the credit risk of the trading book) have almost doubled over the last five years; however, they still comprise less than one tenth of the capital requirements for the banking book (credit risk). In Thailand, the direct capital impact of market risk on regulatory capital is estimated at less than 1 percentage point, which is significant but small enough to be considered manageable. In Poland and Israel, the direct market risk to banks is considered small. In Poland’s case this is because the banks tend to have closed positions in foreign currencies, and floating interest rates apply to both long-term deposits and loans.
10
This is a generic term referring to the use of any foreign currency for transactions in a local market. In many countries this involves the use of US dollars; in central and eastern Europe, it involves the use of euros or Swiss francs.
11
These loans are popular because they are cheaper for borrowers. See discussion relating to Figure 7 of Pruski and Zochowski’s contribution to this volume.
BIS Papers No 28
71
Risk on the trading book from fluctuations in interest rates is particularly important in some countries (India, Indonesia, the Philippines, Argentina, Colombia) where government securities form a significant part of banks’ assets (see the papers by Mohanty et al, Pesce, Vargas and Goeltom in this volume). In a number of countries, these holdings have been a large source of trading profits when interest rates were falling but have resulted in losses when rates rose. Stress tests reveal that banking systems’ exposure to this type of risk is also significant in other emerging markets, whether due to holdings of government or private securities. 12 According to one Latin American central bank, a 100 basis point increase in yields across all maturities would cost 17% of the annual earnings of financial institutions. In Mexico, the main source of market risk derives from long-term assets and fixed rate instruments, but a shock the size of the 1995 crisis would not lead to the disappearance of the capital of any bank. In 2004, another central bank assessed the impact of a price decline in corporate debt of 30%. For institutions that had resident enterprises’ listed instruments in their portfolios, losses for two types of banks ranged from 2 to 4.8% of capital, up from 1.3 to 3.6% a year earlier. 13 Still another central bank performed a test of dependence of the banking system on the public sector, in both assets and liabilities. It showed that some small banks’ capital and net earnings were sensitive to moderate changes in public debt prices or withdrawal of public deposits. In Hong Kong SAR, a stress test conducted in 2005 revealed that an interest rate increase of more than 2% could lead to some banks making a loss. This is because banks might not have necessarily factored in the interest rate or significant exposure to interest rate sensitive sectors such as property (Gimbel (2005)). In Korea, however, based on quantitative risk management tools such as VaR, the market risk of bonds was assessed as low. Most respondents to the questionnaire expressed no concerns about exchange rate risk, although direct currency exposure, while low, is in some cases significant. In Turkey, banks have small open positions that do not require additional capital, so exchange rate risk is much lower than in the period before the 2000-01 crisis. In Korea, a stress test of the impact of Chinese renminbi appreciation on banks’ foreign currency risk estimated the impact as low because of ex ante portfolio adjustment. In contrast to past episodes in which currency depreciation was the main concern, there could be risks in 14 possible currency appreciation in countries where foreign currency holdings are significant. Neither were significant concerns expressed about the market risk from holding stocks, as such holdings are low in many emerging markets (eg 0.1% of total assets of banks in Korea and 0 in Chile, where banks are prohibited from holding stocks). In one country, it was estimated that the impact of a fall in the stock index by 30% would not entail significant losses, and this estimate had fallen; losses were estimated at 3.8% of capital at the beginning of 2005 against 5.2% of capital a year earlier. For estimates of bank open positions in currencies and equities, see Annex Table A4.
Liquidity risk The analysis of liquidity risk (the risk of being unable to raise funds without incurring unusually high costs) focuses on gaps between bank assets and liabilities along the whole maturity spectrum. 15 An excess of assets over liabilities at each maturity creates a funding gap, and liquidity management involves securing financing to cover this gap or limit its size (conversely, if assets fall below liabilities,
12
For further information on banks’ holdings of securities, see Annex Table A3 and Mohanty et al’s contribution to this volume (Graph 1).
13
Type 1 comprised banks that were required to calculate interest rate risk and, consequently, included market risk in the calculation of the capital adequacy ratio; Type 2 comprised credit institutions that did not calculate interest rate risk. The latter had lower estimated losses.
14
In Chile, interest rate risk is relatively more important than exchange rate risk.
15
In this context, recent research has formalised the idea that one reason why banks exist is that they are a mechanism for pooling liquidity to meet the demands of savers and borrowers simultaneously. In particular, banks can reduce their need for cash in response to unexpected shocks to liquidity by combining transaction deposits and loan commitments, as long as depositor and borrower demands for liquidity are not highly correlated. In line with this, banks with a larger share of transaction deposits (in total deposits) tend to extend more loans (Kashyap et al (2002)). For interbank market implications, see footnote 36.
72
BIS Papers No 28
the liabilities need to be invested). Prospective funding gaps create exposure to interest rate risk unless hedged, as the costs of funding or returns on investment are uncertain. 16 While data on funding gaps at different maturities are currently not available, we can get a sense of liquidity conditions by examining the ratio of liquid assets to liquid liabilities (liquid asset or current ratio 17). This is highest in banks in Korea and the Czech Republic (115% and 95% respectively), intermediate in Turkey, Poland, Hong Kong SAR, Mexico, Saudi Arabia and Hungary (37-65%) and lowest in Venezuela, Israel and Colombia (23.4-29.3%). Current ratios declined significantly between 1999 and 2004 in Venezuela, Hungary and Israel (see Annex Table A5 for liquidity ratios and other indicators related to funding gaps). As the preceding are aggregate data and reflect a variety of economic conditions, interpretation is not straightforward. However liquidity ratios might be expected to be higher in economies where the government does not actively intervene to meet funding gaps, financial institutions are risk-averse, fixed interest rates prevail or where hedging is more difficult. Additional perspective could be gained by examining the ratio of demand deposits to credit to the private sector over the business cycle and during episodes of financial stress (Graph 4). Given that credit to the private sector is illiquid, a rising share of demand deposits could suggest higher liquidity risks. This appears to be an issue in a number of emerging markets. For example, one central bank noted that low interest rates had encouraged banks to fund from short-term sources in the current cycle; this has deepened the maturity mismatch in the balance sheets of deposit-takers, who are now exposed to both significant interest rate risk and higher liquidity risk. Graph 4 Demand deposits as a percentage of credit to the private sector Asia
45 Indonesia Korea Malaysia Philippines Thailand
Latin America
65
Argentina Brazil Chile Mexico
36
Other emerging markets
52
27
100
Czech Republic Hungary Poland Russia Turkey
39
75
50 18
26
9
13
25
1990
1995
2000
2005
0
1990
1995
2000
2005
0
1990
1995
2000
2005
0
Source: IMF.
As can be seen, the demand deposit ratio has been stable for extended periods in a number of countries, such as Brazil and Chile (converging to around 12%), and Korea and Thailand (converging to around 5%). In other countries it has been quite volatile, although the relationship to the cycle is not always apparent. In some countries there appears to be a boom and bust process in which the ratio falls with rapid growth in credit during a cyclical upturn, and then rises in the aftermath of crises. 18
16
A complete analysis at the bank level would include consideration of “maturity ladders”, which are based on the projected evolution of assets and liabilities and expected gaps at given maturity dates. Goldstein and Turner (2004, pp 94-5) recommend that supervisors or central banks aggregate the liquidity gap analysis of individual banks to construct maturity ladders for the whole economy.
17
The current ratio typically refers to assets that could be converted to cash in less than one year and to payables due within one year.
18
Examples include Mexico around the time of the peso crisis, Brazil before and after 1997, Malaysia and to a lesser extent Indonesia and the Philippines around the time of the Asian crises of 1997-98, and Argentina. Remarkably, no such cycle is apparent in Korea or Thailand around 1997.
BIS Papers No 28
73
One possible interpretation of these fluctuations is that during boom times, banks are expanding their credit portfolios in anticipation of higher returns, and might be willing to offer higher rates of interest to longer-term depositors; this might encourage a fall in the demand deposit ratio. During bad times, the ratio rises because demand deposits become more attractive to depositors due to concerns about the safety of their deposits, 19 because banks offer lower rates of interest and because credit has fallen. The effect would be particularly strong in those banking systems where credit has collapsed or NPLs have suddenly been taken off the books of the banking system, as occurred in the Czech Republic earlier this decade. 20 One caveat is that in a number of cases, such as Mexico, the rise in demand deposits appears to have persisted for a long time, so factors other than the 1994 crisis may be responsible for the rise in the proportion of such deposits. The preceding discussion suggests that the relative importance of risks could change over the business cycle. Credit risk would be of concern during boom periods as credit portfolios expanded. Potential illiquidity in the banking system’s balance sheet, which makes it vulnerable to runs, could be a greater concern during bad times, but not in all cases and possibly only in the aftermath of certain very severe crises. Determining more precisely the changes in risks over the cycle requires further research.
3.
Has the capacity to manage risks improved?
Assessing risks The past 10 to 15 years have been associated with significant changes in the reliance on risk management in a number of emerging markets. In the past, the extension of credit in many economies reflected government guidelines or existing banking relationships. Institutional conditions played a large role; many banks were state-owned or were subject to government credit guidelines. Private banks (eg in East Asia) were often family-owned or formed part of a corporate network in which priority was given to lending within the group of related businesses. There was no culture of risk management; the government, other banks, or the profitable segments of the corporate networks (which were often relied upon to provide guarantees to their weaker partners) would provide support in case of financial difficulty. Supervisory oversight was formal and focused on compliance with rules rather than risk 21 mitigation. The system was not transparent, and market discipline was absent or ineffective. The high costs of this system (financial crises, persistent losses among public banks) have led to significant changes. State-owned banks have been privatised in many countries. Competition has been encouraged by liberalising entry, notably by foreign banks (see the paper by Mihaljek in this volume). There has been more reliance on market discipline, requiring greater transparency in governance and accounting. Prudential oversight has shifted towards ensuring that financial institutions are run in a way that is conducive to financial stability, as opposed to ensuring compliance with rules. To varying degrees, these changes have increased the accountability of bank managers and their incentives to improve risk management. In the past 10 years, risk management units have been established in banks in emerging market economies or their role has been strengthened, and risk management issues are now explicitly considered by boards of directors of these banks. Ongoing technical improvements include: (i) changes in the approach to valuation, including marking to market or fair value assessments; (ii) the quantification of various risks, including the use of VaR calculations
19
Increases in demand deposits may be seen in the context of Diamond and Rajan’s (2003) argument that such deposits serve as a device for attracting depositors by reassuring them that the bank will not be able to extract additional rents (any effort to do so would trigger a bank run). Demand deposits and the associated financial fragility are thus a disciplining device that are an intrinsic feature of financial intermediation. The policy implication is that financial fragility should not be entirely eliminated by regulation since it promotes good internal governance.
20
As noted earlier, this effect is not apparent in Korea or Thailand, even though both countries had large programmes for NPL disposal.
21
For perspectives on supervision see Topping (2005), and the respective contributions to this volume by Ryback, Guinigundo, Al-Hamidy and Villar.
74
BIS Papers No 28
and stress testing, focused on market risks and to some extent on credit risks; and (iii) the pricing and allocation of credit, as well as provisioning and the allocation of capital on the basis of risk assessment. While the extent to which more market-oriented or sophisticated risk management tools have been adopted varies considerably, the use of such tools now appears to be a more common part of banking practice in emerging markets. As illustrated in Graph 5, which focuses on valuation, modelling and reliance on data, in about 40% or more of responding countries there has been full or extensive adoption of marking to market, VaR (typically of market risks), stress testing, and reliance on credit default information or credit bureaus. However, efforts to adopt better approaches to valuation and risk management raise a number of issues. Graph 5 Use of risk management techniques by deposit-taking institutions1 Fully Extensively
To some extent Not at all
Unclear or no answer
100
100
75
75
50
50
25
25
0
Mark to market trading book
Mark to market for non-traded contracts
VaR measurement
Stress testing
Own customer credit default
Credit bureaus
Other risk assessment
0
1
Percentage of economies which gave the answer indicated. Respondents comprise Chile, China, Colombia, the Czech Republic, Hong Kong SAR, Hungary, Indonesia, Korea, Malaysia, Mexico, the Philippines, Poland, Russia, Saudi Arabia, Singapore, Thailand and Turkey. Source: Central banks.
Issues of valuation There has been a shift towards marking to market and fair value accounting that in many cases is broadly consistent with international or developed country accounting standards. Implementation appears to be well advanced in some emerging markets while lagging in others. For example, Korea and Turkey have adopted fair value on trading portfolios (derivatives and many securities), but other assets are measured at historical cost. Other countries are taking steps to implement international accounting standards for fair value accounting (eg IAS 39). Transparent accounting is a prerequisite for effective risk management and the exercise of market discipline. In addition, it creates the right incentives for bank managers. For example, a number of emerging markets have kept NPLs on their books for extended periods without recognising the losses. The implementation of IAS 39 would require banks to recognise these losses, creating a strong incentive to dispose of the loans (this is the case in the Philippines). Notwithstanding these advantages, the growing adoption of fair value accounting raises a number of issues cited by our 22 questionnaire respondents.
22
One respondent also cited the amount and quality of resources and controls required to reliably measure the fair value of financial instruments, which is disclosed in a note to the financial statements.
BIS Papers No 28
75
First, measurement issues. For example, how does the designated use of a financial instrument affect its measurement (eg a loan which is a hedged item in a fair value hedge and a loan which is not; debt securities held to maturity, held for sale and trading securities; a derivative instrument which is a hedging instrument in a cash flow hedge and a derivative which is not). How does one deal with measurement differences of instruments that differ in their legal form, but are similar in their economic substance (for example: loans and debt securities that are not traded). Second, how can one obtain reasonable fair value for instruments which are not priced in deep and liquid markets? Third, how relevant are unrealised valuation changes, especially those that are not intended to be realised for a long while? Such valuation changes mean bank financial statements can become more volatile. This could raise regulatory capital requirements, and possibly lead to procyclicality. Views on how to address this last issue vary considerably, with some opting for deferred recognition of valuation changes and one central bank stressing the importance of immediate recognition. In Venezuela, the bank supervisory authority (which is not the central bank) has dealt with unrealised valuation changes by allowing banks to transfer government securities, over 90% of the investment portfolio, from the trading portfolio (subject to mark to market) to a “permanent portfolio”. Banks thus avoid the effects of a sharp decline in prices, and can easily hold government securities to maturity since the longest term is four years. Another respondent noted that the Committee of EU Banking Supervisors had introduced prudential filters which help limit the impact of IAS introduction on regulatory capital and presumably attenuate any procyclical impact at the macro level. However, the Czech National Bank stressed that financial statement volatility contains important information. It noted that movements in the yield curve introduce volatility into the profit and loss statement only if a bank is not hedging its interest rate risk; it is appropriate to show this profit and loss volatility by fair value accounting. Under old accounting practices, this volatility was hidden. Issues of risk assessment As noted earlier, banks in emerging markets are adopting more advanced techniques for risk assessment, such as VaR, stress testing and credit scoring. Underlying this have been sustained efforts by financial institutions in many emerging market economies to introduce functional risk management groups as well as the large improvements in IT infrastructure needed to handle up-todate valuation and risk measurement requirements. In a number of economies, risk assessment is now used as the basis for daily transactions, and to improve such risk management practices as limits to different positions. Three difficulties in implementing more sophisticated risk assessment techniques may be highlighted. First, data problems. Modern techniques of risk management, reflected in the methodological approach of Basel II, involve the estimation of probabilities of default on the lender’s loan portfolio, as well as of loss-given-default. Banks in emerging markets often lack sufficient data on corporate and 23 household rates of default to estimate default probabilities. In the case of one advanced emerging market economy, banks could estimate default probabilities but typically did not estimate loss-givendefault. Foreign banks get around the problem by relying on data from their home country operations, but these data might not be entirely applicable to the emerging markets. Many emerging markets are, however, taking steps to improve data availability. For example, Malaysia and Thailand have respectively established a centralised credit registry (for households and corporations) and a credit information bureau. However, in some countries banks are reluctant to share information on borrowers, even when credit information bureaus already exist. Second, even in relatively advanced emerging markets, banks might lack suitable techniques for designing and calibrating models to evaluate alternative scenarios. As noted by one central bank respondent, measures of VaR or market risk are sometimes not standardised, and it is difficult to verify the economic validity of estimated values.
23
76
It would still be possible to draw on a significant amount of information to make informed credit decisions, but tighter constraints on credit might then be needed due to less precisely estimated risks. One central bank respondent said that growing credit card lending was appropriately managed by banks which followed due diligence in lending to households. Such banks generally required borrowers to submit regular information about their income and debt positions.
BIS Papers No 28
Third, the human resources and infrastructure (IT and other) costs of implementing advanced techniques of risk assessment can be very large. One questionnaire respondent said that external ratings also help risk management processes, as they can be used as a check on internal ratings or to assess credit risks. For instance, reliance on external ratings of borrowers is foreseen under the standardised approach of Basel II. However, discussions with international rating agencies suggest that it is unlikely that they will rate more than a limited set of (major) borrowers in each emerging market in the near future, because increasing coverage is simply too costly. 24 This would be particularly true in the less advanced emerging markets that would be most likely to rely on external ratings. There are local rating agencies in a number of countries that cover a larger set of domestic corporate borrowers. This can contribute to improved risk assessment, but the national ratings are not necessarily comparable across countries. 25 Each country would thus have a different way of rating borrowers and weighting risks. An implication is that indicators of banking conditions such as capital asset ratios will not be comparable across countries. This can complicate policy assessment and cross-border asset allocation decisions. Better risk management? 26 Better risk management is ultimately reflected in better pricing. While pricing reflecting assessments of risks and return are the norm in developed countries, achieving this in emerging economies is an ongoing process. A key concern in some countries has been the existence of very high bank intermediation margins over extended periods (Brock and Rojas-Suarez (2000)). The reasons for the persistence of high intermediation margins are not clear, but may include a history of banking crises, lack of competition, and government regulations that favour lending to certain sectors (which might result in cross-subsidisation through higher rates being charged to other sectors). In the past, restrictions in interest rates may also have played a role. Cross-country time series data for intermediation margins are not readily available, but IMF data on loan-to-deposit spreads offer some perspective (Graph 6). As can be seen, Brazil is perhaps the most extreme case of high spreads, at around 40%. In contrast, there are a number of countries where loan-to-deposit spreads are low, and comparable to those in developed markets. Even in those countries where spreads are lower, however, extended periods of stability raise questions 27 about the influence of market forces in price setting.
24
For example, in Mexico, where there is a large foreign bank presence, rating agencies play a limited but growing role in assessing banks’ credit risks. On the one hand, only a few categories of assets take external ratings into consideration and few banks have rated their issued securities. On the other hand, the local operations of international rating agencies (Standard & Poor’s, Moody’s and Fitch) are the main source of ratings for Mexican and other Latin American companies and provide increasingly valuable information. Their ratings complement banks’ internal rating systems, thus improving debtor quality information.
25
Domestic rating agencies often follow a methodology similar to that of international rating agencies, but would not be in a position to harmonise ratings on a cross-country basis. In a number of emerging markets, the problem is alleviated by foreign rating agencies entering into joint ventures with local ones. In China, there are 73 rating agencies with a total staff of 1,200 and cooperation with international rating agencies has led to significant improvements in rating techniques and quality.
26
Risk management has been influenced by provisioning, which is discussed in Villar’s contribution to this volume.
27
See also the discussion of pass-through from money market rates in Archer’s contribution to this volume. An alternative perspective on spreads is provided by Sidaoui in his contribution to this volume (see discussion relating to his Graph 11). He notes that higher spreads can be obtained from new types of lending, such as credit card lending, than from traditional commercial credit. As noted by Pruski and Zochowski in this volume, credit to households also earns higher rates than credit to corporations in Poland.
BIS Papers No 28
77
Graph 6 Interest spreads1 Larger spread countries2 Brazil Mexico Peru Russia Venezuela
60 50 40
Narrower spread countries, other3
Narrower spread countries, Asia 6 5
China Hong Kong SAR Korea Malaysia
10
4
8
30
3
6
20
2
4
10
1
2
0
1996
1998
2000
2002
2004
0
1
1996
1998
2000
Loan rates less deposit rates; quarterly averages; in per cent. for Argentina close to 36% in 2002.
2
Argentina Chile Czech Republic Hungary Poland
12
2002
2004
0
1996
1998
2000
2002
Peak value for Russia in 1995 close to 300%.
3
2004
Peak value
Source: IMF.
Questionnaire responses suggest that the adoption of improved techniques for risk assessment have allowed banks in some emerging markets to improve risk management and to rationalise their pricing. Innovation will play an increasingly important role in this process, as new financial instruments tend to reduce market segmentation, and to make prices across borders and between various types of financial instruments (credit and equity) move more closely. However, concerns remain about whether pricing fully reflects the risks being taken. A number of factors that have a bearing on pricing and risk management in emerging market economies may be cited. First, technical difficulties in pricing risk correctly. While risk is now increasingly taken into account in pricing, domestic banks in many emerging market economies still face considerable difficulty in pricing it correctly because of the data and model limitations cited earlier. Second, changes in market structure and growing competition. Changes in market structure (privatisation, increased entry by foreign banks, financial innovations) have significantly altered the competitive environment faced by domestic banks. 28 In emerging markets, foreign banks intensify competition because they tend to be more highly rated than domestic banks (whose ratings typically do not exceed the sovereign’s) and thus have access to cheaper financing. Their competitive advantages are often enhanced by greater operating efficiency and better technology. The implications for risk management and financial stability are mixed. On the one hand, the erosion in pricing power (ie less ability to lower deposit rates and raise loan rates) reduces earnings and increases the incentives for risk-taking on the part of domestic banks. Moreover, competitive pressures might also lead to mispricing. For example, in one economically advanced emerging market, the lending rate generally reflects expected loss, but only a few banks incorporate unexpected loss (cost of capital) into their pricing due to competition in the lending market. 29 On the other hand, lower loan rates reduce adverse selection problems and incentives for risk-taking by borrowers. 30 The presence of foreign banks can also enhance financial stability by improving risk management among competitors, and because of the potential support by the parent. Indeed, questionnaire respondents indicated that foreign banks often hedge their positions by implementing reverse transactions with their respective parents.
28
See the paper by Mihaljek in this volume.
29
Improvements in measuring expected and unexpected loss are also needed in order to increase the use of risk-based pricing.
30
For a discussion of these competing viewpoints and some recent empirical evidence, see Beck et al (2003) and Boyd and De Nicolo (2005).
78
BIS Papers No 28
Third, concentration risk and connected lending. In some countries (eg Israel) concentration risk arises because most credit is to the local economy and all the big banks are locally owned. Credit to a few big local groups of connected borrowers is now close to regulatory ceilings; some of these are highly leveraged borrowers whose performance could have systemic effects. Some of these groups were formed as a result of privatisation. It may be noted that connected lending as a percentage of capital is nonetheless relatively small in Israel, just over 5% in 2004, compared to nearly 12% in Saudi Arabia, 20% in Venezuela and about 26% in Mexico (Annex Table A2). While precise data are not available, connected lending appears to be an issue in China, where banks sometimes extend credit on the basis of loan guarantees by related (but sometimes also unrelated) parties. Loan guarantees appear to have been implicated in the recent failure of a major Chinese conglomerate. 31 The risks of connected lending are illustrated by the experience in the last decade of one emerging market where most private sector banks belong to family-owned industrial groups. There were limits on connected lending but banks still tended to lend to their related group companies, which pursued aggressive growth strategies. Presumably because connected lending creates incentives for evergreening, NPLs were rolled over and not classified according to requirements; huge loan losses were thus underestimated. Connected lending was also a problem during Korea’s financial crisis, as well rated or better performing firms provided guarantees to related weaker firms. In Turkey, efforts to reduce connected lending could be very beneficial as most failing banks taken over by the country’s saving deposit insurance fund engaged in such lending (see Başçi’s contribution to this volume). Fourth, government restrictions. Credit risk can be influenced by government restrictions or institutional factors that affect the ability of banks to manage risks. In some countries, interest rate controls prevent banks from pricing credit to account for risks. For example, interest rates in China and Venezuela are still subject to controls, although they were recently partly liberalised in China. In Turkey consumer loans can only be extended at fixed rates, creating risks for creditors who fund at floating rates. In a number of countries (eg India) banks are required to follow credit allocation guidelines, which do not necessarily conform to decisions based on assessments of risks and returns. In China, there is concern that local authorities have influenced credit decisions made by bank branches. Fifth, deficiencies in legal frameworks. An important source of credit risk is imperfect contract enforcement. Many banks in emerging markets - particularly those following civil law - confront legislation that generally favours the borrower rather than the creditor (for example, by making collateral difficult to seize). Apart from this, court cases can last for years and outcomes are unpredictable; the resulting risks deter lending. Changes have been slow, although some countries (eg Brazil, Mexico, Argentina) have adopted new banking legislation that has to varying degrees improved contract enforcement. In Brazil, ways of attaching earnings to pay bank debt have resulted in large increases in lending to households. In some cases, like that of Venezuela, developments have gone the other way; activism by consumer groups and legislative and judicial decisions have reduced creditor rights, and eroded the credit culture of borrowers. Sixth, a risk management culture is still not fully developed in many emerging markets. While risk management culture now resembles that of developed markets in a number of countries, there are still some noteworthy differences. Even when banks are privately owned, bank boards might accept greater risks over the objections of their risk management groups, with a view to gaining a larger market share or short-term increases in revenues. Under these conditions, recent easy financing conditions and competitive pressures could imply an excessive lowering of credit standards. Credit standards have also been an ongoing concern in China, and in particular the extent to which a reduction in NPLs might have been achieved largely by expanding the overall size of the loan books 32 without adequate consideration for risks. Even if the importance of effective risk management has
31
Press reports indicate that the failed industrial conglomerate Kelon received CNY 381 million in guarantees from Greencool enterprises, a firm owned by Kelon’s former Chairman Gu. Resources became available to make good on this guarantee only because Mr Gu’s assets were seized. Non-transparent loan guarantees appear to have posed other difficulties for Kelon. As early as 2002, it had advanced CNY 1.2 billion to its former controlling shareholder through undisclosed transactions involving bank borrowings, guarantees and debt transfers. More recently, a local Chinese court froze CNY 17.1 million in bank deposits and Kelon’s 22.73% stake in its Jiangxi-based subsidiary Huayi Compressor Co Ltd due to a loan guarantee dispute.
32
For example, according to press reports, a Goldman Sachs report on China Construction Bank, which was listed in Hong Kong SAR in October 2005, estimated that 7.4% of new corporate loans granted by CCB in 2002 had already turned sour.
BIS Papers No 28
79
been recognised by the Chinese authorities for some time now, observers have expressed concern that majority government ownership might create incentives to pursue social as opposed to commercial goals, with such an approach leading to bank losses. In some cases, prudential regulations suggest concerns that risk management tools in place might not suffice to manage systemic risks. One example is regulatory loan-to-value ceilings, implemented in some emerging markets, which do not rely on the internal risk management tools of financial institutions. Another example is restrictions that were recently imposed on consumer credit in Thailand. 33 Beyond this, government intervention to rescue financial institutions or firms can dampen incentives for risk management, particularly if these institutions do not pose systemic risks. Seventh, the adequacy of mechanisms and markets for managing and mitigating risks. This involves issues such as the availability of instruments for hedging and risk transfer, and the functioning of the interbank market (for managing liquidity risks). These are discussed in the next two sections. Instruments for hedging and transferring risks The effectiveness of risk management also depends on the ability to hedge or transfer risks. One issue here is the lack of depth in (cash) asset markets, which has sometimes constrained risk management by limiting the ability of financial institutions to adjust their portfolios in a timely fashion. Conditions in some cases have improved, however (see below). Another issue is the depth of markets for hedging or transferring risks. The degree of market development varies, but in a number of cases derivatives markets have grown rapidly. For example, increases in outstanding derivatives positions have been large in Mexico and Hungary. Based on questionnaire responses, the following can be highlighted (see Annex Table A6). First, markets for hedging exchange rate risk (forwards, swaps) are common in emerging economies and are usually the most liquid. Second, markets for hedging interest rate risk are either very recent or not available in a number of emerging market economies (eg in Latin America). One reason for this may be lack of liquidity in underlying bond markets. 34 Countries have sought to address this with varying degrees of success. One successful example is offered by Mexico, where maturities have increased considerably, and local currency fixed rate government issues are now available in maturities of three, five, seven, 10 and 20 years. These securities have helped stabilise cash flows under different interest rate conditions, and instruments exist to hedge the associated interest rate risk in fairly liquid markets. Third, standardised contracts that trade on exchanges (eg futures) are available in some countries. Such contracts are sometimes preferred because they lower costs. They are also more transparent, thus lowering the operational (eg settlement) risk usually associated with over-the-counter (OTC)transactions. However, because they are not customised, they will not necessarily be the first choice of financial institutions seeking to develop new products. Fourth, the share of new credit risk transfer instruments is still small in many emerging markets although these instruments are attracting growing interest. One of their uses has been to help strengthen banking systems via the securitisation of NPLs. More recently, there has been interest in the development of mortgage-backed securities (MBS) markets. However, questionnaire responses
Furthermore, “special mention” loans (which were likely to become NPLs) comprised 14% of CCB’s loan book in the first half of 2005. The case of CCB is particularly relevant because of government measures to strengthen the bank by recapitalising it, removing NPLs from its books, and improving its governance prior to listing. For another example, in the course of a(n individual) rating upgrade in September 2005, Fitch Ratings estimated that ICBC’s NPLs had fallen due to government assistance, but the underlying trend of ICBC NPLs actually increased in 2004. ICBC states that this is due to a much stricter classification of overdue loans. 33
According to the Bank of Thailand, this recent regulation of consumer credit was partly preventive, with a view to reducing systemic risks, and not aimed at restricting credit to households. The current regulation restricts the maximum credit limit to five times borrowers’ monthly income, 10% minimum payments, and cancellation of credit cards with outstanding debt exceeding three months. To prevent what were seen as excessively high interest rate charges, interest rates on consumer lending are now subject to a maximum of 28% (15% interest rate and 13% charges and fees).
34
See Jiang and McCauley (2004), Ma and Remolona (2005), Gyntelberg et al (2005), Jeanneau and Peréz Verdia (2005) and BIS (2002).
80
BIS Papers No 28
suggested that while traditional derivative instruments are widely used for risk mitigation, new credit risk transfer instruments, such as credit default swaps or asset-backed securities (ABSs), are sometimes used to take certain investment positions at a lower cost, or to provide services to clients, rather than to manage risks. To illustrate, in some countries foreign banks issue credit-linked notes acquired by domestic residents (typically banks); the reference is dollar-denominated debt issued by the host country. In this manner, foreign banks buy protection from domestic residents, paid for in advance. The credit-linked notes are an investment vehicle for domestic banks that thereby become exposed to counterparty and credit risk. 35 Another example is the use of cross-border ABSs denominated in foreign currency to finance the issuance of credit cards in Korea. Here, ABSs provided a way of accessing domestic and foreign financing on much cheaper terms than could have been obtained by issuing a bond in the domestic market. To illustrate how Korean ABS transactions were designed, Annex 1 discusses an ABS transaction securitising the credit card receivables of a major credit card company, LG Card. New credit risk transfer instruments raise a number of issues. First, how can the reallocation of risks associated with new instruments be systematically assessed and managed? In particular, does the possibility that these instruments could transfer risks towards emerging markets rather than away from them raise concerns? For example, while it could appear in Korea’s case that risk was transferred to foreign investors buying the ABS notes it is not clear how much cross-border risk-sharing actually occurred as Korea’s credit crisis unfolded. If foreign investors suffered any losses, these were not as widely reported as the considerable losses to Korean financial institutions. One could also ask whether prudential issues arise when financial institutions in emerging market economies become protection sellers through credit derivative instruments. These transactions increase domestic bank exposure to the sovereign and introduce a layer of counterparty risk. Second, does the design of some credit risk transfer instruments, and the insurance provided to investors, weaken rather than reinforce market discipline? In particular, does it reduce the incentive for diligent risk management by protection buyers or the issuer? Third, is the process (which might involve several parties engaged in a complex web of transactions) sufficiently transparent? Interbank markets Banks’ capacity to manage risks depends in part on how well the interbank market works. A particular concern is how vulnerable banking systems are to shocks that might reduce liquidity in the interbank market, as this could be an important channel for the spread of a crisis. In particular, in response to a shock (such as the failure of a major bank) banks might choose to withdraw liquidity from the interbank 36 market, triggering contagion. One questionnaire respondent noted that liquidity risk had risen with an increase in (bank) lending and household deposits. While risk was contained by a recently established deposit insurance system, stress testing suggested that banks could incur significant losses as a result of a crisis in the interbank lending market. Some perspective can be gained by reviewing the relative importance of interbank markets, and pressures on liquidity indicated by the volatility of interbank rates. To illustrate, Graph 7 (left-hand panel) provides an indicator of the relative size of interbank credit for a number of emerging market economies. As can be seen, there is a significant amount of cross-country variation, with Russia having the smallest relative interbank claims (by this measure) and Thailand the highest.
35
However, the risk rating of the counterparty might be higher than the sovereign’s. Credit-linked notes are used inter alia in the Philippines and Venezuela.
36
Systematic research on this topic has so far focused on the experience of some developed countries. For example, Furfine (1999) estimates bilateral exposures in the US federal funds market and attempts to determine the impact of a major bank failure on other banks (“domino effects”). Losses appear to be limited. Upper and Worms (2002) estimate domino effects in Germany, and find that there is a high degree of concentration in the interbank market; in line with this, domino effects can lead to significant losses from contagion. Gatev et al (2004) argue that liquidity in the interbank market might increase during periods of financial stress because investors shift funds from capital markets to their banks. Liquidity pooling effects (see reference to Kashyap et al (2002) in footnote 15) become particularly important during episodes of financial stress because the correlation between liquidity demands by depositors and borrowers becomes negative.
BIS Papers No 28
81
Graph 7 Share of interbank credit and interbank rates1 Share of interbank claims2
20
Brazil Thailand Russia Turkey
2000 1
2001
2002
2003
2004
2005
6
Interbank overnight rates
50 China (lhs) Thailand (lhs)
16
5
12
4
30
8
3
20
4
2
10
0
1
2000
2001
2002
2003
2004
2005
40
0
2
End of period. Measured as deposit money banks’ claims on other financial institutions as a percentage of claims on private sector and on other financial institutions. Sources: IMF; Datastream.
Interbank exposures might not fully coincide with activity in the short-term interbank market (eg they might reflect longer-term financing by development banks). To the extent that they do, however, the graph provides an approximation of differences in banks’ reliance on the interbank market for liquidity. 37 A small share of interbank claims might mean that banks find it too risky to extend credit to each other due to imperfect information, 38 deficiencies in payment systems or other unfavourable institutional arrangements. For example, depending on the financing instruments available, it might be relatively difficult to close a position, or secure immediate delivery of a security against payment. In some cases, high reserve or liquid asset requirements could discourage interbank market activity by limiting the availability of excess reserves (required liquid asset ratios are 25% (of deposits) in Hong Kong SAR and India and 20% in Saudi Arabia). 39 These various impediments to the liquidity of interbank markets could lower the resilience of the banking system in the face of liquidity shocks unless monetary authorities took offsetting measures. The low interest rates and ample liquidity prevailing in recent years have alleviated concerns about the availability of funding in interbank markets. However, even under such conditions, significant shocks to liquidity in the interbank market are possible, particularly as monetary policy tightens or as a result of other policy actions. 40 For example, recent press commentary has noted the very high volatility in interbank rates in Russia (Graph 7, right-hand panel), which could be related to concerns about how recent closures of poorly performing banks would affect liquidity. When China raised reserve requirements in 2003 in order to dampen money creation, banks anticipated further increases, causing liquidity in the interbank market to fall and the interbank interest rate to rise.
37
The availability of alternatives to interbank lending might also play a role. For example, when opportunities for extending credit to the private sector are strong the share of interbank lending might fall. This does not appear to be an important factor in Brazil or Russia, where the ratio is relatively stable, but the relationship might be more apparent if a broader measure of bank assets were used.
38
In a Stiglitz and Weiss (1981) framework, loan supply is backward bending. If information problems are sufficiently severe, there might be no equilibrium interest rate at which the market clears and no credit would then be supplied in the interbank market.
39
On the other hand, liquidity requirements reduce the scope for excessive risk-taking. Other factors that might affect relative size are extensive dollarisation, which might limit the demand for liquidity in domestic currency, and efficiency; eg the share of interbank claims in the United States (about 3%) would tend to be lower than in some emerging markets because liquidity management technology allows less reliance on interbank financing.
40
A recent study on operating procedure found that unexpected government transactions with the central bank are an important source of shocks to liquidity in emerging interbank markets (Hawkins (2005)), whereas in more developed economies the central bank receives advance notice from the government and can take offsetting actions.
82
BIS Papers No 28
Two implications of imperfectly functioning interbank markets can be cited. First, banks might prefer not to implement transactions with each other but rather to do so with the central bank. Central banks should be aware that this can impair the development of effective liquidity management and of financial markets. Second, shocks can have significant distribution effects. When interest rates rise in some emerging interbank markets (eg Hong Kong SAR, Russia, Thailand), smaller banks might suffer from reduced liquidity while larger banks might profit, because the former are usually borrowers and the latter lenders in these markets. This has mixed implications for resource allocation and systemic stability. 41 Central banks have taken a number of steps to enhance liquidity in interbank and securities markets. For example, the Central Bank of Malaysia announced in early 2005 that it would use repos in the interbank market, thus encouraging their use to manage liquidity and reducing reliance on direct lending or the issuance of short-term bills. Liquidity is to be enhanced further through improved securities custodianship arrangements and the introduction of a securities lending facility to improve market-making. 42 Improvements in custodianship have recently also been implemented in the Philippines. Another measure to enhance liquidity has been to reduce high liquidity and cash ratios. For example, while liquidity ratios (requiring banks to hold, inter alia, government securities) were not binding in India for extended periods, they could become so with rising interest rates. Revisions to existing legislation were introduced in July 2005 to give the Reserve Bank of India leeway to adjust them as needed. 43
4.
Conclusion: has the health of the banking systems in emerging market economies improved?
The ability of banking systems to bear risks in the future will be determined in part by their financial health, current versus prospective. This can be assessed by examining information from bank financial statements (ie financial soundness indicators); by looking at stock market indicators; by relying on credit ratings of banks; or by reviewing composite indicators of bank vulnerability. In general, these current indicators suggest improvements in banking health, but as noted below, they must be interpreted with caution.
Financial soundness and market indicators The favourable economic conditions observed in recent years have been associated with significant improvements in indicators of banking performance: ROA and capital asset ratios have generally
41
See earlier discussion referring to Beck et al (2003) and Boyd and de Nicolo (2005) in footnote 30 on how the presence of large banks can increase the incentive to manage risks effectively but possibly select for riskier borrowers or projects. Thus, a shock that favours large banks could improve or worsen systemic stability. Resource allocation could worsen in either case if there are no substitutes for smaller banks which provide credit to underserved economic sectors. Relationships in the interbank market are also relevant, and have been studied by Cocco et al (2004). Using data from the Portuguese interbank market they find that: (i) borrowers with lower returns on assets (ROAs) and a higher proportion of NPLs are more likely to rely on relationship lending, illustrating the default risk and monitoring function of the latter; (ii) borrowers with more volatile liquidity shocks are more likely to rely on relationship lending with lenders who have less volatile liquidity shocks and also with whom they have less correlated shocks; (iii) borrowers are more likely to rely on lending relationships when they experience a larger imbalance in their reserve deposits (lending relationships as insurance); (iv) small borrowers are more likely to establish relationships and tend to choose larger banks as their preferred lenders (in line with the broader literature on relationship lending). As for pricing, the authors find that other things equal, larger banks borrow and lend at more favourable terms, while banks with higher ROAs lend at higher interest rates (higher opportunity costs). They also find that borrowers with higher NPLs tend to pay higher interest rates, and banks with better investment opportunities tend to be net borrowers.
42
For further details on recent initiatives to develop financial markets see, for example, Zamani’s and Sidaoui’s respective contributions to this volume.
43
In India, bank investments in government securities (under the Statutory Liquidity Ratio) fell to 36.3% of demand and time liabilities (still above the statutory requirement) at 8 July 2005 from 42.3% a year earlier.
BIS Papers No 28
83
risen, and NPLs have declined. 44 Recent stock price behaviour suggests that market sentiment towards banks in emerging markets has improved. In Asia, CEE and Latin America (excluding Argentina) bank stock prices have risen relative to overall stock prices in recent years (although more recently they have tended to decline: Graph 8, lower right-hand panel). This has occurred even in some markets where overall stock prices have risen significantly. In Turkey, for example, in the period between June 2003 and November 2005, a bank stock index rose 452% while the overall market index rose about 218%. 45 A similar, although somewhat less dramatic pattern has been apparent in India. Graph 8 Bank performance indicators Bank regulatory capital4
Return on assets China Other Asia1, 2 Latin America1, 3
99
00
01
02
03
04
05
00
01
20
1
17
0
14
–1
11
–2
Non-performing loans6
99
Other emerging markets1, 5
2
99
00
01
02
03
04
05
8
Bank stock prices7
02
03
04
05
23
140
18
120
13
100
8
80
3
99
00
01
02
1
03
04
05
60
2
Weighted average of the economies listed based on 2000 GDP and PPP exchange rates. Hong Kong SAR, India, 3 4 Indonesia, Korea, Malaysia, the Philippines, Singapore and Thailand. Brazil, Chile, Colombia, Mexico and Peru. As a 5 6 The Czech Republic, Poland, South Africa and Turkey. As a percentage of total percentage of risk-weighted assets. 7 loans. Relative to overall stock indices, 1995-2004 = 100. Sources: IMF, Global Financial Stability Report; CEIC; Datastream; Fitch Ratings; national data.
However, some of the preceding indicators need to be interpreted with caution. First, financial markets are often not liquid, and information problems can be particularly severe. Stock prices (or other instruments, such as subordinated debt) might not be fully representative of market forces, nor provide
44
Trends in banking sector performance in the Philippines and Thailand are respectively discussed in the papers by Guinigundo and Bank of Thailand in this volume.
45
This reflected the banking sector’s recovery from crisis. However, as discussed later on, ratings suggest that the banking sector is weaker than in the past.
84
BIS Papers No 28
a good guide to the underlying value of a firm (ie the expected stream of future earnings, adjusted for risk) but instead reflect the actions of a few investors or bandwagon effects. Second, listed banks may not be representative of the banking system. In China, for example, the state commercial banks are not listed on the domestic stock market (for this reason, this index is not shown). In Mexico, foreign banks now control about 80% of the banking system, and as a result many local banks have delisted from the local stock market. Market indices thus exclude the major banks in the financial system in these two countries: Chinese (A shares) and Mexican banks recently accounted for about 7% and 4% of total market capitalisation respectively. This is well below the 15% share of Korean banks and the 19% share of South African banks. Third, indicators based on financial statements (capital adequacy ratios) can be misleading because some emerging market economies do not follow international accounting standards and accounts are not properly audited. Supervision and regulation can also affect the usefulness of financial statements. In line with the preceding, Rojas-Suarez (2001) shows that the traditional measures of banking health most commonly used in industrial countries, such as the capital/asset ratio, have performed poorly as indicators of banking problems in Latin America and East Asia. A key issue is that, in the absence of adequately functioning markets for equity (or subordinated debt), banks will not be subject to effective market discipline. Rojas-Suarez proposes alternative measures of banking health, such as the implicit interest rate paid on deposits, the spread between lending and deposit rates, the rate of loan growth and the growth of interbank debt. She finds that the first two are especially effective as early warning indicators of banking problems in emerging market economies.
Bank ratings One difficulty with the preceding indicators is that it is not clear to what extent current measures of “good health” would survive a cyclical downturn. Perspective on this issue can be gained by examining the behaviour of bank ratings. Annex Table A7 shows long-term foreign currency (LTFC) and aggregate individual bank ratings (IR) by Fitch Ratings. LTFC ratings assess the capacity of banks to meet foreign currency commitments such as interest, preferred dividends or repayment of principal on a timely basis. Because these ratings reflect the possibility of government support they are often adjusted in response to changes in sovereign ratings. In contrast, individual bank ratings strip out 46 support and more closely reflect a bank’s underlying financial strength. The table reveals that both LTFC and individual ratings have improved significantly in a number of emerging market economies between 1999 and 2004. However, there are some notable exceptions, such as Argentina, Venezuela and Turkey, which experienced crises over this period. Ratings remain low overall, with LTFC ratings of 52 (BB) or lower, in several countries. 47 Broadly in line with the perception that long-run growth prospects in Asia and CEE are relatively favourable, LTFC ratings in these areas tend to be higher than in Latin America (an important exception is Chile). While LTFC ratings cannot be directly compared to individual ratings, the latter still convey a greater impression of weakness than the former. In particular, most individual bank ratings are lower relative to their maximum possible rating than are LTFC ratings. The discrepancies between LTFC and individual ratings are apparent in the cases of China, India, Korea, Philippines, Venezuela, Poland and Turkey. Thus, the credit risk of bank debt has fallen in emerging markets, but this is in large measure due to expectations regarding external (to the bank) support.
46
See Fitch Ratings (2004b). According to Fitch, individual ratings are only assigned to banks. These ratings, which are internationally comparable, attempt to assess how a bank would be viewed if it were entirely independent and could not rely on external support. They are designed to assess a bank’s exposure to, appetite for, and management of risk, and thus represent Fitch’s view on the likelihood of it running into difficulties such that it would require support. The principal factors Fitch analyses to evaluate the bank and determine these ratings include profitability and balance sheet integrity (including capitalisation), franchise, management, operating environment, and prospects. Finally, consistency is an important consideration, as is a bank’s size (in terms of equity capital) and diversification (in terms of involvement in a variety of activities in different economic and geographical sectors). Individual ratings range from “A” to “E”. In addition, gradations may be used among the five ratings: ie A/B, B/C, C/D and D/E.
47
As can be seen, however, in a number of the economies listed the LTFC ratings do exceed this threshold. As a caveat it may be noted that the number of banks included in each country can vary considerably.
BIS Papers No 28
85
Banking vulnerability BIS researchers have sought to derive composite indicators of banking vulnerability. Graph 9 illustrates the readings from the index developed by Hawkins and Klau (2000). 48 As can be seen, there has been a significant decline in indicators of banking vulnerability in all regions since the late 1990s. The results are broadly consistent with a set of macroprudential indicators also developed at the BIS and applied by Fitch Ratings (not shown) which indicates that there are few cases of large aggregate credit sector imbalances in emerging market economies at this time. 49 Graph 9 Banking sector vulnerability 9
9 1
Crisis-hit Asia Other Asia2 6
6
3
3 Latin America3 Central and eastern Europe4
0
96
97
98
99
00
01
02
03
04
05
96
97
98
99
00
01
02
03
04
05
0
Note: Increases in the index (expressed as a weighted average, based on 2000 GDP and PPP exchange rates of the economies in each group) imply an increase in risk. The index ranges from 0 to 10 (maximum risk). 1
2
Indonesia, Korea, Malaysia, the Philippines and Thailand. China, Hong Kong SAR, India, Singapore and Taiwan 3 4 (China). Argentina, Brazil, Chile, Colombia, Mexico, Peru and Venezuela. The Czech Republic, Hungary, Poland, Russia and Turkey. Source: Hawkins and Klau (2000).
To conclude, we have reviewed changing macroeconomic risks, new forms of risks faced by banks, risk management capacity and banking health. This review has been based on central bank responses to a questionnaire as well as statistical indicators of macroeconomic and financial conditions. It is apparent that there have been significant improvements in the ability of banking systems in emerging markets to deal with shocks and manage risks in the current cycle. Some changes - both macroeconomic and in risk management capability - appear to be structural and will apparently persist through the cycle. At the same time, however, significant weaknesses in emerging market banking systems still need to be overcome.
48
The index is based on increases in the ratio of domestic credit (to the private sector) to GDP; increases, in per cent, in the liabilities to BIS reporting banks; liabilities to BIS reporting banks (vis-à-vis the banking sector) as a percentage of domestic credit to the private sector; the three-month interest rate less the annualised change, in per cent, in consumer prices over the previous six months; and the average credit rating of banks.
49
Fitch Ratings (2005), using the methodology of Borio and Lowe (2002).
86
BIS Papers No 28
Annex 1: Implications of cross-border ABS transactions backed by credit card receivables: the example of LG Card 50
A large proportion of the credit card business in Korea has been financed by the issuance of ABSs backed by credit card receivables. To illustrate, at the end of 2002, LG Card, then the largest credit card company in Korea, relied on ABSs for a significant proportion of its total financing. According to Fitch (2003) the large Korean commercial banks held significant amounts of ABSs linked to LG Card. Commercial banks and other domestic and foreign investors participated in financing the outstanding ABSs. An example of the structure of this type of financing is provided by a cross-border ABS transaction executed by LG Card. This involved the creation of a special purpose entity, Credipia 2001, a company organised under Korean law (“Korean (Issuer)” in the graph) solely for the purpose of issuing USD 500 million in floating rate guaranteed notes. While the structure of this ABS transaction shares many features with other such operations, an interesting characteristic was that the transaction was registered with the Financial Supervisory Commission in order to benefit from protection offered by local legislation (the Act on Asset Backed Securitisation). In this context the following questions are of interest. First, what were the advantages of the transaction? Second, how did its design allocate risks? Third, who absorbed the losses? Fourth, what issues does this episode raise? Advantages of the transaction. For investors, the transaction provided an opportunity to diversify investments by offering an investment grade asset. For LG Card, the cost of financing was apparently much lower, as reflected in the wide spread between the interest rate paid by credit card holders (17-23%) and the favourable yield on the ABS note (corresponding to the Aaa Moody’s rating). These advantages presumably account for the large share of credit card business funded by ABSs, as noted above. Allocation of risks. The institutional arrangements illustrated in the graph were designed to ensure payments even in the event of default by credit card holders or LG Card. The risk faced by investors was mitigated by a protection seller, FSA (“Guarantor”, in the graph), a New Jersey-based firm. FSA guaranteed full and timely payments on interest and payment on the principal on the note at par by the final maturity date, and also guaranteed payment on the swap. A supplementary guarantee was also offered by Credipia 2001 (Jersey) limited, which provided security protection for note holders because Korean law forbids a direct security interest in the issuer’s assets by anonymous note holders. Risks faced by the investor were further mitigated by the structure and credit enhancement features of the transaction, which gave the note holders in this transaction preferential treatment in the allocation of credit card receivables: •
The note was secured by collateral; this was the pool of credit card receivables backing the investor interest issued by a trust (the trustee was Kookmin Bank).
•
Investors received credit support in the form of 15% subordination by the subordinated seller 51 interest (LG Card).
•
There were rapid accumulation triggers in case the portfolio deteriorated. In normal times, principal payments were to be deferred for four and a half years (“revolving” period in which only interest payments were made on the investor interest and fees were paid). Payments would then accumulate for six months to cover principal (“controlled accumulation period”). However, if the servicer or originator defaulted, a period of rapid accumulation would be triggered. Principal collections would instead be used to pay down the investor interest held by the issuer.
50
A macroeconomic overview of Korea’s credit card crisis and associated macroeconomic effects is provided in a box in Mohanty et al’s contribution to this volume. Discussion of the structure of the ABS transaction is based on Moody’s (2001).
51
For a discussion of subordination in ABS transactions see Isaka et al (2005).
BIS Papers No 28
87
•
Risks were further controlled by the structure and by adjusting the location of principal collection payments. Thus, the claim on the credit card loan pool was transferred by LG Card to the special purpose entity. Also, the type of triggers determined where principal collections would accumulate; at the trust level if portfolio performance deteriorated, at the issuer level if LG Card itself breached triggers.
Who absorbed the losses? Once the crisis unfolded and LG Card was unable to service its debts, costs were absorbed by its major creditors, who agreed to swap existing loans into equity followed by a capital reduction that would lead to recognition of losses; and by banks (both commercial and policy), which injected new capital into the company. The result was that almost all LG Card ownership switched to its major creditors, with government-owned Korea Development Bank acquiring a 25% ownership share. It is less clear to what extent other domestic or foreign investors absorbed any losses. However, it is noteworthy that after a period in which no ABSs were issued, the market appears to have revived in 2005. Losses have not been reported by the New Jersey-based protection seller, FSA. In its 2003 Annual Report, FSA stated that it had discontinued offering guarantees in Korea, but that its outstanding transactions were performing and that it expected opportunities in the Korean market in the future. Korea was not mentioned in FSA’s 2004 Annual Report. Issues raised. Three issues may be highlighted. First, the extent to which the ABS structure is conducive to market discipline. It is apparent that the ABS structure was a very effective device for obtaining financing for activities that proved to be very risky after the fact. Second, transparency. Given the complexity of the transactions and the number of participants involved, it is difficult to tell whether pricing fully accounted for risk exposures, and the incentives for effective risk management. Also, at least one rating agency reported in early 2004 that it could not quantify ABS losses because details on those holdings were not available on a consistent basis (Fitch Ratings (2004)).Third, what prudential arrangements could be introduced to reinforce market discipline and help prevent crises.
88
BIS Papers No 28
Annex tables
Table A1 Volatility indicators1 Standard deviation of annual changes, in per cent
Real GDP
Consumer prices
Real effective exchange rate
Bank credit to the private sector as a percentage of 2 GDP
1995-99
2000-04
1995-99
2000-04
1995-99
2000-04
1995-99
2000-04
Latin America Argentina Brazil Chile Colombia Mexico Peru Venezuela
5.1 1.7 4.4 3.6 5.2 3.9 4.7
8.6 1.9 1.4 1.2 2.8 1.9 10.8
1.7 26.5 1.9 4.1 9.5 3.2 29.2
11.4 3.5 1.1 1.3 2.1 1.5 7.1
5.8 17.5 5.3 8.4 19.6 7.4 18.5
25.9 9.1 6.1 8.5 8.1 4.2 13.7
4.7 16.2 1.9 10.9 26.7 10.5 27.3
12.1 1.8 2.3 5.6 11.7 2.5 20.0
Asia, large China India Korea Taiwan, China
1.4 1.1 6.8 0.9
0.9 1.6 2.3 3.3
7.7 3.2 2.4 1.5
1.7 0.2 0.7 0.9
6.5 4.8 14.2 3.7
4.4 3.2 5.3 4.4
4.6 4.9 4.8 1.9
5.5 7.5 5.9 6.1
Other Asia Indonesia Malaysia Philippines Thailand
8.8 7.2 2.6 7.7
0.5 3.2 1.5 1.8
21.9 1.1 1.5 2.9
3.5 0.3 1.6 0.7
34.0 9.8 9.7 8.5
11.1 4.7 3.7 2.9
31.6 9.9 21.0 13.5
9.8 5.9 2.8 6.3
Central Europe Czech Republic Hungary Poland Russia Israel Turkey South Africa
3.1 1.7 1.2 4.8 1.7 4.9 1.4
1.1 0.9 1.9 2.1 3.6 6.8 0.6
3.3 7.2 7.9 73.9 2.8 11.1 1.4
1.8 2.3 3.7 4.6 2.4 19.3 2.8
4.9 3.6 4.5 28.2 4.3 3.0 5.8
5.3 4.6 9.4 6.8 6.2 12.0 18.9
5.4 9.5 8.3 32.2 2.6 15.6 3.1
12.1 7.2 4.3 9.1 6.0 22.4 7.3
Memo: United States Euro area Japan Canada New Zealand Norway
0.8 0.5 1.8 1.5 1.5 2.0
1.4 1.2 1.3 1.4 1.2 0.9
0.6 0.6 0.8 0.4 0.6 0.5
0.7 0.1 0.4 0.4 1.2 0.4
4.5 4.9 10.4 2.1 1.9 8.0
5.2 8.2 6.5 5.2 5.1 9.9
1.5 2.3 2.9 5.5 5.5 1.7
2.2 1.4 1.1 2.4 4.9 1.9
1
Based on annual data.
2
For China, credit to sectors other than central government and non-bank financial institutions.
Sources: IMF; national data; BIS.
BIS Papers No 28
89
Table A2 Credit exposures, deposit-taking institutions
Argentina Chile Colombia Mexico Venezuela Hong Kong SAR India Indonesia Korea Malaysia Thailand Czech Republic Hungary Poland Israel Saudi Arabia Turkey 1
Residential real estate loans as a percentage of total loans
Commercial real estate loans as a percentage of total loans
Large exposures as a percentage of capital
Exposures to connected parties as a percentage of capital
1994
1999
2004
1994
1994
1994
1999
2004
12.4 23.1 13.7
16.7 32.5 13.4
20.2 12.0 7.4
13.9
5.7 14.3
1.4 13.0
20.0
42.9 20.0
25.7 20.0
1999
2004
10.0 18.9
24.8
4.5
4.5
4.2
0.1
15.8
5.4 24.1 25.9
0.1 21.1 8.7
2.4 7.0 18.4
19.2 18.1 18.7
11.0
1.6 10.6
3.6 3.2 10.2 125
1999
2004
159
93
10.0
10.0
175
101 38.1
253 124
137 96
47 1
0.0
10.3
8.8
5.3 11.8
Refers to 2000.
Source: Central banks.
Table A3 Banks’ holdings of securities1 Money market securities
Argentina Chile Colombia Mexico Venezuela Hong Kong SAR India Indonesia Korea Malaysia Thailand Czech Republic Hungary Poland Israel Saudi Arabia Turkey 1
1994
1999
2004
1.9 82.1 34.4
0.12 17.1 2.3 83.3 12.5
0.07 17.0 1.6 95.8 29.9
0.1 1.6
0.8 0.6
57.9
2.5 6.7 64.1
0.7
0.9
Bonds
Equities
1994
1999
2004
4.6
0.10 0.7 4.5
0.10 7.2 17.0
1994
Other
1999
2004
0.05
0.02
1.2 17.9
0.2 16.7
0.9 4.2
0.2
0.3
0.6
3.6
0.0 3.4
0.2 2.6
0.9 2.3 0.2 5.4
0.9
0.0 1.3
0.0 2.6
0.3
1.9
1.4
0.8
8.8
20.9 18.8
24.7 18.0
0.3 2.2 5.1 66.5
11.6
14.6 16.5 13.2
43.9 12.8 15.8 16.1
5.1
3.2 0.4 5.1
1.3
9.7
14.3
30.7
0.3
1.4
1994
1999
2004
0.6
3.5
4.4
5.0 5.9
4.3 8.6
18.0 18.6
6.2
54.9
As a percentage of total assets.
Source: Central banks.
90
BIS Papers No 28
Table A4 Equity and exchange rate risks Net open position in equities as a percentage of capital 1994 Argentina Chile Colombia Mexico Venezuela Hong Kong SAR India Indonesia Korea Malaysia Thailand Czech Republic Hungary Poland Israel Saudi Arabia Turkey
1999
2004
0.47
21.0
Net open position in foreign exchange as a percentage of capital 1994
1999
2004
0.18
68
2.7
–5.4 5.1
57 0.0 –3.2 6.1
3.3 2.3
7.4 5.6 3.0
6.1 –1.6 0.9
27.0 1.5 0.4
–64.9
–0.4
0.8
41.9
20.5
6.5
0.3 12.8
Source: Central banks.
Table A5 Bank liquidity
Argentina Chile Colombia Mexico Venezuela Hong Kong SAR India Indonesia Korea Malaysia2 Thailand Czech Republic Hungary Poland Israel Saudi Arabia Turkey
Customer deposits as a percentage of total (noninterbank) loans
Required liquid asset ratio,1 in per cent
Liquid assets as a percentage of total assets
Liquid assets as a percentage of liquid liabilities
1994
1994
1994
1999
2004
1994
1999
2004
24.4 9.0
6 22.9 12.6
15 21.5 29.3 28.0 18.4 28.0 42.7 23.5 39.5
28.0 252
34 26.7 240 32.8 54.1
50 25.4 661 37.0 23.4 52.3
19.2 133
32.9 115
104 74.1 37.8 38.7 53.3 49.0
95.0 45.9 53.1 28.2 42.5 65.0
1999
2004
96
120
86 97 98
104 210 172 116 190 177 96 120
135 175 208 179 172 172 88 122
125
153 162 139 123
161 92 136 121
106 94 266
115
155
124
2004
21.6 25.0
25.0
25.0
100
100
17
20.0
1
1999
24.8 21.4 41.9 19.6 51.4
9
20.0
20.0
13.6 0.0 32.6
84.4
18 19.5 37.5 18.2 40.2 32.1 34.0
32.8 21.9 26.1 29.4 27.5 41.6
17.5 0.0 59.0
Defined as the ratio of liquid assets to total assets except for Korea (defined as liquid assets to liquid liabilities). shown refer to commercial banks.
2
Data
Source: Central banks.
BIS Papers No 28
91
92
Annex Table A6 Hedging or credit risk transfer instruments Exchange rate/ interest rate risk Hong Kong SAR
Y/Y
India
Y/Y
New financial instruments
Exchange-traded Y
Indonesia
Government-supplied instruments
Notes
Y
N
Collateralised borrowing and lending obligation (a money market instrument to mitigate risk).
Y
Plain vanilla FRAs/IRS allowed, no caps/collars/floors.
N
N
Limited number of hedging instruments and limited liquidity.
Korea
Y/Y
Y
MBS market based on medium- and long-term mortgage loans has expanded recently.
No. Government promotes market. The March 2004 establishment of KHFC, which takes over and securitises medium-term mortgage loans from financial institutions, stimulated the MBS market.
Forwards, futures, swaps and options markets exist.
Malaysia
Y/Y
Y
Small but growing fast. Some ABSs backed by credit card receivables.
Residential MBSs (also Islamic).
Derivatives still in infancy in Malaysia but growing rapidly.
Philippines BIS Papers No 28
Credit-linked notes issued by foreign banks backed by government debt issued in foreign currency.
BIS Papers No 28
Annex Table A6 (cont) Hedging or credit risk transfer instruments Exchange rate/ interest rate risk
New financial instruments
Exchange-traded
Singapore
Y/Y
Y
CDSs, credit-linked notes, CDOs, CDO squared, first to default, nth to default, indexbased trades used to manage credit spread risk.
Thailand
Y/Y
Y
Some interest in credit derivatives, CDOs, structured notes.
Chile
Y/Y
Y
Colombia
Y/N
N
Mexico
Y/Y
Government-supplied instruments
Notes
N
Except for credit derivatives, new instruments used to provide service to clients and enhance yields, not for managing or transferring own risk. No. The Central Bank of Chile, independent from the government, can enter into currency swap contracts with banks for purposes of monetary regulation.
Exchange rate forwards are most important. Options are new.
Incipient derivatives market. Y
N
Use of interest rate swaps and futures is increasing.
93
94
Annex Table A6 (cont) Hedging or credit risk transfer instruments Exchange rate/ interest rate risk Venezuela
N/N
Exchange-traded N
New financial instruments
Government-supplied instruments
Credit-linked notes backed by government debt issued in foreign currency.
Notes CLNs. Banks sell to domestic residents in local currency. Reduce interest rate mismatch but create currency mismatch. Small and OTC. Underdeveloped. Some unsuccessful attempts to offer instruments against foreign exchange risks.
BIS Papers No 28
Czech Republic
Y/Y
Y
Hungary
Y/Y
Poland
Y/Y
Y
Turkey
Y/Y
Y
Small credit derivatives, CDOs and ABSs.
Standardised instruments preferred in closing open positions because cheaper. Export Credit Insurance Ltd. Provides exchange rate risk insurance facilities for domestic exporters and travel agencies.
Interest rate derivatives market relatively shallow. Deep short maturity (to one week) foreign exchange swaps market (average daily turnover EUR 2 billion) modestly affects interest rate exposure. Moderate liquidity in standardised instruments. Banks often do back-to-back hedging with their parent.
Draft mortgage law to allow for MBSs.
Promotion and enabling regulation.
Turnover is low.
BIS Papers No 28
Annex Table A6 (cont) Hedging or credit risk transfer instruments Exchange rate/ interest rate risk Saudi Arabia
Y/Y
Israel
Y/Y
Exchange-traded
New financial instruments
Government-supplied instruments
Notes
No role except promotion of markets. Y
Structured products (deposits with yield linked to defined external changes in indices), credit derivatives (for investment).
Bank of Israel issues: shekel options, shekeldollar swaps, future treasury notes, repos.
Liquidity and volume are a concern.
Note: Exchange-traded instruments will generally include equities and commodities. ABSs: asset-backed securities; CDOs: collateralised debt obligations; CDSs: credit default swaps; CLNs: credit-linked notes; MBSs: mortgage-backed securities.
95
Table A7 Average ratings for major banks in emerging markets1 Fitch individual ratings
Fitch long-term foreign currency (LTFC) ratings
1999
2004
1999
2004
Argentina
42.5
0.0
51.1
8.7
Brazil
42.5
41.7
39.1
47.8
Chile
68.8
71.9
73.9
75.7
Colombia
25.0
43.8
56.5
52.2
Mexico
20.8
44.6
52.2
60.9
Venezuela
43.8
30.0
40.9
10.8
62.3
China Hong Kong SAR
65.3
India
61.7
77.4
74.6
25.4
56.5
0.0
28.4
43.5
Korea
12.5
47.5
Malaysia
43.8
34.4
62.0
Philippines
32.5
26.1
50.0
Singapore
67.5
75.0
Taiwan, China
53.6
34.1
67.1
5.0
25.0
59.8
Czech Republic
25.0
45.8
66.7
79.7
Hungary
50.0
37.5
69.6
80.4
Poland
43.8
25.0
69.6
73.9
Israel
62.5
41.7
73.9
68.1
4.2
27.9
10.9
45.0
Saudi Arabia
75.0
62.5
70.0
South Africa
66.7
57.5
64.3
Turkey
46.9
27.3
42.7
Indonesia
Thailand
Russia
63.8
87.0
70.0
85.5
1
End of period. Constructed according to a numerical scale, “0” indicates the lowest possible average rating and “100” indicates the highest possible average rating. Individual rating scale is A-E. Illustrative values: 11 approximately equals D/E, 72 is a shade below a B. Fitch Ratings long-term foreign currency rating scale is AAA-D. An LTFC score of 39 is about a B; a score of 86 is a shade below AA–. Sources: Fitch Ratings; BIS calculations.
96
BIS Papers No 28
References Bank for International Settlements (2002): “The development of bond markets in emerging economies”, BIS Papers, no 11, available at http://www.bis.org/publ/bispap11.htm Beck, Thorsten, Asli Demirguc-Kunt and Ross Levine (2003): “Bank concentration and crises”, NBER Working Papers, no 9921, National Bureau of Economic Research, Inc. Berger, Allen N (2005): “Credit Scoring and the Availability, Price, and Risk of Small Business Credit”, Journal of Money, Credit and Banking, vol 37, no 2, May, pp 191-222. Borio, Claudio and Philip Lowe (2002): “Assessing the risks of banking crises”, BIS Quarterly Review, December, available at http://www.bis.org/publ/qtrpdf/r_qt0212e.pdf. Boyd, John H and Gianni de Nicolo (2005): “The Theory of Bank Risk Taking and Competition Revisited”, Journal of Finance, vol LX, no 3, June. Brock, Philip and Liliana Rojas-Suarez (2000): Why So High? Understanding Interest Rate Spreads in Latin America, Inter-American Development Bank, Washington, DC. Cayazzo, Jorge, Socorro Heysen, Antonio Garcia Pascual and Eva Gutierrez (forthcoming): “Toward the effective supervision of partially dollarised banking systems”, in Eduardo Levy Yeyati, Adrian Armas and Alain Ize (eds), Financial Dollarization: The Policy Agenda, Palgrave McMillan, New York. Cocco, João F, Francisco J Gomes and Nuno C Martins (2004): Lending Relationships in the Interbank Market, manuscript, December. Diamond, Douglas W and Raghuram G Rajan (2003): “Liquidity shortages and banking crises”, NBER Working Papers, no w10071, October. Fitch Ratings (2003): LG Card: Another Blow for Korean Banks, but not Fatal, 26 November. Fitch Ratings (2004a): LG Card Rescue: A Burden on Creditors but Future Liabilities to be Capped, 14 January. Fitch Ratings (2004b): Bank Rating Methodology, 25 May. Fitch Ratings (2005): Assessing Bank Systemic Risk. A New Product, 26 July. Furfine, Craig (1999): “Interbank exposures: quantifying the risk of contagion”, BIS Working Papers, no 70, http://www.bis.org/publ/work70.htm. Gatev, Evan, Til Schuermann and Philip E Strahan (2004): “How do Banks Manage Liquidity Risk? Evidence from Equity and Deposit Markets in the Fall of 1998”, NBER Working Papers, no 10982, December. Gimbel, Florian (2005): “Hong Kong regulator plans bank stress-testing survey”, Financial Times, 19 November. Goldstein, Morris (2005): “What might the next emerging market crisis look like?” Working Paper no 05-7, Institute for International Finance, July. Goldstein, Morris and Philip Turner (2004): Controlling currency mismatches in emerging markets, Institute for International Economics, Washington, DC. Gyntelberg, Jacob, Guonan Ma and Eli Remolona (2005): “Corporate bond markets in Asia”, BIS Quarterly Review, December. Hawkins, John (2005): “Globalisation and monetary operations in emerging economies”, in Globalisation and monetary policy in emerging markets, BIS Papers, no 23, available at http://www.bis.org/publ/bppdf/bispap23c.pdf. Hawkins, John and Marc Klau (2000): “Measuring potential vulnerabilities in emerging market economies”, BIS Working Papers, no 91, available at http://www.bis.org/publ/work91.htm. Inter-American Development Bank (2005): Unlocking credit. The Quest for Deep and Stable Bank Lending, Economic and Social Progress in Latin America, 2005 Report, Inter-American Development Bank and Johns Hopkins University Press, Washington, DC.
BIS Papers No 28
97
Isaka, Naoto, Kazuhiko Ohashi and Makoto Saito (2005): Originators’ subordination as instruments to mitigate adverse selection: Evidence from asset-backed securities issued in Japan, manuscript, October. Jeanneau, Serge and C Pérez Verdia (2005): “Reducing financial vulnerability: the development of the domestic government bond market in Mexico”, BIS Quarterly Review, December. Jiang, Guorong and Robert McCauley (2004): “Asian local currency bond markets”, BIS Quarterly Review, June. Kashyap, Anil K, Raghuram Rajan and Jeremy C Stein (2002): “Banks as Liquidity Providers: An Explanation for the Coexistence of Lending and Deposit-Taking”, Journal of Finance, American Finance Association, vol 57(1), pp 33-73. Levine, Ross (1997): “Financial Development and Economic Growth: Views and Agenda”, Journal of Economic Literature, vol 35, no 2, pp 688-726. Ma, Guonan and Eli Remolona (2005): “Opening markets through a regional bond fund: lessons from ABF2”, BIS Quarterly Review, June. Merchant, Khozen (2005): “RBI warns on credit card strategy”, Financial Times, 24 November. Moody’s Investors Service (2001): International Structured Finance Pre-Sale Report, Credipia 2001 Limited, US$ [500,000,000] Floating Rate Guaranteed Notes Due [2007] Korea-ABS. Rojas-Suarez, L (2001): “Rating banks in emerging markets: what credit agencies should learn from financial indicators”, Working Paper no 01-6, Institute for International Economics, Washington, DC. Stiglitz, Joseph and Andrew Weiss (1981): “Credit Rationing in Markets with Imperfect Information”, American Economic Review, vol 71(3), pp 393-410. Topping, Simon (2005): “Improving the Management of Risk Through Implementation of Basel II”, speech at ACKHK the Financial Markets Association Basel II Seminar, Grand Hyatt Hotel, Hong Kong SAR. Upper, Christian and Andreas Worms (2002): “Estimating Bilateral Exposures in the German Interbank Market: Is there a Danger of Contagion?”, Discussion paper 09/02, Economic Research Centre of the Deutsche Bundesbank, February.
98
BIS Papers No 28
Is financial stability policy now better placed to prevent systemic banking crises? Agustin Villar
Introduction Widespread bank failures have severe implications for the economy. Wherever the banking system collapses, output falls sharply and the economy takes a long time to recover (Honohan (1996)). Moreover, bank failures build up political pressures for the government to intervene and rescue banks; in some instances political imperatives have replaced economic efficiency and led to the nationalisation of the banking system (Brock (1992)). Furthermore, banking crises have often occurred in conjunction with balance of payments crises (Kaminsky and Reinhart (1995)). This is nowhere truer than in emerging market countries, where banks remain at the centre of the financial system. For all these reasons, it is of utmost importance to build up a sound and stable banking system. The first section of this paper introduces the case for and elements of a financial stability policy. The second looks at the issue of bank risk-taking and the way in which supervisory oversight deals with it. The third section summarises deposit insurance practices across countries, and the last provides an overview of responses to the operation of a lender of last resort.
1.
Banks and financial stability
Banks are central to the working of a monetary economy. They play a crucial role in the provision of transaction services and the administration of a country’s payment system; they are the natural suppliers of liquidity to firms and households; and they are a main conduit for monetary policy (Corrigan (1982)). The prominent role of banks in a monetary economy ensures that bank failures and in particular those that happen in tandem - carry real consequences. Banks’ balance sheets are unique in their financial structure. Banks issue liquid, nominally valued liabilities, many of which are payable on demand at par, and they mainly acquire assets that are illiquid, relatively difficult to value, and of longer maturity than their liabilities (Lindgren et al (1996)). Most businesses do not carry the degree of leverage that banks show in their balance sheets. 1 This comparatively high leverage ratio originates in the role that banks play in the transformation of debt issued by firms and other borrowers into demand deposits, saving deposits and other assets demanded for households. 2 A thorough understanding of the risks that arise from banks’ operating environment, and the risk transformations that take place in their balance sheets, is critical for the design and implementation of financial stability policies in banking systems. Goldstein (1997) asserts that banks in emerging economies face relatively high credit and market risks; and that there have been several instances when banks (or banking systems) have suffered from an undue degree of risk concentration. The structure of the economy (eg taste, technology, endowments and the nature of shocks) might place some constraint on the scope for risk diversification in emerging economies; but bank failures are also the result of inadequate risk-taking, weak or negligent management and fraud. Maintaining adequate levels of capital can help to overcome some of these difficulties.
1
This assertion should be qualified. Commercial firms that show a debt/equity ratio in excess of two and a half would normally receive a speculative credit rating. By contrast, in the case of banks a ratio of 10 is considered highly conservative. For more details see Dewatripont and Tirole (1994), Table 2.3, page 23.
2
Although other financial intermediaries are growing, their size and dynamism have not yet challenged the central role of banks in emerging economies.
BIS Papers No 28
99
Macroeconomic volatility and capital Although emerging economies are exposed to large shocks, the succession of banking crises during the last 30 years suggests that fundamental bank weaknesses have been severe. In fact, they have often been too severe to be solved by a turnaround in the economy, implying that the underlying structural problems also need to be addressed. Nevertheless, BIS (2005) notes that cyclical factors have contributed considerably to the recently improved banking sector performance. The main channel identified is the increased ability of governments to support banks. Dealing with macroeconomic volatility is a priority to strengthen banking systems, and some progress has been made in this regard. A stable fiscal policy contributed to the supply of long-term funding to the financial system in Chile, and the stabilisation of the economy was a crucial factor in the recovery of banks in Mexico (See contributions by Moreno, by Betancour, De Gregorio and Jara and by Sidaoui in this volume). Other factors can also play a role. First, a large foreign bank participation helps to shift abroad part of the economic losses of an adverse domestic shock. However, foreign banks can become a channel of transmission of foreign shocks to the domestic economy, and their presence can also threaten the solvency of domestic banks. The country experiences reviewed in Sidaoui, Betancour et al and Pesce provide some support to the idea that foreign banks have contributed to a more competitive business environment. Second, capital markets or other markets can help mitigate credit risk. For example, banks exposed to booming housing prices can sell bonds secured by those loans. A difficulty here has been the relatively small size of capital markets in emerging economies, although this might now be 3 changing. The paper by Zamani in this volume provides an explanation of how policy has sought to develop a diversified financial landscape. Third, the holding of higher levels of capital can compensate for a more volatile operating environment. In particular, capital provides a greater safety margin in the event of shocks and reduces the likelihood of bank failure. Other channels are discussed below. While 10 years ago banks in emerging economies - with several notable exceptions - chose not to raise capital ratios with this end in mind (Goldstein (1997)), more recently bank capital ratios have risen in several emerging economies (BIS (2005)). Graph 1 presents bank capital ratios for different regions and their relationship to macroeconomic volatility. Graph 1 Macroeconomic volatility and risk-weighted capital ratios A. Volatility of inflation1, 2
B. Volatility of real GDP growth1 16
● Latin America (2004) ■ Crisis-hit Asia (2004)
● Latin America (2004) ■ Crisis-hit Asia (2004) 14
14
◆ United States (2004) ◆ United States (1995) Latin America (1995)
Crisis-hit Asia (1995)
●
◆ United States (2004) ◆ United States (1995) ● Latin America (1995)
12
■
Crisis-hit Asia (1995)
12
■
10 0
2
4
6
8
10
Risk-weighted capital ratio
16
10 0
2
4
6
8
10
Note: Unweighted averages of Argentina, Brazil, Chile and Colombia for Latin America, and Indonesia, Korea, Malaysia and Thailand for Asia. 1
Volatilities are averages of the periods 1995–99 and 2000–04.
2
Measured as the annual change in consumer prices, in per cent.
Sources: Central banks; IMF and IMF staff estimates; national data.
3
For further discussion of issues raised in this paragraph see background notes for this meeting: “Banks and aggregate credit: what is new?”, “Changing nature of risks facing banks” and “Privatisation, consolidation and the increased role of foreign banks”. See also Goldstein and Turner (1996).
100
BIS Papers No 28
Incentives for risk-taking and capital Another consideration is imperfect information and its impact on the structure of banks’ balance sheets. This structure would not matter in a world where shareholders, depositors and borrowers shared perfect information about all aspects of the economy. 4 In this world, banks’ portfolios would just replicate the market portfolio and the constellation of risks in the portfolios would be that of the underlying economy. In the real market, however, if banks wish to undertake riskier projects they are likely to pay higher interest rates to compensate depositors for greater risks. Avery et al (1988) and Park (1995) find evidence that wholesale bank depositors can demand higher interest from banks that undertake riskier ventures. But there is no evidence that small depositors behave in this way. Monitoring bank managers is costly. Small depositors do not normally have the necessary capabilities, either to collect and analyse information or to intervene in bank management, and they might not have the incentive to do so. However, small depositors would expect to benefit from the information collected by other depositors on banks’ activities. There is a serious free-rider problem here. Moreover, because depositors or other small creditors share the same incentives, the information produced as part of the monitoring of banks’ activities would be of limited use in helping to reveal their underlying risks. 5 In the presence of information asymmetries, the structure of capital is a key determinant of bank performance. Because it affects the behaviour of different claimholders (eg management, equity holders, depositors, etc) capital is key to solving the incentive problem that they have. In particular, equity holders fear that the decisions taken by firms’ management might have a negative impact on their wealth. A higher capital (or equity stake) has the potential to encourage equity holders to monitor firms’ management more effectively. Capital could also enhance bank resilience in the event of contagion or spillover. For example, claims on banks normally make up a large proportion of the wealth of households and, in the event of doubts about the soundness of a bank, small depositors might well be inclined to withdraw deposits. This can discipline managers who behave imprudently (Calomiris and Kahn (1991)). To the extent that the interbank market works properly, the movement of deposits between banks could provide peer assessments on banks’ risk profiles. But if deposits leave banks, this may also lead to bank runs spreading amongst banks that share certain similarities (eg line of business, geographic areas or ownership) or even to an indiscriminate run on banks. Moreover, banks share a large proportion of transactions amongst themselves on a daily basis. Changes in the liquidity position of one (large) bank would affect the financial position of all its counterparties and cause system-wide financial instability. This is often referred to as the “too big to fail” dilemma, but it may be not only size-dependent but also “context-dependent” (Freixas et al 6 (1999)).
2.
Prudential regulation and supervisory oversight
While banks are vulnerable to a variety of shocks, it is important to bear in mind that one of their key functions is to pool credit risks by diversifying their portfolios. Banks are thus a conduit for better risksharing in the economy. 7 However, risk pooling by banks does not make risk disappear. Indeed, if banks do not manage risk correctly it may even lead to its concentration where diversification is low.
4
This is normally referred to in the literature as the Modigliani-Miller theorem. See Modigliani and Miller (1958).
5
Grossman and Stiglitz (1980). The argument hinges on the inability of depositors to observe a clear signal in the actions of managers. Some argue that forcing bank management to disclose more and better information about operations restores market discipline (Caprio and Honohan (2004)).
6
See discussion of interbank markets in the background note for this meeting “Changing nature of risks facing banks”.
7
Such pooling also allows banks to specialise. Part of the benefits of this accrue to firms. The benefits are large in terms of economic welfare as financial deepening is positively associated with economic growth and development.
BIS Papers No 28
101
The correct assessment of risk in bank portfolios is therefore crucial to preserving the stability of the banking sector. But better risk management has not always been a priority for policymakers. Banks might allow an urgent “need” to generate revenue (Sheng (1996)) to cause them to act imprudently, aware that it is costly to monitor their activities and in the expectation of a bailout should the worst happen. Sprong (1990) asserts that control of banking risks becomes a way of limiting claims on deposit insurance and thus making such insurance workable. Some time ago Rojas-Suarez and Weisbrod (1996) observed that internal incentive systems for risk management were not a priority for supervisors. From another viewpoint, Barth et al (2002) suggest that bad design of regulation and supervision weakens incentives to manage risks well. Recent crises appear to have increased awareness of the importance of policies to improve risk management in banks in emerging markets. On the basis of the questionnaire responses summarised in the Table in Appendix A, the following three sections discuss how prudential regulation and the supervisory framework try to enhance risk management. 8
Risk concentration and connected lending In most emerging economies there is regulatory action to prevent risk concentration in bank portfolios. Quantitative limits on lending to a single borrower, 9 on holdings of securities, and on lending to related parties are commonly applied. In general, risk concentration is defined as a percentage of bank capital; although in Latin America lending limits are reported as a share of a borrower’s net worth. The lending limit for loans to a single borrower is commonly set at 25% of bank capital, although there are countries where it is below this percentage (eg India and Venezuela). In some exceptional cases, the limit is as high as 40% of bank capital. In other countries total lending to large borrowers is limited to a certain multiple of bank capital (between five and eight times) or a share of the loan portfolio (half). Investments (eg private equity holding or placement of securities) are generally excluded from the limit to a single borrower and are subject to lower limits. For several countries it is not clear whether government borrowing from banks is subject to the same limits. Lending to related parties or controlling interests is commonly permitted but subject to limits. Only a few countries do not allow it at all. These limits are generally tighter than those set for any single borrower but they have been set at the same level in a few cases. In several countries lending to controlling interests must be disclosed. In Malaysia and Venezuela, lending to related parties or controlling interests is forbidden. Bank supervisors monitor large exposures on a regular basis; credit registries and on-site examination are a critical element. It is not clear whether this is consistent across different supervisory authorities, but most countries report on-site inspections at least once a year.
Credit quality In recent years, credit quality has become an area in which banks in emerging economies can show improvement in risk management. In some cases, regulators have provided guidelines or formal instructions for the way bank lending activities should be conducted. Today it is very often the case that banks in most emerging economies have proper loan approval processes and credit committees overseeing the implementation of their lending policies. This was not the case some years ago. But there are still problems. Liberal reporting and treatment of non-performing loans and renegotiated debt remains a problem. An adequate loan classification requires that the debtor’s financial position be considered, comprising an assessment of its net worth, cash flow, collateral and payment history. 10
8
What follows concentrates on credit risk, which is the main source of risk for banks in emerging markets. See background note “Changing nature of risks facing banks”.
9
Across most economies there is a broad definition of borrower: a single person or firm, or a group of them with economic links deep enough to make them economically dependent on each other.
10
Goldstein (1997) argues that these should be the main elements of credit analysis.
102
BIS Papers No 28
Chile is the only country reporting that banks classify loans according to the credit rating of the borrower. In Hong Kong SAR and Singapore, credit and collateral analysis are fully incorporated into loan classification. But in many countries the main criterion remains the repayment of loans. At least three countries report that asset quality plays a central role in their supervisory assessment of banks. This is achieved by application of the CAMEL methodology 11 in Chile, Hong Kong and Korea. For other countries it is not clear to what extent the bank examination process fosters a better assessment of a bank’s lending policy. However, a number of countries conduct off-site examinations of bank loans and makes use of centralised credit registries, whereby information about banks’ loan portfolios is reported on a monthly basis. At least eight countries report having such registries in operation. Overall, there appear to have been significant improvements in policies to assess asset quality but there are still relatively large gaps relative to best practices. 12
Loan loss provisions Provisioning rules are a meaningful way to manage risks when the value of assets does not carry a market price. However, loan provisioning is still mostly dependent on actual loan repayments and does not take into account the current repayment capacity of borrowers and their past behaviour. Loan provisions based on actual repayments may thus encourage “evergreening” of bad loans. Several countries also report that they apply provisioning rules that differentiate between several types of loans with possible negative implications for asset quality. In only a handful of emerging economies do banks apply portfolio models to compute loan loss provisions based on the statistical properties exhibited by such portfolios. In these cases, loss provisions are related to the expected loss in a loan portfolio. In general this approach applies to relatively large and diversified parts of the loan portfolio; most notably, mortgage and consumer lending. As discussed further in a companion background note for this meeting, 13 the application of portfolio model techniques to estimate the need for loan loss provisions requires histories of portfolio performance and information about the distribution of risks amongst the universe of borrowers. In emerging economies, lack of information and structural changes make this a difficult task. To this end, credit registries could make a central contribution to the assessment of credit risk. In general, supervisors hold veto power on the implementation of portfolio methods for the computation of loss provisions or they retain the power to demand greater provisions if they do not agree with the model results.
Banks and capital regulation The regulation of capital and its oversight by supervisors are important components of financial stability policies in a market economy. Demanding more capital for greater risk-taking aligns shareholders’ incentives with the interests of less informed creditors. The regulation of capital in the banking industry must then balance two objectives: (i) allowing for a healthy and competitive banking system; while (ii) providing an incentive scheme that brings greater discipline to the way banking activity is conducted. Any regulation on capital faces the challenge of ensuring compliance. Moreover, how to deal with a generalised undercapitalisation of the banking sector remains a sensitive issue. The regulation of capital in banking systems in emerging economies has evolved over the last 10 years. Nowadays, it is fast converging to the standards in existence amongst industrial economies. In a list of 16 emerging economies, all have adopted a regulatory approach that follows the standard
11
A bank examination methodology that rates banks based on their capital adequacy, asset quality, management, earnings and liquidity.
12
Kane (1995) highlights the constraints that poor information systems have placed on efforts to exercise due diligence in granting new loans and monitoring outstanding ones.
13
“Changing nature of risks facing banks”.
BIS Papers No 28
103
set in the Basel Capital Accord of 1988. 14 This convergence in regulatory frameworks in emerging economies is quite remarkable. What are the reasons? On the one hand, this is the outcome of national experimentation with different forms of banking regulation rather than the result of a supranational agreement as was the case for the large industrial economies. The degree of economic and financial integration between those economies in providing an incentive to seek a common capital framework should not be underestimated. The impulse for convergence might also have come from several other forces: capital markets searching for a familiar approach, oversight by rating agencies, peer pressure, or “beauty contests”. On the other hand, the development of supranational standards in the late 1990s and a related voluntary assessment process might have made governments aware of the need to revise their 15 own national frameworks. One consequence of convergence is that differences in the regulatory framework are less likely to alter the competitive edge of banking firms. Is this important for domestic banks in emerging economies? Arguably the answer at present is no, except for some economies with important intraregional banking relations. Most of the papers dealing with country experiences in this volume make reference to different issues as a source of a competitive edge but not to differences in the way the industry is regulated. A more important consequence at this juncture is that convergence has established a common capital framework that centres on credit and market risks. This has helped to promote greater emphasis on risk management in the banking business in emerging economies. Table 1 presents evidence on the universal use of credit and market risks as a yardstick for capital ratios in emerging economies. To the extent that the capital ratios increase with greater risk-taking, the framework can help banks in emerging economies keep risk under control. But this is not a foregone conclusion. Goldstein (1997) presents two common criticisms of the framework: (i) it does not require banks operating in more volatile environments to hold higher capital; and (ii) the significance of meeting the capital adequacy ratio is reduced if other elements of the prudential and supervisory framework are substandard. The paper by Betancour et al (2006) in this volume draws attention to the “preconditions” required for a capital framework to work adequately. The common framework has incorporated two important elements into the regulation of capital in emerging markets: (i) a rule-based approach in the assessment and quantification of risks; and (ii) allowance (although limited) for the risk properties of bank assets. The rule-based approach imposes on banks the criteria for the assessment and quantification of risks and preserves some discretion for the regulator to alter this quantification. This discretion is conceptually an important issue because it puts a powerful tool in the hands of the regulator in emerging economies. The rule-based approach incorporates risk weights associated with different components of bank assets. By determining these, the regulator is passing judgment on the nature and relative importance of the risks the banking sector can bear. In a sense the regulator substitutes for bank management in the judgment of risks. Given the structure of the risk weights, the supervisor can adjust the minimum amount of required capital to the riskiness of the whole bank portfolio. Assessing risk weights is not a trivial issue in emerging economies. The risk weights embedded in the rule-based approach have generally been taken from the international blueprint for the regulation of capital. From conceptual and practical points of view this is somewhat puzzling because emerging economies tend to differ in their economic structure and the constellation of risks might well be different. Moreover, emerging markets are generally more vulnerable to financial shocks. As a result of these differences, their economies tend to be more volatile; that is, prices and quantities record larger changes in response to a shock than would be the case in developed economies. This would seem to call for some differentiation of risk weights. Prima facie, there would be a case for banks in emerging economies to hold greater capital if the probability of bank failure was more likely to have real-side effects than in a developed economy with more diversified sources of finance.
14
The Capital Accord dated 1988, and modified in 1996, was developed by the Basel Committee on Banking Supervision. It was originally intended to apply to international banks but was extended to all banks in the European Union and later developed into an international standard.
15
The Reports on the Observance of Standards and Codes (ROSCs) and the Financial Sector Assessment Program (FSAP) prepared and published by the International Monetary Fund and the World Bank.
104
BIS Papers No 28
Table 1 Capital regulation Prudential capital requirement (in %)
Total capital ratio (in %, for 2004)1
Credit risk (yes/no)
Market risk (yes/no)
Consolidated (yes/no)
… … 8 9 8 … 12
12.3 … 13.6 10.8 3 14.1 … 12.5
Yes … Yes Yes Yes … Yes
Yes … Yes Yes Yes … Yes
Yes … Yes Yes No … Yes
8 9
… 13.4
Yes Yes
Yes Yes
Yes Yes
Hong Kong SAR Singapore
8 10
15.4 16.1
Yes Yes
Yes Yes
Yes Yes
Indonesia Korea Malaysia Philippines Thailand
8 8 8 … 8.5
19.4 12.4 14.3 … 13.1
Yes Yes Yes … Yes
Yes Yes Yes … Yes
Yes Yes No … No
8 8 8
12.6 13.2 15.4
Yes Yes Yes
Yes Yes Yes
Yes Yes Yes
9 10 2 8 8
10.8 … 18 28.8
Yes Yes Yes Yes
Yes Yes Yes Yes
Yes Yes Yes Yes
Argentina Brazil Chile Colombia Mexico Peru Venezuela China India
Czech Republic Hungary Poland Israel Russia Saudi Arabia Turkey
Note: na = no answer or not applicable. 1
Taken from questionnaire responses.
2
Banks with equity greater than EUR 5 million, otherwise 11%.
2
For 1999.
Source: Central banks.
Several countries have adjusted the common framework to their specific needs. First, a few countries have modified the risk weights for some assets in bank portfolios. In Chile and Hong Kong SAR, regulators have applied greater risk weights for mortgage loans; likewise, Venezuela reported that risk weights for government bond holdings were to be positive rather than zero. Second, a number of countries have imposed greater capital adequacy ratios on their banks. Table 1 shows that at least seven countries demand a capital adequacy ratio for their banks that is greater than 8%. The regulation on capital does not take into account the overall portfolio risk faced by the bank. Since asset correlation is not taken into account, the allocation of assets embedded in the capital rule might not be efficient. For example, in industrial countries government bonds have a zero risk weight. The logical underpinning is that credit risk is low and stable, that government bonds are a safe haven in the event of falling risk aversion and that their return is negatively correlated with other banks’ assets. However, in emerging economies these assumptions might not hold: sovereigns have defaulted, and sovereign debt returns are positively correlated with most other assets. The introduction of the market risk amendment to the Capital Accord in 1996 was a first step away from a prescriptive rule-based approach towards models in requiring the specific quantification of risk.
BIS Papers No 28
105
This development had important consequences. In 2004 the Basel Committee on Banking Supervision published a revised framework. 16 The new framework still does not require the use of a risk portfolio model to compute capital adequacy ratios, but it makes explicit measurement of credit risk the central element for calculations of capital requirements. Moreover, although it established a rule-based approach, it envisaged the supervisory authority being able to demand an adjustment of the perceived capital requirement at its discretion. The need for this could be determined by the results of stress testing, deficiencies in risk management, or lack of internal controls. Notwithstanding the convergence in the regulatory framework already noted, there remain some differences in the supervision of bank capital across countries. First, there are differences in the extent to which capital adequacy ratios incorporate credit and market risks. Interest rate risk is less prevalent in the computation of capital adequacy ratios than is credit risk. Second, there are differences in the frameworks used for bank regulation. For example, consolidated supervision is not universal since, in a few cases, bank regulators do not have the legal right to apply it. 17
3.
Deposit insurance
Deposit insurance is another central element of financial stability policies. Its presence reduces the incentive of bank depositors to withdraw their money all at once and bring down the bank. By increasing depositor confidence, deposit insurance has the potential to provide for a more stable banking system. But it also has its downside: as with any insurance scheme, it reduces an element of market discipline. Because depositors do not face the costs in case of a bank failure, it might reduce their incentive to monitor bank activities. Most major emerging economies have adopted deposit insurance schemes. Nevertheless, such schemes are not universal and still have not been adopted in Chile, China, Israel or Saudi Arabia (see Table in Appendix B). Singapore has recently decided to introduce deposit insurance and has already laid down the details of how it might operate. Countries that do not have a deposit insurance scheme have in general kept a considerable role for the central bank in financing the repayment of deposits to depositors in failed banks. In general central banks can advance funds to the liquidators secured with assets from the failed bank. Several deposit insurance schemes offer only limited coverage as a means to prevent moral hazard. 18 To avoid excessive risk-taking, schemes in most emerging economies tend to be limited in their scope and coverage. Thus, they seek to protect small depositors fully while leaving large depositors covered only partially. Extending insurance to the smaller (and more numerous) depositors has the potential to reduce the incidence of bank runs. Arguably, deposit insurance provides for less market discipline. The limits on coverage are quite variable between countries, and this is probably due to both general and idiosyncratic elements. Differences in income per capita across countries matter: wealthier countries are likely to offer comparatively greater insurance in nominal terms. Idiosyncratic factors like the past experience of a banking crisis - could also result in a higher coverage ratio. Some countries do not extend deposit insurance to branches of foreign banks, but do so in the case of foreign bank subsidiaries. Other countries do not make such a distinction. Deposit insurance schemes may be funded privately (through contributions from banks) or from recourse to the government purse. Most commonly, participating banks are asked to make a contribution. When this is the case, contributions are based on the amount of deposits insured. There has also been a shift towards considering the risk profile of the bank: those with riskier business who are therefore more likely to tap the deposit insurance scheme are likely to pay higher fees. Examples include Hong Kong SAR, Singapore, Hungary, Poland and Turkey. This raises some interesting issues
16
The document is entitled International Convergence of Capital Measurement and Capital Standards: a Revised Framework.
17
This is reported in the case of Thailand, although legal modifications are being tried.
18
Caprio et al (2002) provide evidence that deposit insurance generosity is positively correlated with bank fragility. DemirgüçKunt and Detragiache (2002) show that deposit insurance generosity predicts future banking crises.
106
BIS Papers No 28
about the complementary nature of deposit insurance premia and risk-weighted capital adequacy ratios. While the rationale for deposit insurance is clear, there are some thorny issues that arise in the case of systemic banking problems. In general, deposit insurance will not have the resources needed to pay out a large proportion of bank deposits. This poses problems of credibility for the deposit insurance system if the banking problem is regarded as large. Systemic banking crises in emerging economies also tend to be associated with an increase in sovereign risk, which further threatens the credibility of the insurance guarantee. In cases where depositors cannot distinguish between sound and troubled banks, the deposit insurance scheme is then likely to lose its effectiveness, and the banking system may destabilise easily (Levy Yeyati et al (2004)).
4.
Lender of last resort
In many countries financial stability policies include a lender of last resort for the banking system. Banks are exposed to a great extent to liquidity risk (the risk that the cost of adjusting financial positions will increase substantially or that they will lose access to financing). This is particularly the case because banking is a heavily leveraged business and many banks’ assets are illiquid. If depositors decide to exchange their deposits into cash, the banking system will need a source of external liquidity. The loss of deposits in one bank cannot be dealt with by borrowing from other banks because their liquidity does not increase when deposits are exchanged for cash. Problems in the functioning of the interbank market can also pose a risk for systemic liquidity. Normally, banks keep liquid assets in the form of cash or a balance in an account at the central bank. Alternatively they may have deposits with other banks or access to borrowing from them. The interbank market allows banks to recycle liquidity amongst themselves. However, at some point the interbank market may not work properly. Interbank market failures arise in general from imperfect information about the true health of a bank or increased risks that make banks less willing to lend. The failure of a large bank, or a number of smaller ones, can have systemic implications. The nature of banking credit relations determines that a large group of households and firms might not be able to obtain financing. This might reverberate through the financial system. In this vein, a bank run can affect the functioning of the payment system. Bank liabilities dominate as means of exchange but finality is only achieved when a means of payment is exchanged in settlement for customer transactions. For this reason banks daily clear large amounts of liabilities relative to their stock of assets. While an essentially bilateral commitment, these operations are frequently settled on a multilateral basis. Disruptions in the settlement of a bank’s liabilities can have a knock-on effect on other banks. Real-time payment systems eliminate these exposures between banks. However, if the central bank provides uncollateralised intraday liquidity to facilitate the process, it then takes on the credit risk. In recent years there has been a move towards real-time gross settlement systems for interbank payments and central bank lending has been collateralised. Under these circumstances, the lender of last resort can just stand ready to purchase high-quality marketable assets from banks’ portfolios. Banks will keep them in their portfolios as they internalise the risk of an illiquid portfolio (Goodfriend and King (1988)). But there are other instances where a lender of last resort is required to lend on less secured terms, involving the central bank taking onto its balance sheet the illiquid assets of banks in exchange for liquidity. James (1991) provides evidence that the liquidation value of a bank is lower than its market value. It is then possible that in the case of bank insolvency - and because of the divergences in valuation cited by James - the central bank would be taking on a significant risk. Historically, the central bank has provided the function of lender of last resort for banks although this has also involved risk capital support for banks. This raises some issues concerning financial stability. If the lender of last resort reduces the liquidity risk that banks face, its presence might reduce the incentive of banks to keep adequate levels of liquidity. This raises the possibility that the involvement of the central bank increases moral hazard. One way to address this is to limit lending to a short period of time. This may provide the “breathing space” that a sound but illiquid bank might need. A second way is to impose borrowing limits. Table 2 shows that most central banks in emerging economies impose limits on lending to banks. In most cases the limits are on the amounts borrowed but several
BIS Papers No 28
107
also impose limits on the length of the lending period. Some countries report no limits to borrowing but in most of these cases lending is collateralised, and the amount of acceptable collateral provides the limit.
Table 2 Lender of last resort Borrowing limits (yes/no or details)
Cost (interest rate charged, ppa)
Does access prompt supervisory action? (yes/no)
Argentina Brazil Chile Colombia Mexico Peru Venezuela
… … Yes. Limit of 90 days Yes Yes … No. Amount of reserve requirements affects credit extended
… … … Overnight rate + 1% Market rate … Market rate + spread (not defined)
… … Yes Yes Yes … Yes
China India
Yes Yes
2.25% in most cases Repo rate/bank rate
Yes Yes
Hong Kong SAR
Base rate + margin based on market conditions Market rate + margin
…
Singapore
Yes. Limit of 100-200% of capital base and up to HKD 10 billion Yes
Indonesia Korea Malaysia Philippines Thailand
Collateralised Yes Collateralised … Yes. On a case by case basis
… 3% … … The higher of 1-day repo rate or average minimum loan rate of 5 largest banks
Czech Republic
No. Limits on maturity
Money market rate + margin (depends on collateral)
Hungary Poland
No. Based on collateral No. Based on collateral
O/N rate + 0.5-2% Lombard rate
Yes, but depends on bank’s financial situation No No
Israel Russia Saudi Arabia Turkey
Based on collateral Yes No Yes, in most cases. Based on collateral
… Market rate … Money market rate
Yes … … Yes
Yes Yes Yes Yes … Yes
Note: … = no answer or not applicable. Source: Central banks.
Borrowing at punitive rates could also help in curtailing moral hazard; but punitive lending is less common. In general central banks charge market interest rates. It is also true that a higher interest rate might just end up sinking an illiquid bank or encourage greater risk-taking by its managers.
108
BIS Papers No 28
Most countries report that borrowing from the rediscount window prompts corrective action (Table 2). The nature of the supervisory action may vary but the prospects of opening the doors to the intervention of the regulator might be a powerful deterrent to imprudent behaviour. 19 Conditioning liquidity assistance on prompt corrective actions might provide for some constructive ambiguity. This is effectively ambiguity about whether liquidity intervention will in fact take place, about the terms for assistance and about the penalties. The downside of constructive ambiguity is that it places considerable discretion in the hands of the agency responsible for crisis management.
19
See Table in Appendix C for details about prompt corrective actions in emerging economies.
BIS Papers No 28
109
110
Appendix A
Country Hong Kong SAR
India
Korea
Malaysia
Risk concentration Lending limit of 25% of bank capital for borrower. Exceptions apply.
Provisions
Credit registry
Other prudential regulations
BIS Papers No 28
HKMA does not prescribe rules. Borrower can be pooled in risk categories and provisioned as a single borrower.
Lending to related parties limited to 5% of borrower’s net worth. Total lending to related parties cannot exceed 10% of bank capital.
Lending limit of 15% of bank capital for single borrowers and 40% of bank capital for group borrowers. In the case of infrastructure projects, 5 percentage points more are granted.
General provision rules. Advice to provision at time of credit event. Up to one year to provision for rehabilitation packages.
Investments up to 5% of total advances and 20% of net worth.
Lending limits of 20% of bank capital for single borrowers and 25% of bank capital for group borrowers. Total of exposures greater than 10% of bank capital should not exceed five times bank capital.
Provision rules make a distinction for household, credit card and other loans.
Lending to shareholders is limited to 25% of bank capital or a proportion of their shareholding.
Lending limit of: 25% of bank capital for borrower; or 35% if private debt securities in bank portfolio. Total of exposures greater than 15% of bank capital cannot exceed 50% of total loan portfolio.
Provisioning rules do not vary according to type of borrowing.
Supervisory assessment CAMEL
Investment limited to 25% of firms’ capital. Also applies to land holding of the bank.
Off-site monitoring. Monitoring of real estate lending each month. On-site examination. Quarterly reporting.
Lending to related parties is limited to 10% of bank capital.
Central bank owns and manages a credit registry. Banks report single loans but not credit assessment.
Lending to shareholders or their affiliates is forbidden.
CAMELS: capital, assets, management, earnings, liquidity and stress testing.
Off-site monitoring. On-site examination. Monthly reporting.
BIS Papers No 28
Country Singapore
Risk concentration Lending limit of 25% of bank capital for borrower. Total of exposures greater than 15% of bank capital cannot exceed 50% of total loan portfolio.
Provisions Loan loss provision computed from portfolio models is permitted for consumer loans.
Credit registry
Other prudential regulations
The Bankers’ Association owns and manages a credit registry for its members. Creditworthiness assessment available. Access to information is restricted.
Banks are not allowed to engage in nonfinancial activities. They are also not allowed to invest in more than 10% of the share capital of/have significant influence over a company engaging in non-financial activities.
Supervisory assessment On-site examination. Monthly and quarterly reporting.
Equity investment in a single company restricted to 2% of bank capital except in the case of financial companies where the acquisition has been approved by MAS. Total equity investment to 10% of capital.
Thailand
Lending limit of 25% of bank capital for borrower. Risk mitigation is limited to collateral in the form of government securities that reduce lending limits.
Loan classification embedded in the law (not a central bank regulation). Bank supervisor can demand provisioning on a particular loan.
There is a single credit bureau managed by a private company. All banks have chosen to report to it. Reporting for single borrowers and credit payment history is monthly. Cannot provide credit assessment report.
Investments limited to 10% of companies’ shares and 20% of bank capital.
On-site and off-site examination.
Lending to related parties limited to 5% of bank capital, 50% of borrower’s net worth and 25% of its liabilities. Exception if lending carries government securities or certificates of deposit as collateral.
Supervisors forecast capital adequacy ratio. Regular reporting system.
111
112 Country
Credit registry
Other prudential regulations
Supervisory assessment
Risk concentration
Provisions
Chile
Lending limit of 5% of borrowers’ equity. Can be raised to 10% if excess is in foreign currency for trade financing (exports) and up to 15% if the excess (in any currency) finances public works.
Provisions are based on credit rating of borrower. Debtors can be pooled up in risk categories and provisioned as single borrowers according to risk characteristics.
Central bank loan registry managed by supervisor. Monthly reporting of loans granted and credit rating. Rating may be individual or pooled.
Lending to related parties is permitted but it should be granted under the same conditions as to non-related parties.
Banks are not subject to concentration or exposure limits in the regulations. The supervisor will grant a better rating to a bank that diversifies risk.
Colombia
Lending limit of 40% of borrowers’ net worth.
Provision rules for consumer, commercial, mortgage and micro-credit according to months due (1-18 months).
Banks report loans to supervisor on a monthly basis. Data comprise amounts, interest rate, loan quality and borrower. No public access to data.
Lending to related parties is limited to 10% of borrowers’ equity. Up to 25% if collateral for at least 5 pp is pledged.
Assessed by the Superintendency of Banks. On-site supervision.
BIS Papers No 28
Mexico
Lending limits range from 12 to 40% of bank capital for borrowers depending on the bank’s capital adequacy ratio (eg if it is between 10 and 12% then it can lend up to 25%). Total of three largest exposures cannot exceed 100% of bank capital. Collateral increases borrowing limits up to 100% of bank capital.
Provision rules for housing, consumer and commercial loans. Based on payment record and financial and collateral analysis. Internal models permitted.
Lending to related parties is limited to 75% of banks’ capital. Investments limited to 15% of business’ net worth.
On-site supervision.
Venezuela
Lending limit of 10% of bank capital for a single borrower and 20% of bank capital for a group borrower.
Provision rules for general lending and microfinance.
Lending to controlling interest forbidden. Lending to employees of the supervisory authority forbidden.
Monthly reporting. Regulations and direct instructions.
BIS Papers No 28
Country Czech Republic
Poland
Hungary
Risk concentration
Provisions
Credit registry
Other prudential regulations
Lending limit of 25% of bank capital for borrower. No limits to bond holdings of governments from OECD. Collateral admissible to reduce lending exposure (government bonds).
Loan loss provisions from portfolio models. Different methodology for banks following IFRS and those that are not. Supervisor might request a capital deduction for differences between estimates based on portfolio losses and a fixed coefficient.
Central bank manages the Central Register of Credits. Individual loans, loan characteristics and financial information of borrower. Credit assessment is not reported.
Lending limit of 20% of bank capital for controlling interest.
Lending and off-balance sheet claims cannot exceed 25% of bank capital. Total of exposures greater than 10% of bank capital cannot exceed eight times capital. Lending to OECD governments and banks is excluded (or lending secured against them).
General provision rules. Application of portfolio model possible after prior approval by supervisor (no bank applied for it).
Banks report to BIK (credit bureau) claims greater than 2.5% of bank capital (for large banks there is a loan size limit). Monthly update. Credit quality provided. Access only possible for central bank and supervisor.
Lending limit of 20% of bank capital for related parties.
Lending limit of 25% of bank capital for borrower. Total of exposures greater than 10% of bank capital cannot exceed eight times capital.
General provision rules. General risk provisions permitted.
Private credit bureau. Banks must report their loans but not their credit assessment. Access is restricted to participating banks.
Investments are limited to 15% of bank capital. Total exposure cannot exceed total bank capital. Excludes government bonds and debt securities; and investment in other financial firms (but these holdings are limited to 60% of bank capital).
Total lending to controlling interests cannot exceed eight times bank capital. Internal control system comprising risk management.
Operational risk and internal controls.
Supervisory assessment Off-site supervision: monthly, individual bank; quarterly, consolidated group. Based on regulatory reporting. On-site examination.
Off-site supervision based on reports filed. On-site examination. Lending exposures greater than 10% of bank capital must be reported.
Limitations on lending to related parties. Disclosure required. Real estate limited to 5% of bank capital (excluding buildings for bank facilities).
On-site supervision (individual and consolidated basis). Off-site examination.
113
114 Country
Risk concentration
Provisions
Credit registry
Lending limit is scaled as a proportion of capital for: (i) large exposures; (ii) high leverage buyouts; (iii) industry concentration; (iv) exposure to LDC; and (v) debt in arrears. Collateral can be offset against exposure.
General provision rules and special rules for housing loans.
Centralised loan registry managed by the Bank of Israel. Proprietary use for supervision. Individual loans and financial information reported.
Credit management, internal control and best practices.
Russia
Individual or group borrowing is limited to 25% of bank capital. Total of exposures greater than 5% of bank capital cannot exceed eight times capital.
Provisions for individual loans based on degree of impairment. Collateral is not taken into account for loan classification but it is for provisioning.
No centralised credit registry exists. There is oversight of credit bureaus by the central bank.
Lending to related parties limited to 50% of bank capital.
Turkey
Limits to individual or group borrowing.
General provisioning rules.
The central bank manages a loan registry. Banks report risk positions on a monthly basis. No credit assessment reported. Consumer credit lending is publicly available.
Limits on lending to related parties.
Israel
Source: BIS on national central banks.
Other prudential regulations
Operational risk and IT management.
Supervisory assessment Off-site examination. On-site examination. Regulations play a major role in oversight.
BIS Papers No 28
Appendix B
Deposit insurance schemes
Coverage (general/fractional, limits (per depositor, per bank))
Insurance premium (percentage or range)
Are insurance premiums riskweighted? (yes/no)
Can deposit insurance be extended to other liabilities?
Do deposit insurance arrangements differ between foreign and domestic banks? (yes/no)
Argentina Brazil Chile
Does not have a traditional deposit insurance system. Sight and time deposits guaranteed by the central bank
na
na
na
No
Colombia
Up to 75% of deposits or limit of COP 20 million (approx USD 9,000) per depositor
0.5% of deposits
Yes. Based on bank rating
No
No
Mexico
Limit of UDI 400,000 (approx USD 133,000)
na
No
na
No
Venezuela
Up to USD 5,000 on domestic currency deposits
0.5% of deposits
No
No. It was extended in the crisis of 1994-95
na
China
No deposit insurance
na
na
na
na
India
Limit of INR 100,000 (approx USD 2,300)
10% of deposit
No
No
No
Hong Kong SAR
Limit of HKD 100,000 (approx USD 13,000); excl interbank and connected deposits; incl foreign and domestic currency
0.05-0.14% (until the first year in which the target fund size is reached), 0.0075-0.02% thereafter, of deposits
Yes, based on CAMEL ratings
Not explicitly mentioned, but probably not (no)
Yes, foreign banks are allowed to seek exemption provided that deposits in HK offices are covered by the bank’s home jurisdiction
Singapore
Limit of SGD 20,000 (approx USD 12,000)
0.03-0.08% of deposits
Yes
No
No
Peru
BIS Papers No 28
115
Deposit insurance schemes (cont)
Coverage (general/fractional, limits (per depositor, per bank))
Insurance premium (percentage or range)
Are insurance premiums riskweighted? (yes/no)
Can deposit insurance be extended to other liabilities?
Do deposit insurance arrangements differ between foreign and domestic banks? (yes/no)
Indonesia
Limited
0.10%
Not yet, plans to introduce this in 2007
No
No
Korea
Limit of KRW 50 million (approx USD 47,000)
0.025-0.3% of deposits depending on the sector
No
No
No
Malaysia
Limit of approx USD 15,000
0.02% of total deposits or 0.06% of eligible deposits
Not yet, plans to introduce this in 2006
No
No
Thailand
Currently blanket guarantee but DIA to be formed to provide limited coverage
0.20%
No
No, except in 1997 crisis where creditors were also compensated
No
Czech Republic
Limited basis on local and foreign currency deposits
0.1% of deposits
No
No
No
Hungary
Limit of HUF 6 million (approx USD 29,000) for domestic currency and lower limit for foreign currency
na
Yes, based on capital position. Capital ratio below 8% faces a higher charge
No
No
Poland
Effective limit of EUR 20,000, covers domestic and foreign currency deposits and includes other claims such as CDs, savings bonds, etc
Annual contributions depend on banks’ riskweighted assets and amounts set by the Bank Guarantee Fund Council
Yes, based on risk-weighted assets
No
Domestic banks and foreign subsidiaries are covered but foreign branches are covered by home country scheme
Israel
No formal deposit insurance scheme
na
na
na
na
Philippines
116
BIS Papers No 28
Deposit insurance schemes (cont)
Coverage (general/fractional, limits (per depositor, per bank))
Insurance premium (percentage or range)
Are insurance premiums riskweighted? (yes/no)
Can deposit insurance be extended to other liabilities?
Do deposit insurance arrangements differ between foreign and domestic banks? (yes/no)
Russia
Limit of RUR 100,000 (approx USD 3,500)
Max 0.15% of deposits
No
Banks which had a licence as of the date the Deposit Insurance Law came into effect but which have not joined the deposit insurance system are compensated by the central bank
Unclear
Saudi Arabia
No deposit insurance scheme
na
na
na
na
Turkey
Limit of YTL 50,000 (approx USD 36,000)
0.15% + 0.020.05% depending on the bank’s CAR
Yes
No, but happened during crisis period
No
Note: na = no answer or not applicable. Source: Central banks.
BIS Papers No 28
117
Appendix C
Country
Agency responsible
What prompts corrective action?
Actions
Hong Kong SAR
Monetary Authority (in consultation with Financial Secretary)
No specific criteria provided
Order to cease operations Restriction of deposit-taking Restriction of other activities Appointment of adviser to management Appointment of manager to take over
India
Reserve Bank of India
Deterioration of financial strength: (i) capital adequacy ratio; (ii) nonperforming assets (net of provision); and (iii) return on assets
Capitalisation plan (limit asset growth, dividend payment or new capital demand) Restriction of other activities (CD rollover, limit interbank borrowing, etc) Change of ownership Merger or liquidation
Korea
Financial Supervisory Commission
Capital adequacy ratio below 8% and rating below 31
Management improvement plan. If the supervisor approves the plan, it will support it with bad asset purchases or a capital injection
Management improvement order: capital adequacy ratio below 2% and rating of 5 Malaysia
Central Bank of Malaysia
No specific criteria provided Informal enforcement action Remedial action
Merger with another institution, appointment of receiver or suspension of business Written commitments; letter of undertaking Restriction of lending activities Appointment of adviser to management Change of management Filing of a petition of liquidation
Singapore
Monetary Authority of Singapore
No specific criteria provided
Demand for bank to take corrective action [draw upon excess liquidity or reserves with MAS; order access to interbank market or parent bank support; restructure portfolio] Restrict operations Impose prudential conditions Appointment of adviser to management Appointment of manager Takeover by another institution Revocation of licence/request to High Court for liquidation
Thailand
Bank of Thailand and Ministry of Finance
No specific criteria provided
Corrective plan Management changes Restriction of business Bank liquidation
Problems identified Chile
Banking Supervisory Authority
No specific criteria provided Troubled bank Insolvent bank
Colombia
1
Superintendency of Banks. Network between MoF, SB & CB
Troubled bank, at discretion of the supervisor
Capital increase Change in financial contracts except sight deposits Liquidation (managed by BSA) Takeover by supervisor Liquidation
In Korea, the bank supervisor issues ratings for individual institutions that range from 1 to 5 on a quarterly basis.
118
BIS Papers No 28
Country Mexico
Agency responsible Pending approval
What prompts corrective action? Capital adequacy ratio less than 8% Capital adequacy ratio less than 7% Capital adequacy ratio less than 4%
Actions Corrective plan aimed at capital increase. Suspension of dividend payments Restrictions on asset growth/new business Supervisor approval for new operations Supervisor could also appoint management Bank resolution process launched with involvement of MoF, BC, SB and DI
Venezuela
Superintendency of Banks and Financial Institutions
Deficient capital adequacy ratio Access to central bank rediscount window Failure to comply with regulations
Demand for capital increase Order to cease new lending and deposits Asset sale Change of management Closure of bank The supervisor enjoys great discretionary power to launch corrective action measures Takeovers are reserved for the deposit insurance fund
Czech Republic
Czech National Bank
Shortcomings in the activities of the bank Capital less than two thirds adequacy ratio Stability of the banking system at risk
Corrective plan Other possible actions: change of management, change in bank licence, fine, restriction or veto of power over transactions with related parties Demand for capital increase Prohibition of acquisition of risk assets Ceasing of lending to related parties Taking control of ailing bank
Hungary
Financial Supervision Authority/Central Bank (MoU in existence)
Failure to comply with capital adequacy ratio
Poland
Commission for Banking Supervision
Severe loss and threat of insolvency Losses that exceed half of any bank’s capital
Corrective plan Appointment of adviser/controller Restriction of lending/deposit payment to related parties Calling of an extraordinary general meeting of shareholders Taking control of bank Taking control of bank away from shareholders Revocation of licence and closure of bank
Israel
Bank of Israel (through the Supervisor of Banks)
Instability of banking institution Solvency problem Persistent solvency problems Insolvency
Rediscount window support Demand for rectification Order to cease certain operations Suspension of dividend payments Restriction of board’s decision-making power Appointment of management Appointment of bank examiner to advise management
BIS Papers No 28
119
Country Russia
Agency responsible
What prompts corrective action?
Central Bank of the Russian Federation
Lack of compliance with legal framework Preventive: no threat to the interest of creditors and depositors
Actions Fine for a value of up to 0.1% of capital Prohibition of operations for up to six months Revocation of licence
Enforcement Turkey
Banking Regulation and Supervision Authority
na
na
Saudi Arabia
Saudi Arabia Monetary Authority (authority responsible)
Troubled bank
Appointment of adviser to management Order to cease management Order to cease lending/funding operations Revocation of licence (in coordination with Minister of Finance, who acts on recommendation from SAMA)
120
BIS Papers No 28
References Avery, Robert B, Terrence M Belton and Michael A Goldberg (1988): “Market Discipline in Regulating Bank Risk: New Evidence from the Capital Markets”, Journal of Money, Credit and Banking, vol 20, pp 597-610. Bank for International Settlements (2005): 75th Annual Report, Basel, June. Barth, James R, Gerard Caprio (Jr) and Ross Levine (2002): “Bank Regulation and Supervision: What Works Best?”, NBER Working Papers, no 9323, Cambridge, Massachusetts, November. Brock, Peter (1992): If Texas Were Chile: A Primer on Banking Reform, ICS Press. Calomiris, Charles and C Kahn (1991): “The Role of Demandable Debt in Restructuring Optimal Banking Arrangements”, American Economic Review, vol 81 (3), June, pp 497-513. Caprio, Gerard and Patrick Honohan (2004): “Can the Unsophisticated Market Provide Discipline?”, World Bank Policy Research, WP 2264, The World Bank, Washington, August. Corrigan, E Gerald (1982): “Are Banks Special?”, Annual Report, Federal Reserve Bank of Minneapolis, pp 2-24. Demirgüç-Kunt, Asli and Enrica Detragiache (2002): “Does Deposit Insurance Increase Banking System Stability? An Empirical Investigation”, Journal of Monetary Economics, vol 49, issue 7, October, pp 1373-406. Dewatripont, Mathias and Jean Tirole (1994): The Prudential Regulation of Banks, Massachusetts Institute of Technology Press, Cambridge. Freixas, Xavier, Curzio Giannini, Glenn Hoggarth and Farouk Soussa (1999): “Lender of Last Resort: A Review of the Literature”, Bank of England, Financial Stability Review, November. Goldstein, Morris (1997): The Case for an International Banking Standard, Institute for International Economics, Washington DC, April. Goldstein, Morris and Philip P Turner (1996): “Banking Crises in Emerging Economies: Origins and Policy Options”, BIS Economic Papers, no 46, Bank for International Settlements, October. Goodfriend, Marvin and Robert G King (1988): “Financial Deregulation, Monetary Policy and Central Banking”, Richmond Economic Review, vol 74 (May/June), Federal Reserve Bank of Richmond. Grossman, Sandford and Joseph Stiglitz (1980): “On the Impossibility of Informationally Efficient Markets”, American Economic Review, vol 70, pp 393-408. Honohan, Patrick (1996): Diagnosing Banking System Failures in Developing Countries, mimeo, October. James, Christopher (1991): “The Losses Realised in Bank Failures”, Journal of Finance, vol 46, issue 4, September, pp 1223-42. Kaminsky, Graciela and Carmen Reinhart (1995): “The Twin Crises: The Causes of Banking and Balance of Payments Problems”, American Economic Review, June. Kane, Edward (1995): “Difficulties of Transferring Risk-Based Capital Requirements to Developing Countries”, Pacific Basin Finance Journal, vol 3, no 2-3, July, pp 193-216. Levy Yeyati, Eduardo, Maria Soledad Martínez Peria and Sergio Schmukler (2004): “Market Discipline under Systemic Risk: Evidence from Bank Runs in Emerging Economies”, Policy Research Working Paper Series, no 3440, World Bank, Washington DC. Lindgren, Carl-Johan, Gillian Garcia and Matthew I Saal (1996): Bank Soundness and Macroeconomic Policy, International Monetary Fund, Washington DC. Modigliani, F and M Miller (1958): “The cost of capital, corporate finance, and the theory of investment”, American Economic Review, vol 48, pp 261-97. Park, Sangkyun (1995): “Market Discipline by Depositors: Evidence from Reduced-Form Equations”, The Quarterly Review of Economics and Finance, Vol. 35, pp. 497-514.
BIS Papers No 28
121
Rojas-Suarez, Liliana and Steven Weisbrod (1996): “Towards an Effective Regulatory and Supervisory Framework in Latin America: Dealing with the Transition”, in Safe and Sound Financial Systems: What Works for Latin America, Inter-American Development Bank, Washington DC. Sheng, Andrew (1996): Bank restructuring: Lessons from the 1980s, World Bank, Washington DC. Sprong, Kenneth (1990): Banking Regulation: Its Purposes, Implementation and Effects, Federal Reserve Bank of Kansas City.
122
BIS Papers No 28
Implications of recent changes in banking for the conduct of monetary policy David Archer 1
Introduction This paper examines the relationship between recent changes in banking systems in emerging market economies and the conduct of monetary policy at the operational level. The focus is on the mechanics of monetary policy operations, and changes in the effectiveness of the transmission of policy impulses to the wider economy. To anticipate the conclusions, the progressive switch to market-based monetary policy techniques has generally made it easier for central banks to guide the economy. More open and deregulated financial markets have on balance helped. Market-based monetary policy techniques are able to influence people’s behaviour even when they are outside the central bank’s regulatory net, with additional transmission channels coming into play. Even more importantly, the adoption of market-based techniques is usually accompanied by more purposeful and transparent monetary policy frameworks that improve signalling. After a brief review of the links between monetary policy operations and the structure of the financial system in theory, relevant evidence on the operation of these links in practice is examined. The paper then discusses the evolving monetary policy transmission mechanism, relating those changes to developments in the structure of the banking system. A conclusion follows.
1.
Monetary operations and financial system structure: in theory
It is natural that central banks would select the tools most suited to the task. Thus the tools used to affect monetary conditions would be mainly a function of two things: the monetary policy target and the state of financial system development. With underdeveloped financial systems, especially those dominated by (unsophisticated) banks, central banks would tend to directly regulate the lending and deposit-taking activities of banks as the chief method for exerting influence over monetary conditions. 2 Conversely, with sophisticated, developed financial systems where money and capital markets compete with banks, central banks would tend to use indirect, market-friendly methods. This pattern seems clearly evident in Table 1 below. Given this perspective, changes in banking system structure and behaviour will lead to changes in monetary policy operations, as central banks find that the old tools of direct intervention and regulation are less effective and the new market-based indirect tools more effective. The differences between direct and indirect monetary instruments have been well documented, as has the relationship between the effectiveness of the different approaches to monetary policy implementation at different stages of financial system development (see for example Alexander et al (1995), BIS (1996), IMF (2004)). Moreover, this description of the issue seems to fit well with the experience of advanced countries in
1
The research assistance of Pablo Garcia-Luna is gratefully acknowledged. Helpful suggestions were received from Bill White, Philip Turner, Ramon Moreno and Madhusudan Mohanty.
2
For example, “From the time of its establishment in 1950, the Bank of Korea … in practice [] long had to rely on direct regulatory instruments because direct regulation was more effective in manipulating the money supply under the situation in which the financial markets remained underdeveloped and there was a chronic excess demand for funds” (Bank of Korea (2003)).
BIS Papers No 28
123
the 1970s and 1980s, when direct monetary policy instruments were progressively abandoned in favour of market-based instruments. 3, 4 Table 1 Use of operational tools of monetary policy at various stages of development As a percentage of the total sample Developing countries Credit and interest rate controls
Emerging countries
Developed countries
4
22
0
65
30
7
100
96
70
Discretionary, market-based ops
96
96
100
Open-ended/standing facilities
96
96
100
Liquid asset ratios (LAR) Reserve requirements
Source: IMF (2004). Data relate to 23 countries in each of the three categories, as at the end of 2001.
2.
Monetary operations and financial system structure: in practice
Starting in the 1980s but especially in the 1990s and early 2000s, emerging market economies also modernised monetary policy operating procedures, essentially along the same lines that the developed economies had earlier. 5 That can be seen in Table 2, which highlights the main features of operating procedures used in emerging market economies. However, market-based operating procedures have been adopted even though banking systems continue to show noticeable structural differences relative to those in developed economies. For example, in many emerging market financial systems, secondary debt markets still have little depth. This complicates the idea that central banks tune interventions to match the financial system’s structure. A somewhat different perspective is that the choice of operating procedure reflects preferences as to regulatory style. Adoption of marketbased mechanisms tends to coincide with the choice to deregulate product markets and capital markets. In turn, markets adapt. In this perspective, central banks need not wait for financial markets to evolve a sufficient degree of sophistication. Instead, they can promote the necessary change by leading the innovation. The main features of monetary operations in emerging market economies (summarised in Table 2) are: 1.
There is now a high degree of uniformity in the way that monetary policy is implemented across the emerging market world. The chief characteristics of the now-dominant approach are: (a)
Short-term money market interest rates are the main operating target. Transmission to other interest rates is almost wholly through the incentive effects of altered relative interest rates, ie market forces.
3
The sole exception has been the retention in some cases of minimal reserve ratio requirements to ensure a non-zero demand for central bank cash, the idea being that a more stable fulcrum for market operations results. But to reduce the distortion arising from the associated implicit tax, mandatory reserve balances are typically remunerated at close to market rates.
4
Borio (1997a) provides a comprehensive account of the state of play towards the end of this transition to market-based instruments.
5
Van ’t dack (1999) provides a discussion of the early part of this modernisation phase. See also Hawkins (2005).
124
BIS Papers No 28
(b)
Standing facilities are often used to bound departures of short-term interest rates from target, sometimes in the form of a quite narrow interest rate “corridor”.
(c)
In the majority of cases where standing facilities provide an automatic mechanism for supplying central bank cash consistent with the target, active open market operations are used to reduce the variance of interest rates around the operating target.
(d)
In those cases where standing facilities are set at large distances (in interest rate terms) from the target, active open market operations are used to ensure that the supply of central bank cash is consistent with the target.
(e)
Open market operations are mostly conducted by way of competitive tenders.
2.
As these characteristics also describe the dominant approach used in developed countries, there is also considerable uniformity between the groups.
3.
Interest rate controls and direct limits on lending have been almost totally removed (the most important exceptions being some sectoral lending preferences that remain in force in Brazil, China, India, Korea and Venezuela; and residual interest rate controls in China, India and Russia). Reserve ratio requirements have been substantially reduced, and remuneration of mandatory reserve holdings is more commonplace (see also Annex Table 9).
4.
Much of the transformation of monetary policy operating procedures to market-based arrangements had already taken place by the end of the 1990s.
Clearly, some points of difference remain between typical operating procedures used in the emerging market economy (EME) group and the developed market group. Three countries in the EME group use the exchange rate as the operating target, and operating procedures are tuned accordingly. For the others, the main points of difference relate to: the residual use of lending directives or “guidance”; active adjustments of reserve ratios for monetary policy purposes in some cases; and incomplete remuneration of required reserves even in situations where the ratio requirement is non-trivial. Nonetheless, it is quite striking how many of the EMEs now rely on highly conventional approaches to policy implementation. Indeed, exceptions to a clearly interest rate-focused operating procedure are increasingly rare. Seven EMEs stand out as having distinctive approaches. As noted, three - Hong Kong SAR, Singapore and Venezuela - have the exchange rate as the focus, consistent with either a fixed exchange rate or (in Singapore’s case) an exchange rate operating target. Singapore’s approach is the most unusual, marrying an exchange rate operating objective with a price stability mandate. The Monetary Authority of Singapore has managed to escape the normal traps associated with this potentially internally inconsistent arrangement by maintaining sufficient flexibility on the exchange rate target in the face of 6 shocks to the equilibrium real exchange rate. Four countries have ostensibly continued to use bank liquidity - essentially, bank deposits at the central bank - as one of the main operating targets of monetary policy implementation. In India and Russia, the level of bank liquidity targeted at any one point in time is not made clear. Nor, early on, were the respective central banks very clear about what configuration of short-term interest rates and bank liquidity would be judged appropriate to meet monetary policy objectives. Over time, however, both central banks have become more explicit about the desired level of short-term interest rates. Both now set a corridor for overnight interest rates by way of standing deposit and borrowing facilities for banks at specified interest rates. Judging by revealed behaviour, in both cases the volume of bank liquidity supplied or accommodated has progressively become subsidiary to the operational interest rate objective. In Mexico, the Bank of Mexico has until recently also had an operational focus on bank liquidity. Unlike in India and Russia, the size of the “corto” - the (negative) quantity targeted - was well known and was in fact the major signalling device. While continuing to use cortos (“shortages”) to affect demand for bank liquidity in order to amplify the effect of changes in supply, since the spring of 2004 the Bank of Mexico has been much more explicit about the short-term interest rates it intends to achieve. In short, as in India and Russia, the operational focus for monetary policy has shifted
6
See Ho and McCauley (2003) for a full exposition.
BIS Papers No 28
125
increasingly towards a defined short-term interest rate configuration, even if such a configuration remains short of being called a target. Table 2 Main characteristics of operating procedures Arrangements in mid-1990s1 Operating target
Main instruments
Direct instruments
Arrangements in mid-20052 Operating target
Main instruments
Direct instruments
MONEY
OMO
ARR, DIR-MS ICONTROL
ERATE
FXOPS
Asia China
MONEY
ARR, DIR-MS ICONTROL
Hong Kong SAR
ERATE
FXOPS, CORR
India
BKLIQ
PDS, OMO, RDISC
ARR, DIR-MS
BKLIQ+STIR
PDS, OMO CORR
ARR
Indonesia
ERATE+ BKLIQ
PDS, OMO, RDISC
ARR, DIR-MS
STIR
PDS, OMO
ARR
Korea
BKLIQ+STIR
OMO, STAND
ARR
STIR
OMO, STAND
RR
Malaysia
MTIR
OMO, CORR
ARR, DIR-MS GDEP
STIR
CORR, OMO
RR
Philippines
…
…
STIR
OMO, CORR RDISC
ARR
Singapore
ERATE
FXOPS
RR
ERATE
FXOPS
RR
Thailand
BKLIQ, STIR ERATE
OMO
RR, DIR-MS
STIR
OMO, CORR
RR
Argentina
ERATE
FXOPS, … RDISC, OMO
BKLIQ
FXOPS, PDS, CORR
RR
Brazil
BKLIQ, MONEY
CORR, OMO
STIR
OMO, RDISC RR
Chile
STIR3
RDISC, OMO RR
STIR
OMO, CORR
RR
Colombia
STIR, ERATE
OMO, FXOPS
ARR
STIR
OMO, CORR
RR
Mexico
BKLIQ
OMO
ARR4
BKLIQ+STIR
PDS+CRAU C
Peru
BKLIQ
RR
Venezuela
MONEY
…
ERATE
FXOPS, PDS
RR
RR, GDEP
STIR
CORR, OMO
RR, GDEP
Latin America
ARR
Europe Czech Republic
…
…
Hungary
ERATE
OMO, RDISC RR FXOPS
STIR
CORR, PDS
RR
Poland
STIR
…
STIR
CORR, OMO
RR
ARR
Note: For footnotes and a key to acronyms, see the end of the table.
126
BIS Papers No 28
Table 2 (cont) Main characteristics of operating procedures Arrangements in mid-1990s1 Operating target
Main instruments
Direct instruments
Arrangements in mid-20052 Operating target
Main instruments
Direct instruments
Other Algeria
…
…
…
…
…
…
Israel
STIR
FXSWAP
RR
STIR
PDS, FXSWAP
RR
Russia
ERATE, NFA, NDA
FXOPS, PDS CRAUC, RDISC
ARR, SURR ICONTROL
ERATE, BKLIQ
FXOPS, PDS CRAUC, CORR
RR, SURR ICONTROL
Saudi Arabia
ERATE
OMO, RDISC RR, DIR-MS FXOPS
ERATE
OMO, FXOPS
RR
STIR
OMO, CORR
RR
Turkey
…
Key: … = information not yet available ARR = active (ie adjusted for monetary policy reasons in last five years) reserve requirement BKLIQ = bank liquidity or money base CORR = corridor of short-term interest rates formed by standing facilities [Note: when listed before OMOs, the corridor is judged to be the stronger of the two determinants of monetary conditions] CRAUC = credit auction DIR-MS = directions, credit ceilings and/or moral suasion ERATE = exchange rate FXOPS = foreign exchange operations (automatic or discretionary) FXSWAP = FX swaps for domestic liquidity management GDEP = government deposits which can be shifted at the central bank’s discretion to or from commercial banks ICONTROL = interest rate controls MONEY = money growth MTIR = medium-term interest rates (three- to six-month) NDA = net financial assets (maximum) NFA = net financial assets (minimum) OMO = open market operations in secondary markets PDS = primary debt sales RDISC = rediscount lending STAND = standing credit facilities, with interest rates adjusted for monetary policy reasons [Note: = CORR when essentially unlimited in size - subject to collateral - and coupled with standing deposit facilities] STIR = short-term interest rate (overnight to two-month) SURR = surrender requirements for FX 1
2
Information extracted from Kamin et al (1998), Van ’t dack (1999) and national sources. Bolded items in the body of the 3 4 table highlight important changes in practice. Indexed (ie real) rate. While Mexico does not use a reserve requirement (average cash balances at the central bank are normally targeted at zero), in August 1998 commercial banks were required to make special (remunerated) deposits at the Bank of Mexico in a measure designed to tighten liquidity conditions.
In Argentina, the monetary programme is specified in terms of a base money target range, which is adjusted annually in the light of perceived changes in base money demand in order to keep overall monetary conditions consistent with policy objectives. Although there are standing facilities at posted interest rates which create the appearance of an interest rate corridor, it is unclear to what extent those interest rate settings are adjusted to ensure consistency with the money base target range. In other words, the use of the corridor as an instrument of monetary policy is not clear. To examine the relationship between the operational approach and the structure of the banking system, an index of the use of non-market monetary policy instruments (NMMPI) was constructed and related to various structural indicators. Details on index construction and the resulting values are provided in Annex Table 9. It suffices to say here that the index weighs most heavily the use of interest
BIS Papers No 28
127
rate controls, direct control on credit creation and allocation, and active adjustments of reserve ratios where no interest is paid on required reserves. Graph 1 provides a selection of indicators of banking system structure, plotted against the NMMPI index. 7 The only relationship that shows any strength is that between the NMMPI index and government ownership of banks (left-hand panel, middle row). This is consistent with the view that government ownership weakens managers’ incentives to pursue profit-maximising strategies, which in turn weakens their likely responsiveness to price signals. In such circumstances, central banks might choose to use direct controls of various forms. It is also consistent with an argument that preferences with respect to regulatory style are revealed both in choices on the monetary policy operational approach and bank ownership. To the extent that one can detect a positive relationship between use of non-market instruments for monetary policy and overall restrictiveness on entry into the banking system and bank activities (right-hand panel, bottom row), the thesis that regulatory preferences dominate is further supported. (This direction of causation question is explored further in the next section.) Apart from the relationship between the NMMPI index and government ownership of banks, there is very little consistent relationship evident between the approach taken to monetary policy operations 8 and banking system structure.
Understanding causation As discussed earlier, it is unclear in principle whether changes in operating procedures should be regarded as a response to changes in financial system structure, or the other way around. Or indeed whether both are a function of attitudes towards market determination of prices in the economy. We do not have the data necessary to test for causation. A fundamental difficulty is that banking system structure and operating procedures both evolve progressively, over a number of years. And causation probably runs in both directions. In preparing for this meeting, central banks were asked whether recent changes in operating procedures were caused by, or were intended to cause, changes in banking system structure. As the major innovations were in place by the early 1990s in a large number of cases, relatively few central banks were able directly to answer the question. Those answers that were provided are, however, informative. In the central and eastern European cases, the main trigger for reform has been the accession-related need to converge on European Union practices. This has been true for the Czech Republic, where arrangements are now essentially identical with those of the European Central Bank. The story is very similar in Hungary and Poland, although reserve requirements remain slightly higher than in western Europe. At the same time, in all three countries central banks hoped that these changes in operating procedures would induce beneficial changes in banking system behaviour, including promoting the development of a liquid interbank market, partly by incentivising banks to manage their own liquidity positions (especially important in the Polish case), and thereby reducing the volatility of short-term interest rates (cited by the Czech and Polish central banks). Reductions in the implicit tax burden on banks associated with lowering reserve requirements and remunerating required reserves were intended in all three countries to reduce a tendency towards disintermediation.
7
It should be noted that two of the indicators of banking system structure are indices constructed by Barth et al (2002). As with many such indices drawn from attempts to place numerical values on qualitative factors - including the index constructed for this paper - the accuracy of the indices’ representation of the respective structural factors should be taken with a grain of salt. This is especially so for difficult-to-measure issues such as the quality of corporate governance and the nature of regulatory constraints.
8
There is some hint of a positive relationship between the NMMPI index and the productive efficiency of the banking system as proxied by operating costs as a ratio of total assets (right-hand panel, top row). This, however, is a counterintuitive result which collapses once India is removed from the sample, which removes the positive slope, indicating that the relationship is not robust.
128
BIS Papers No 28
Graph 1 Overall index of non-market monetary policy instruments (NMMPI, x-axis) against selected variables (y-axis) NMMPI and net interest margin 1
NMMPI and operating costs 1
● VE
10
10 VE
● BR
8
8
● ● BR
CO ● CO ●●
MX ● ●HU
TR
6
● RU
● ●
4
●PL ● CL ● PH ●CZ ●● TH MY ● IL
●
● CN
5
10
15
2
20
0
0
NMMPI and share state-owned banks 2
4
5
10
TR ● VE ● ● BR ● KR
●
● IN
● CO ● ● RU
AR
20
45
● MX
10
15
20
0
0
NMMPI and banking corporate governance index 4
5
10
CL 14
SA
●
PL
●
MX CZ
●
12
TR
ID
●
●
10 KR
8
●
CL PH 3
●
●
9
12
20
35
16
14
TR ● ● VE ●
● IN
6
0
12
● KR
SA ● BR
●
●
●
●
CZ
SG
PH
PE
●
IN 6
ID
● PL
●
●
IL
TH ●
● ●
TH 0
● ● MY
VE ●● IL
●
● MX
●
PE BR
15
NMMPI and banking overall restrictiveness index 5 16
●
55
● PH ● IL
VE HU ● ●PL ● TR ● ● PH ● BR ● CL ● ● ● TH CZ PE KR ● ● MX 0 5
AR
65
● CN
● ID
40
SG
0
75
MY ● ●TH
● PL
● IL
●
20
85
● HU
60
● ID
●
15
●
●
80
● RU
MY
2 ● CN
CL
CZ
100 CN
● IN
●
● IN ● KR
NMMPI and concentration in banking 3 ●
AR
● TR
● ID ● ● ● ● IL TH ● ● MY
● AR
0
●
CL PH
PL CZ
● IN
KR
6
PE
MX AR RU ● HU● ●
PE
● ● ID
10
8
AR
3
6
9
12
6
AR = Argentina; BR = Brazil; CL = Chile; CN = China; CO = Colombia; CZ = Czech Republic; HK = Hong Kong SAR; HU = Hungary; IN = India; ID = Indonesia; IL = Israel; KR = Korea; MY = Malaysia; MX = Mexico; PE = Peru; PL = Poland; RU = Russia; SA = Saudi Arabia; SG = Singapore; TH = Thailand; VE = Venezuela; PH = Philippines; ZA = South Africa. 1
2
As a percentage of total average assets, 2003-04 average. Defined as assets of state-owned banks as a percentage of 3 4 Five largest banks’ assets as a percentage of total assets, 2003. This index is the sum major banks’ total assets, 2003. of three component indexes: the Strength of External Audit index, the Bank Accounting index and the External Ratings and 5 Creditor Monitoring index. Table 7 in Barth et al (2003). A higher number indicates greater restrictiveness on banking activities and ownership. Table 3 in Barth et al (2003). Sources: Barth et al (2003); Bankscope; BIS calculations.
BIS Papers No 28
129
This is not to say that the direction of causation has run entirely from operational changes to the structure of the banking system, rather than the other way around. Magyar Nemzeti Bank, the central bank of Hungary, indicated that a narrowing of the interest rate corridor was facilitated by the spread of overnight money market instruments, and a widening of the range of collateral taken in central bank operations has been facilitated by the appearance of new securities such as mortgage bonds. In an interesting episode to which we will return later, the National Bank of Poland (NBP) was forced to alter its procedures - radically but temporarily - by banking system behaviour. For various reasons, in 1997 higher short-term interest rates resulting from a tightening of policy were not being translated into higher bank retail interest rates. For a period, the NBP offered six- and nine-month deposits directly to households, in competition with banks, and at higher rates than being offered by banks. The innovation was sufficient to motivate banks to raise retail rates. In Asia, central banks also point to an intention to alter the way that the financial system works as a substantial part of the reason for changing procedures. In India, for example, the Reserve Bank is trying to modernise the financial system. A progressive shift to indirect, market-based policy instruments, together with structural reforms and financial liberalisation, has increased the role of financial prices in the transmission mechanism (and with that the efficiency with which the financial system allocates resources). Observing signs of interest rate stickiness, the Reserve Bank has prompted a shortening of the period between interest rate resets on deposits, and is looking to further liberalise remaining interest rate controls on contractual savings. Again, direction of causation is not a one-way street. The Reserve Bank notes that the process of change has been gradual, and predicated on the development of prudential regulation and financial openness. In Singapore, monetary operations have been essentially unchanged since 1981. However, changes in the way the Monetary Authority of Singapore regulates banks are in general aimed at inducing behavioural changes in the financial system. The objective is to further develop financial services as an engine of growth. Thailand also serves as an example of causation running in both directions, though primarily from changed attitudes towards economic management style to financial regulation. Thus the post-crisis economic and financial reforms were collectively aimed at opening Thailand to international markets in order to capture some of the benefits from globalisation. All dimensions of the financial system were involved. In the process, the Bank of Thailand found that financial sector reform led to a breakdown of the quantity relationships previously relied on to implement the monetary programming required under IMF financing. This in turn reinforced the move to a price-based monetary policy approach. In Latin America, causation is also seen to run in both directions. A particularly interesting case is Mexico, where changed operating procedures, in the context of the new inflation targeting strategy, helped produce the nominal stability needed for the expansion of corporate and household lending. Heightened sensitivity to interest rate adjustments is an important consequence. At the same time, the changed focus of the new arrangements - in particular, the switch away from exchange rate management - has altered exchange rate hedging practices in the wider community. Banks, amongst others, are much less exposed to shifts in the exchange rate, allowing the Bank of Mexico to adjust interest rates independently of FX market developments. Thus changes in policy approach have produced changes in financial system (and wider community) behaviour that have in turn motivated further adaptation of policy operations. Chile and Colombia provide striking examples of different directions of causation. The Central Bank of Chile switched from indexed to non-indexed instruments in mid-2001. A deepening and internationalisation of the nominal fixed income market followed this “nominalisation”. In contrast, the Bank of the Republic feels constrained in its choice of instruments by the immaturity of the Colombian money market. Rather than using the simpler two policy interest rate structure observed in developed market settings, a four rate structure is used. The two “inner” rates are the minimum and maximum rates accepted at repo and reverse repo auctions respectively, while the “outer” two rates are the equivalent of the interest rates on the standing deposit and credit facilities that form interest rate corridors in such systems. The spreads between these pairs have narrowed progressively, but the Bank of the Republic would clearly prefer to move to a simpler structure when feasible. All in all, assessed on the basis of the explanations for changes in operating procedures provided by central banks, it appears that central banks are mostly leading rather than following changes in the banking system. Some examples of central banks responding to exogenous developments are provided, but they are more limited in number, and mostly relate to special circumstances.
130
BIS Papers No 28
This assessment has important implications for policy. It casts doubt on many of the proposed structural or behavioural “preconditions” for the successful implementation of market-based policy instruments 9 - preconditions relating to government ownership and control of banks being an important exception. Waiting for institutions to evolve before adopting market-based mechanisms might be a less successful strategy than promoting that evolution by adopting such mechanisms as part of a modernisation programme. In the wider context of financial globalisation, Kose et al (2005) have a parallel discussion with a somewhat similar conclusion. They argue that financial globalisation in the presence of weak institutions and a fragile financial sector is likely to create costs in the form of poor resource allocation and crises. But they further argue that financial globalisation itself promotes changes in institutions and financial systems that reduce vulnerability and improve the efficiency of resource allocation. Moreover, these changes are needed if countries are to increase growth.
3.
Implications for the transmission mechanism
The adoption of market-based monetary policy operations at the same time as markets have been liberalised and opened to international capital markets has had profound effects on the transmission of monetary policy. These effects are multidimensional; many enhance but others weaken monetary policy. The transmission of monetary policy impulses to interest rates set by financial institutions is addressed first, before broadening out the discussion to include other channels of transmission. 10 The institutional interest rate transmission channel 11 Market-based monetary policy exploits the incentives of financial institutions to pass on to their customers both higher marginal costs of funding - for the sake of maintaining profitability - and lower marginal costs of funding - for the sake of acquiring market share. In principle, therefore, liberalisation of markets should improve the effectiveness of the interest rate transmission mechanism. Interest rates are allowed to respond, constraints on freedom of institutions to act in pursuit of profits are removed, more channels of transmission are opened, and monopoly power is constrained by additional competition. This implies that where the long-term profit motive is a weak force, the adoption of market-based instruments might not improve transmission. In financial systems that are dominated by institutions whose shareholders either care little about long-term profitability, or who have been unable to institute governance arrangements that align managers’ interests with their own, reduced marginal costs of funding might not get passed on to customers. Instead, widened net interest margins might be used as a source of extra revenue for public projects (in cases where governments or local authorities are the main owner of banks), or of rent for managers. Higher marginal costs might also not be passed on where managers care less about the bottom line than the goodwill of dominant borrowers, who might also be a source of rent for those managers. Likewise, in uncompetitive banking markets, banks might be quicker to pass on higher than lower funding costs. Early studies of retail bank interest rate behaviour showed the existence of such an asymmetry in the United States (see, for example, Hannan and Berger (1991) and Neumark and Sharpe (1992)), where markets might be expected to be more competitive than in the typical EME. In the context of six European countries, Mojon (2000) shows that interest rates are more flexible the greater is external and within-industry competition. Cotarelli et al (1995) also show a connection between interest rate stickiness and competition in Italy. Similar evidence is available for EME cases. Cottarelli and Kourelis (1994) estimated the dynamic response of lending rates to changes in money
9
See IMF (2004) for example.
10
For a general overview of the determination of interest rates, see BIS (1996).
11
Note that the discussion in this section is couched in terms of the reaction of bank lending rates to changes in bank funding costs, treating the latter as synonymous with changes in central bank interest rates. It sets aside the responsiveness of bank deposit rates to changes in central bank rates, not because this is unimportant but rather because the same behavioural forces are at work, with very similar consequences for the monetary transmission mechanism.
BIS Papers No 28
131
market rates for 31 countries, including several emerging market economies. They found substantial cross-country differences in the speed and size of lending rate responses, related to five main structural factors: government ownership of banks, barriers to entry to the banking market, capital controls, the size of the market for short-term monetary instruments, and volatility of interest rates in that market. The inflation rate was also found to be relevant to pass-through, with higher inflation rates facilitating faster pass-through. Since earlier work had suggested that bank concentration affected the speed and size of pass-through from policy rates to lending rates, this was also tested. No such relationship was found. The broad conclusion from these analyses is consistent with the idea that liberalised financial systems, using market-based policy instruments, show stronger transmission, although the evidence is not overwhelming. 12, 13 A full cross-country, through-time examination of the hypothesis that a stronger role for the profit motive, more open and competitive banking systems, and a reduction in regulatory constraints on interest rate adjustment have made the interest rate transmission mechanism less sticky is beyond the scope of this paper. We instead simply look at changes in interest rate transmission over time for indirect confirmation of the hypothesis. A crude approach is to examine covariances of lending interest rates with money market interest rates in different time periods. This is done in Graph 2. Covariances were calculated for lag lengths ranging from 0 to 3 months, with the largest covariances from each period plotted. The support for an increase in interest rate pass-through as countries liberalise their financial systems is decidedly mixed. Where there are data for the first and second halves of the 1990s, the number of cases showing stronger pass-through in the later period is the same as the number showing weaker pass-through. And where there are data for both the second half of the 1990s and the first half of the 2000s, more cases show a weakening than show a strengthening in pass-through over time. Nor is the hypothesis that passthrough strengthens with financial market liberalisation rehabilitated by evidence of a shift towards faster, albeit weaker, pass-through. The lag length at which strongest covariance was measured increased in almost as many cases as it fell, with even more showing no change. A somewhat more sophisticated approach is to estimate pass-through from an error correction model where the dynamics are represented by distributed lags. Using such an approach, De Brouwer (1995) provided evidence of increasing pass-through from money market to lending interest rates as deregulation progressed in western Pacific countries, albeit for an early phase of liberalisation (1980s and early 1990s). In most of the emerging market cases in his sample, larger and faster pass-through 14 is observed over time (see the first two columns in Table 3). That change is less obvious in the more developed country cases where pass-through was higher at the start, and stays roughly unchanged or diminishes somewhat in certain periods (especially in Singapore 15). Pass-through generally increases for both deposit rates and lending rates, though the rise is larger and faster for the former, perhaps explained by higher transactions costs, and a stronger relationship element in lending than deposittaking.
12
Studies at the bank level point to the possible importance of other determinants of loan rate stickiness. Berstein and Fuentes (2004) identify bank size as important in Chile, along with the proportion of businesses relative to households in the loan book and the proportion of non-performing loans (all increasing in stickiness). Gambacorta (2004) finds that bank size does not matter in the case of Italian banks, where stickiness is found to be less where banks are illiquid or not well-capitalised (ie have low buffer stocks to absorb margin variations), and where the proportion of short-term lending is high. Interestingly, Gambacorta finds that heterogeneity of pass-through disappears in the long run. Di Lorenzo and Marotta (2005) dispute findings that EMU has increased pass-through in the Italian and Portuguese banking markets, raising doubts about banking market openness as an explanator of loan rate stickiness.
13
It should be noted that the issue of pass-through is related to, but conceptually not the same as, the issue of the determination of the average size of bank interest rate spreads. For selected discussions on the latter in an emerging market context, see Bensidoun et al (1997), Brock and Rojas-Suarez (2000), Afanasieff et al (2001), Demirgüç-Kunt et al (2004) and Martinez Peria and Mody (2004).
14
De Brouwer also provided estimates for pass-through from money market rates to deposit rates, and for the period 1980 to 1984. As these estimates tell essentially the same story, they are not shown.
15
The reduction in pass-through in Singapore is not surprising in view of the increasing focus on the exchange rate as an operating target for monetary policy. The greater the focus of monetary policy on the exchange rate, the more short-term interest rates are determined by interest rate differentials with partner countries and other determinants of capital flows (Glick and Moreno (1994)), which are only partly related to the domestic conditions relevant for loan pricing. Perhaps more surprising is the close relationship of loan rates and money market interest rates in Hong Kong.
132
BIS Papers No 28
Graph 2 Covariance of lending rate with money market rate 1.2 1.0 0.8 0.6 0.4 0.2
1990-94
1995-99
Mexico
Korea
Brazil
South Africa
Argentina
Czech Republic
Venezuela
Hong Kong SAR
Singapore
Thailand
Indonesia
Poland
Colombia
Philippines
Russia
0.0
2000-05
Table 3 Pass-through from money market to domestic loan interest rates Cumulative response of loan rate to 1 percentage point rise in money market rate after 1 and 12 months De Brouwer’s estimates 1985-89 Cum change after n months:
Updated estimates
1990-94
1990-94
2000-04
1
12
1
12
1
12
1
12
0.18
0.42
0.27
0.78
0.33
0.82
0.48
0.84
0
0
0.12
0.90
0.12
0.65
0.13
0.68
Malaysia
0.06
0.43
0.13
0.71
0.21
0.83
(0.02)
(0.20)
Philippines
0.58
0.83
0.69
0.86
0.80
1.00
0.83
1.00
Thailand
0.06
0.42
0.13
0.64
0.17
0.81
(0.11)
(0.50)
More advanced
0.38
0.67
0.32
0.71
0.19
0.87
..
..
Hong Kong
0.62
0.89
0.52
0.81
0.12
0.83
–
–
Singapore
0.14
0.45
0.12
0.60
0.26
0.90
(0.41)
(0.87)
Most advanced
0.62
0.91
0.72
0.88
0.76
0.99
0.78
0.88
Australia
0.68
1.02
0.49
0.87
0.87
1.00
0.95
1.00
Japan
0.43
0.65
0.82
0.87
0.36
0.96
0.19
0.52
Canada
0.57
0.91
0.80
0.95
0.82
1.00
1.00
1.00
United States
0.78
1.06
0.78
0.81
0.98
1.00
0.99
1.00
Less advanced Indonesia
Note: Estimates are bracketed where the relevant coefficients are statistically insignificant and/or the adjusted R squared is very low. Updated estimates for Hong Kong for the latest period are not sensible, so are not reported (see text). Numbers in bold are simple averages of countries in the group for which data exist (excluding bracketed estimates). Source: De Brouwer (1995); BIS calculations.
BIS Papers No 28
133
Consistent with the idea that interest rate pass-through increases as time passes and financial systems are deregulated, Espinosa-Vega and Rebucci (2004) provide evidence that Chile’s interest rate pass-through is now similar to that in Australia, Canada, New Zealand, the United States and five European countries. Chile’s start on the financial liberalisation path was relatively early within the EME group. The last two columns of Table 3 present updated estimates, using the same methodology as De Brouwer (see Annex 1 for details). Presumably because of slightly different data sources, some of the estimates in the 1990-94 period are a little different from De Brouwer’s, but the general story that more advanced countries with profit-driven banks operating in competitive markets show less lending rate stickiness remains intact. Because the 1995-99 period was characterised by much turmoil in money and banking markets in all of the EME countries in the sample, we chose to confine our updating of De Brouwer’s estimates to the 2000-04 period. Here we thought that the post-crisis normalisation of conditions would be sufficiently advanced to reveal the underlying relationships associated with the banking system’s evolving structure. As it happens, however, in many cases the relationships evident in the early 1990s had broken down in the 2000s. This is the case for Malaysia, Thailand and Singapore, where previously statistically significant coefficients describing both the cointegrating vector in the interest rate market and the dynamics of adjustment have become insignificant. (In Hong Kong, the estimated relationship shows a statistically significant negative connection between money market and lending interest rates, which is counterintuitive so is not reported). And in some other cases the degree of stickiness seems to have increased (Indonesia, Japan) notwithstanding noticeable structural change in the former case at least. This evidence confirms that the relationship between market structure and the performance of the interest rate transmission mechanism is complicated. From a cross-country perspective, the standard hypothesis still seems supported. But judging from the experience of the crisis-hit Asian economies, liberalisation does not automatically translate into more powerful interest rate transmission. What might be going on? One structural explanation for reduced responsiveness of lending rates to 16 short-term interest rates in these countries concerns the effect of increased globalisation. Although the general shift towards more flexible exchange rates suggests greater independence of national monetary policies and hence domestic short-term interest rates, the opening-up of capital markets also provides borrowers access to alternative sources of funds offshore (as well as onshore). Short-term international interest rate differentials tend to move through wider ranges than long-term interest rate differentials - increased capital mobility tends to favour the convergence of long-term interest rates internationally. One corollary is incomplete pass-through from short-term to long-term interest rates domestically, including those attached to term loan contracts. To the extent that interest rates attached to shorter-term loan contracts are affected by those attached to longer-term contracts, there might also be some spillover to pass-through from short-term funding costs to short-term loan rates. Another key reason for weak pass-through, at least during certain periods, might have to do with the health of the financial system. Several mechanisms might be involved. Where previous loans or investments have gone bad, financial institutions might seek to use increased margins to rebuild capital, increase provisioning and write down bad debts. Especially where bank capital has been eroded and accounting practices allow banks to hide bad debts, banks might continue to support “zombie” firms by “evergreening” impaired loans. Hanging on to bad loans may crowd out opportunities to make new good loans, limiting the stimulatory effect of lower interest rates. (There is considerable evidence of such an effect at work in Japan in the 1990s and some, though less, 17 evidence for banking systems hit by the Asian financial crisis. Certainly, the presence in several Asian economies of high levels of non-performing loans and weak corporate lending in the late 1990s and early 2000s suggests the possibility of widespread evergreening.) Furthermore, when the banking system is in poor health, it is highly likely that the economy is simultaneously facing difficulties. In such situations, risk aversion rises and information costs also seem to prevent banks acting
16
Various papers contained in BIS Papers no 23 discuss the effects of globalisation.
17
See Ahearne and Shinada (2004) and Fukuda et al (2005) for recent examples of research into bank support for zombie firms in Japan. Bonin and Imai (2004) provide evidence of bank support for weak firms in Korea.
134
BIS Papers No 28
countercyclically (by lending to those who can take advantage of opportunities created by the failure of others). In fact, Stiglitz-Weiss type credit rationing tends to increase, reducing the sensitivity of lending to changes in funding costs. This discussion relates to difficulties that central banks experience in stimulating economic activity during times when bank balance sheets are in poor shape. Such difficulties often lead to large injections of liquidity as central banks push on the proverbial string, with little effect on lending activity. Judging by comments provided by central banks, it seems that the overhang of such liquidity also means that increases in interest rates can also be difficult to transmit during the recovery phase. 18 For example, while Disyatat and Vongsinsirikul (2002) suggest that Thailand’s problems following the financial crisis were likely reasons for more sluggish transmission of stimulatory interest rate impulses, the Bank of Thailand’s questionnaire response for this meeting cited the liquidity overhang from that period as impeding transmission of higher policy interest rates. Similar problems were also cited by the Bank of Korea and the National Bank of Poland. In the latter case, when confronted with a negligible effect of higher policy rates on retail interest rates - for both deposits and loans - in 1997 the National Bank of Poland competed directly with banks for retail deposits. It was successful in motivating banks to compete for funds at higher interest rates, and to pass on the higher cost of funds in the form of higher lending rates. It should be noted, however, that the existence of a liquidity overhang does not seem automatically to translate into monetary policy ineffectiveness with respect to tightening interest rates. The Bank of Japan is currently concerned about the risk of an excessive response of interest rates to the prospect of progressive normalisation of liquidity conditions. Further indirect confirmation that the health of the banking system is part of the explanation for weakened interest rate transmission in the first half of the 2000s comes from evidence on passthrough in Hungary. Horváth et al (2004) estimate pass-through for Hungary for the period 1997 to early 2004. Comparing their results with those from earlier research, they conclude that interest rate transmission has improved. Although the Hungarian banking sector experienced some postliberalisation difficulties, they were not as severe as seen in post-crisis Asia. A possible third reason for reduced pass-through echoes the experience of reduced pass-through from changes in exchange rates to changes in import prices and thence consumer prices. Put simply, greater stability in consumer prices has been accompanied by reduced pass-through. Interest rates are also considerably less volatile in the most recent period. As shown in Annex 1, the variance of both money market rates and lending rates has fallen by between a third and a half in typical cases.
Broader channels of transmission As just discussed, the evidence on interest rate transmission within the financial institution sector provides only mixed support for the argument that adoption of market-based instruments coupled with liberalisation of markets makes monetary policy more effective. Overall, however, the evidence for a generalised weakening in the transmission mechanism is not strong. As Sellon (2002) found in the US context (where some interest rates have become more responsive to monetary policy), structural changes such as increased use of variable rate loans and low-cost mortgage refinancing have broadened the transmission mechanism. Central banks in developed financial markets have generally become more cautious about adjusting interest rates aggressively, for fear of provoking overly large responses. The sense of a more powerful transmission mechanism is associated with several factors, including: increases in financial leverage, particularly in the household sector, increasing its sensitivity to changes in financing costs; the stronger role that induced but unpredictable shifts in asset prices might play in affecting wealth and hence spending; and the heightened power of expectations channels. The view that the overall effectiveness of monetary policy has increased was also reflected in responses to questions posed to central banks in preparation for this meeting. Nine out of the 13 central banks which ventured a conclusion rate their influence over the economy as now stronger
18
The concept of a liquidity overhang and an associated non-linear interest rate transmission mechanism has gained renewed respectability following experience in Japan in the 1990s and the resurgence of interest in liquidity traps.
BIS Papers No 28
135
than before. The nature of their responses is discussed further below (with reference to Table 4). In the meantime, it is worth noting that implicit in a number of the comments offered by central banks is the particular role of the credit channel in the overall transmission of monetary policy impulses. As noted by Kamin et al (1998), the credit channel is relevant for both financially repressed economies and advanced liberalised financial systems. This reflects its two conceptions, one “old” (in terms of the economics literature) and one “new”. The old conception concerns quantity rationing by providers of credit, predominantly banks, resulting from interest rate and other direct regulations that cause an unsatisfiable demand for credit when such regulations are binding. The new conception recognises other rationale for the existence of quantity rationing, such as lenders’ responses to information problems when assessing the riskiness of borrowers, and risk management practices that involve setting quantitative limits on sectoral and connected party exposures. The new conception extends beyond quantity rationing, however. Where borrowers are large enough to have access to both banks and corporate debt markets, but these sources of finance are not perfect substitutes, changes in economic conditions that alter banks’ willingness to lend can lead to shifts in the interest rate spread 19 between corporate debt and bank financing. It has long been understood that the old conception of the credit channel has relevance for EMEs. But, as discussed in this paper, its relevance is declining as regulatory restrictions to interest rate and bank balance sheet adjustment are removed. The relevance of the new conception of the credit channel for EMEs has also been documented in a number of cases. For example, Kim (1999) and Borensztein and Lee (2000) show that the credit channel was a powerful force during and after Korea’s late-1990s financial crisis; Disyatat and Vongsinsirikul (2002) provide evidence for the existence of a credit channel in Thailand; and Fernandez (2004) provides evidence for Chile. In each case, the theory and the evidence relating to the new view of the credit channel point to an important amplification of the effects of changes in central bank interest rates on economic activity. But it is not entirely clear whether liberalisation of banking systems implies a strengthening or weakening of the amplification of monetary policy through the credit channel. One the one hand, a strengthening might be expected as more households and firms engage with banks to finance expenditures, as leverage increases, and as balance sheets become more sensitive to changes in the value of assets. On the other hand, as growing numbers of firms access deeper and more liquid debt markets both onshore and offshore, as substitutability of sources of finance increases, as information about the state of health of borrowers becomes more readily available, and as corporate governance arrangements improve in quality, we could expect a weakening in the role of the credit channel. In the absence of time series evidence specifically tracking the evolving performance of the credit channel in emerging markets, we are forced to infer the net effect from evidence on the changing power of the overall transmission mechanism of monetary policy, and from central bank perceptions of what is causing such changes. In these respects, the perceptions of EME central banks about the increasing power of the transmission mechanism as financial deepening proceeds parallels the evidence available from more developed markets. Sellon’s (2002) work has already been cited. A substantial investigation as to the implications of financial structure for the transmission mechanism was conducted by the BIS and national central banks in 1995 (summarised in Borio (1997b)). That study concluded that monetary transmission is relatively more powerful in (developed) countries where agents are more highly leveraged and exposed to fluctuations in asset values, where interest rates are more flexible, and where non-institutional forms of market finance are more developed. EME central banks in our survey placed particular emphasis on changes in monetary policy regimes when explaining their perception that monetary policy is now more powerful (see Table 4). Clearer objectives and greater transparency - often in the context of adoption of an inflation targeting framework - are thought to have increased the focus and purposefulness of the central bank, and thereby the effectiveness of the expectations channel.
19
Kashyap et al (1993), Gertler and Gilchrist (1993, 1994), Ceccetti (1995) and Christiano et al (1998) are prominent references in this literature. For a European perspective, see, for example, De Haan (2003) and Ehrmann et al (2001).
136
BIS Papers No 28
In addition, increasingly flexible exchange rates and the growth of capital markets have broadened the range of policy transmission channels to larger enterprises. Several central banks cited the growing role of asset prices in the transmission of monetary policy, noting especially the exchange rate and prices of traded financial instruments. Frequent reference was made to the broadening of transmission channels associated with greater financial depth. Removal of restrictions on access to credit markets, increasingly competitive credit markets that innovate in the design of loan contracts, improvements in information technology and information management that allow better assessment of credit risk, and changes in attitude towards financing of small and medium-sized enterprises as well as households are just some of the recent changes that have increased the engagement of such entities with financial intermediaries. (These trends are discussed in much more detail in the accompanying paper on developments in bank credit.) As a result of these changes, a smaller proportion of the private sector - from large enterprises to households - is now credit-constrained through lack of access to efficient intermediation services. In turn, the utilisation of new-found access to credit is leading to increased leverage and exposure to assets whose capital values are in principle sensitive to monetary conditions. Overall, the recent evolution of banking markets and financial systems has provided more ways for central banks to 20 influence the economy. The impression of an overall strengthening of the power of monetary policy obtained from surveying Table 4 is broadly confirmed in the results from an “opinion survey” of central banks participating in this meeting, summarised in Graph 3 below. This opinion survey made a number of statements that the respondents were asked to rate as being completely irrelevant to their situation (0), relevant to some extent (1), very relevant (2) or completely relevant (3). The statements thought by the average respondent to be most relevant describe increased effectiveness of monetary policy via expectations-related channels following greater predictability and heightened transparency. Greater sensitivity of households to interest rates due to increased leverage, and a strengthened exchange rate channel, were also rated as being relevant “to some extent”. Interestingly, changed hedging practices of financial institutions, corporates and households were considered to be hardly relevant factors in weakening interest rate transmission. This is somewhat in contrast with concerns in some developed markets about increased lending rate stickiness resulting from, inter alia, more active interest rate risk management by non-financial corporates, longer times between mortgage interest rate resets and generally greater optionality available to creditors. One possible reason that more fleet-footed interest rate risk management by corporates might not have been rated as a factor weakening the interest rate transmission channel is the perception that such developments have been offset by correspondingly higher corporate leverage. However, in many if not most of the countries surveyed, corporates have been deleveraging over a number of years. This is perhaps the reason that the statement relating more effective monetary policy transmission to greater corporate leverage found little resonance with respondents.
20
Some would argue that these gains come at a price, namely the ability of imperfectly informed agents to use greater financial freedom to make greater mistakes that individually might be of no real consequence but collectively might make for a more fragile system. For arguments along these lines, see Borio and White (2004). There are other reasons to be concerned about the potential for increases in boom-bust behaviour associated with credit market and other imperfections, especially in the EME context. Tornell and Westermann (2003) connect booms and busts following financial liberalisations to credit market imperfections, including those that generate currency mismatches (on which, see also Goldstein and Turner (2004)). Caballero and Krishnamurthy (2004) connect exchange rate volatility and the credit channel in emerging markets, arguing that in crisis conditions the interaction can render expansionary monetary policy impotent.
BIS Papers No 28
137
138
Table 4 Factors cited by central banks as influencing the effectiveness of monetary policy in recent years Reducing effectiveness
Increasing effectiveness
Overall effect
Asia • IR deregulation Î Ï power IT channel
China
• Ï ER flexibility gradually increasing indep of MP • Introduction of profit motive in state owned banks Î Ï sensitivity to MP • Ï bond market depth + Ï household borrowing Î wider sphere of influence for MP Hong Kong SAR
[Not regarded by HKMA as relevant] • IR deregulation Î Ï power IR channel
India Indonesia
• Float + liberalisation Î Ï relative role of ER, which is less amenable to MP influence
Korea
• Ð interest elasticity of real variables
• IR operating focus Î more precise control over policy instrument
More effective
• Ï share of banks post-crisis + Ï bond market depth + Ï household borrowing Î wider sphere of influence for MP [Too early to tell]
• Limited signs of reduced passthrough from money market IR to retail IR. Possibly associated with NPLs and sluggishness of lending.
BIS Papers No 28
Singapore Thailand
More effective (IR stickiness still, but declining) Less effective
Malaysia Philippines
[Not clear from response. More effective indirect channels, but early days. Some suggestion that direct channels are weaker, but not clearly stated.]
• Ð share of banks post-crisis + liquidity overhang Î Ð sensitivity of retail IR to money market IR
• Adoption of IT Î more leverage over expectations
More effective
• Switch from money targeting to IT reduced reliance on unstable relationships • Financial deepening Î wider sphere of influence for MP • Ï transparency w.r.t. operational target Î more effective influence over market
More effective
• ER float + Ï depth of capital markets Î Ï power asset price channel
Less effective
BIS Papers No 28
Table 4 (cont) Factors cited by central banks as influencing the effectiveness of monetary policy in recent years Reducing effectiveness
Overall effect
Increasing effectiveness
Latin America Brazil • Adoption of IT Î more leverage over expectations
Chile
More effective
• Financial deepening Î wider sphere of influence for MP • CB independence + adoption of IT Î more leverage over expectations
Mexico
More effective
• Lengthening of maturities Î Ï sensitivity of banks to IR • Financial deepening Î wider sphere of influence for MP • Ï transparency w.r.t. operational target Î more effective influence over market Europe • Adoption of IT Î more leverage over expectations
Czech Republic
More effective
• Ï experience of CB with IT Î more effective MP • Ï household borrowing Î wider sphere of influence for MP Hungary
• Deregulation + globalisation Î Ð role of IR channel
• Adoption of MP Î more leverage over expectations
Mixed
• Deregulation + globalisation Î Ï role of ER channel • Private sector willingness to hold FX risk Î Ï role of ER channel
Russia
• IR channel not very effective
• Switch from money targeting to IT reduced reliance on unstable relationships
More effective
• ER channel now more effective (ruble can compete with dollar), but creates trade-off for CB wanting to preserve export competitiveness • Financial deepening Î wider sphere of influence for MP • Ð speculative element in banking Î increased sensitivity to MP Turkey
• Adoption of IT Î more leverage over expectations • More precise control over policy instrument Î Ï power IR channel
ER = exchange rate; IR = interest rates; IT = inflation targeting; MP = monetary policy. Source: Central bank responses to a BIS questionnaire.
More effective
139
Graph 3
Recent changes in the transmission of monetary policy
Greater predictability of monetary policy is increasing the impact of changes in central bank interest rates on long rates
Market-based monetary policy is stronger?
Greater sensitivity of expectations to central bank words and actions is increasing the power of monetary policy Greater leverage is increasing the impact of changes in central bank interest rates on household behaviour Greater exchange rate flexibility is increasing the impact of changes in central bank interest rates on activity in the export- and importcompeting sectors Greater leverage is increasing the impact of changes in central bank interest rates on corporate behaviour Market-based monetary policy is weaker? Money and debt market immaturity is restricting the impact of changes in central bank interest rates on market interest rates Changed hedging practices within financial institutions are slowing the flow-through of central bank interest rates changes to financial institutions’ customers Changed hedging practices of corporates and households (eg term borrowing) are slowing the impact of changes in interest rates International financial market integration is increasing the range of intermediation options, decreasing the effectiveness of direct controls on banks by increasing disintermediation
Direct policy instruments are weaker?
Financial institutions are less responsive to moral suasion Onshore financial deepening is increasing the range of intermediation options, decreasing the effectiveness of direct controls on banks by increasing disintermediation Institutions are better at getting around direct controls
0
140
1
2
3
BIS Papers No 28
Of particular interest to the issues addressed in this paper is the perceived degree to which immature markets are seen as holding back the effectiveness of the interest rate channel of monetary policy. However, while this factor was not seen as being entirely irrelevant to the average country surveyed, nor did it quite reach the level of being relevant “to some extent”. At the same time as the effectiveness of market-based monetary policy is seen as increasing, the effectiveness of direct regulations is to some degree seen as being on the wane. Four statements relating to increasing difficulty in applying direct controls were rated as being relevant “to some extent”.
4.
Concluding remarks
Apart from China and to a lesser extent India, Indonesia, Venezuela and Russia, most countries in the emerging markets group have made the transition to full, or near-full, reliance on market-based mechanisms for monetary policy implementation, and for the distribution of monetary policy impulses through the financial system. Judging from the experience of countries in the group, the adoption of market-based mechanisms has more to do with attitudes towards government direction and regulation than with the state of development of financial markets. Indeed, market development may be more a function of the approach taken by policymakers than the other way around. Market-based monetary policy operations in liberalised financial markets may not uniformly improve monetary control. Especially for small open economies with few restrictions on capital mobility, external financial conditions might dominate, weakening the relative influence of central banks. Transmission of monetary policy impulses might also be interrupted when banking systems and/or enterprises are in bad health. Evidence of a weakening in the pass-through of changes in central bank interest rates can be found in the aftermath of financial crises in some EMEs. However, most central banks surveyed for this paper think that monetary policy is now more powerful than before. Accompanying changes in monetary policy frameworks, especially those that emphasise inflation targets, seem to be the most important factor. These changes harness the expectations channel to an extent not present in previous arrangements. In addition, greater financial depth within the private sector is thought to be important, consistent with an increased role of credit channel effects.
BIS Papers No 28
141
Annex 1: Estimating interest rate pass-through
Following De Brouwer (1995) we estimate pass-through of money market interest rates to bank lending rates using an error correction model of the following form: n
m
j =1
j =0
ΔLendR t = μ − β1LendR t −1 + β 2 MMRt −1 + ∑ π j ΔLendR t − j + ∑ θ j ΔMMRt − j
where LendR is the interest rate set on loans by banks, MMR is the money market interest rate (see Table 7 in this Annex for data definitions), and β2/β1 is the coefficient on the cointegrating relationship between money market and lending interest rates. De Brouwer used a standard general-to-specific method to find a suitably parsimonious specification of the dynamics; in general, this involved only the contemporaneous change in the money market rate, and in one case (Australia) also the first lag of the change in the money market rate. For consistency, we used De Brouwer’s estimating equation: ΔLendR t = μ − β1 (LendR t −1 − βMMR t −1) + θ 0 ΔMMR t where β = β2/β1. Estimation results are reported in Table 5 below. Table 5 Estimated pass-through from money market to domestic loan interest rates μ
1990 Q1-1994 Q4 Indonesia Malaysia Philippines Thailand Hong Kong SAR Singapore Australia Japan Canada United States
β1
β
Θ0
N.obs
AdjR
2
DW
SE
0.17 0.68** 2.38** 0.79* 0.74 0.60** 1.60** 0.60** 0.88** 0.45
0.08** 0.13** 0.53** 0.13** 0.14 0.17** 0.33** 0.22** 0.54** 0.13
1.60** 0.64** 0.85** 0.71** 0.49* 0.70** 0.86** 0.64** 0.94** 0.83**
0.06* 0.06 0.49** 0.04 –0.01 0.08* 0.70** 0.11** 0.58** 0.81**
60 60 60 60 48 60 60 60 60 60
0.51 0.37 0.56 0.23 0.05 0.50 0.71 0.75 0.38 0.64
2.50 2.63 2.31 1.81 1.48 1.66 2.14 1.30 1.80 1.61
0.39 0.10 1.01 0.36 0.33 0.13 0.18 0.06 0.49 0.13
0.80** 0.61 4.29** 0.16 –0.43* 0.65 0.95** 0.08** 1.95** 2.54**
0.09** 0.02 0.73** 0.05 –0.10** 0.13 0.25** 0.05** 1.12** 0.85**
0.67** –10.42 0.58** 1.60 1.04** 0.27** 0.94** 1.77** 1.00** 1.00**
0.03** –0.06 0.23* 0.09 0.01 0.09** 0.88** 0.27** 1.02** 0.92**
60 60 60 60 60 60 60 60 60 60
0.52 0.03 0.45 –0.00 0.19 0.12 0.89 0.41 0.93 0.98
1.85 2.16 2.02 1.89 0.91 1.60 2.74 1.96 2.10 1.97
0.14 0.06 0.79 0.14 0.17 0.04 0.05 0.01 0.06 0.03
2000 Q1-2004 Q4 Indonesia Malaysia Philippines Thailand Hong Kong SAR Singapore Australia Japan Canada United States
Note: * indicates significance at the 5% level; ** indicates significance at the 1% level. Source: BIS calculations.
142
BIS Papers No 28
The cumulative changes over n (1 and 12) months reported in Table 3 in the text are calculated as: n ⎛β γ + (1 − γ )∑ β1(1 − β1 ) j −2 where γ = ⎜⎜ 1 j =2 ⎝ β2
⎞ ⎟⎟(β 2 + θ 0 (1 − β1 )) ⎠
The breakdown in the explanatory power of the equation for Malaysia and Thailand, the reduced significance of the error correction term for Singapore, the negative coefficient on the error correction term in the second period for Hong Kong SAR and the reduced pass-through evident in Indonesia and Japan are together suggestive of a substantial change in the interest rate relationship between the two periods. A glance at the data suggests a marked reduction in the variance of both series. That is confirmed in the data reported in Table 6. Other potential explanations are discussed in the text. Table 6 Volatility of money market and lending rates Standard deviation of rates in first differences Money market rate
Lending rate
1990-94
2000-04
1990-94
2000-04
Indonesia
2.24
2.69
0.56
0.21
Malaysia
0.42
0.04
0.13
0.06
Philippines
1.66
1.05
1.52
1.06
Thailand
2.13
0.24
0.42
0.14
Hong Kong SAR
1.16
0.71
0.34
0.19
Singapore
0.48
0.22
0.18
0.05
Australia
0.36
0.15
0.33
0.15
Japan
0.24
0.03
0.12
0.01
Canada
0.60
0.22
0.63
0.22
United States
0.22
0.21
0.22
0.21
Source: BIS.
BIS Papers No 28
143
Table 7 Money and loan rate data definitions Money market rate
Lending rate
Australia
Weighted average short-term rate of outstanding loans. † Beginning in January 1995, rate paid on unsecured overnight loans of cash as calculated by the Australian Financial Markets Association and published on Reuters page at 11 am. † Beginning in January 1999, weighted average rate of the interest rates at which banks have borrowed and lent exchange settlement funds during the day. The rate is weighted by loan amounts.
Beginning in January 1977, rate charged by banks on loans to small and large businesses.
Canada
Rate refers to the overnight money market financing rate. Monthly figures are the average for the seven days ending the last Wednesday of the month.
Rate that chartered banks charge on large business loans to their most creditworthy customers; when there are differences among banks, the most typical rate is taken. Monthly figures are for the last Wednesday of the month.
Hong Kong SAR
Hong Kong interbank rate (Hibor) is the annual interest rate in Hong Kong dollars on lendings and borrowings made between banks in the interbank market for a specified period ranging from overnight to one year.
Rate quoted by the Hongkong and Shanghai Banking Corporation Limited.
Indonesia
Rate on one-day loans between commercial banks.
Weighted average rate charged by commercial banks on loans to the private sector for working capital in national currency. Rate is weighted by loan amounts.
Japan
From November 1990, lending rate for collateral and overnight loans in the Tokyo Call Money Market. Previously, lending rate for collateral and unconditional loans.
Before 1993, the lending rate excluded overdrafts. Beginning in 1993, weighted arithmetic average of contracted interest rates charged by all banks on both short- and long-term loans, discounts and overdrafts.
Malaysia
Weighted average overnight interbank rate. Monthly rates refer to the average for the trading days of the month. Daily rates are calculated as the average of interbank deposit rates for the day, weighted by the volume of transactions.
Weighted average rate offered by commercial banks on all loans in national currency. The rate is weighted by loan amounts.
Philippines
Weighted average rate on overnight loans between commercial banks, thrift banks, savings banks and non-bank financial institutions with quasi-banking functions to cover reserve deficiencies. The rate is weighted by loan amounts.
Weighted average rate on 91-day treasury bills denominated in national currency. Rate is weighted by the volume of bills sold.
Singapore
The rates are the modes of the three-month interbank rates quoted by money brokers. Monthly data refer to the rates on the last Friday (or working day closest to the last Friday) of the month.
Average minimum rate charged by the 10 leading commercial banks.
Thailand
Rate on loans between commercial banks. † Beginning in January 1989, daily average of commercial banks’ overnight rates for interbank lending.
Minimum rate charged by commercial banks on loans to prime customers.
United States
Federal funds rate: weighted average rate at which banks borrow funds through New York brokers. Monthly rate is the average of rates of all calendar days, and the daily rate is the average of the rates on a given day weighted by the volume of transactions.
Base rate charged by banks on short-term business loans. Monthly rate is the average of rates of all calendar days and is posted by a majority of the top 25 insured US chartered commercial banks.
Sources: Thomson Financial for Hibor; IMF International Financial Statistics for all other rates.
144
BIS Papers No 28
Annex 2: Interest rate corridors
The use of standing facilities to create corridors to bound the fluctuation of short-term money market interest rates is now common in both developed and emerging market contexts. Discretionary open market operations were seen as a point of difference between more and less sophisticated central banks, with the latter relying more on bank-initiated transactions through standing facilities. 21 From the perspective that monetary policy is about controlling the quantum of the money base, transactions at the discretion of the central bank seem superior to transactions at the discretion of banks. Nowadays, however, monetary policy is seen as more about controlling interest rates than the money base. Discretionary open market operations are accordingly targeted on achieving a given level of short-term interest rates. A number of advanced central banks now use standing facilities with quite narrow interest rate spreads (eg +/– 25 bp in the cases of Australia, Canada and New Zealand) to determine the prevailing level of short-term money market interest rates, with open market operations used for the secondary objective of smoothing liquidity and moderating interest rate fluctuations. These standing facilities make the quantity of central bank cash explicitly endogenous, by providing unlimited access (subject only to collateral requirements and institutional rules on who is eligible to 22 maintain current balances with the central bank) to extra cash at the posted interest rate. This creates the ceiling for market interest rates. With unlimited access also to a deposit facility at the posted rate, the return on the next best alternative use of funds is established, creating a floor for market rates. The essential reason for the use of standing facilities to create an interest rate corridor is the simplicity and transparency of the corridor arrangement, features that are of at least as much value to emerging market central banks as they are to their developed country counterparts. The operation of a corridor arrangement is illustrated by the Czech Republic’s experience, shown in Graph 4. On most days, short-term interest rates in the market are close to the target (two-week repo) rate, and well inside the interest rates posted for the lombard (borrowing) facility and the deposit facility. Occasionally, where for example liquidity forecasts underlying decisions on the quantum of open market operations have gone wrong, or some frictions have prevented full allocation of amounts offered at the open market tenders, an unusual surplus or deficit of cash might arise. A surplus shows up as a spike in settlement balances at the central bank, often accompanied by a dip in the overnight market interest rate towards, but not below, the corridor’s floor. A deficit shows up as a spike in the use of the lombard facility, often accompanied by a rise in the overnight interest rate towards, but not above, the corridor’s ceiling. As can be seen from Graph 4, liquidity surpluses have recently been more common in the Czech Republic, but overnight interest rates have only rarely been very far from the policy target rate.
21
For example, Van ‘t dack (1999, p 4) highlighted the point that “a higher proportion of reserves is now supplied through operations in open markets, with the use of standing facilities limited to providing marginal accommodation or serving as emergency finance” as an example of the modernisation of operating procedures.
22
Note that in extreme circumstances, central banks might place restrictions on access to the lending window even before limits associated with lack of available collateral bind. For example, central banks might be unable or unwilling to raise interest rates fast enough to choke off demand for central bank credit. In some crisis situations, the demand for central bank credit might become interest-insensitive. In these situations, quantitative limits might be the only means available to avoid inadvertently funding a flight to foreign currency, for example.
BIS Papers No 28
145
Graph 4 The interest rate corridor and use of standing facilities in the Czech Republic Spike to 10.2 [= CZK 89 billion (10.2-1.25)*10]
5
Use of deposit facility
5
Use of lombard facility
4
4 Lombard facility interest rate
3
3
2
2
1
1 Deposit facility interest rate
0 January 2004
0 May 2004
September 2004 January 2005
May 2005
September 2005
Note: Use of facilities is measured in units of CZK 10 billion and plotted relative to the corresponding facility’s interest rate.
146
BIS Papers No 28
Annex 3: Supplementary tables
Table 8 Types of market operations employed Issue of CB paper China
Issue of govt paper
Yes
India
Purchase and sale of bonds
Repos/ reverse repos
Foreign exchange swaps
Taking deposits/ borrowing
Yes
Yes
Indonesia
Yes
Korea
Yes
Yes
Yes
Malaysia
Yes
Yes
Yes
Yes
Philippines
Yes
Yes
Yes
Singapore
Yes
Yes
Yes
Yes
Yes
Yes
Yes
Thailand
Yes
Argentina
Yes
Yes
Yes
Brazil
Prohibited
Yes
Yes
Chile
Yes
Yes
Yes
Yes
Yes Yes
Peru
Yes
Venezuela
Yes
Czech Republic
Yes
Hungary
Yes
Yes
Yes
Poland
Yes
Yes
Yes
Yes
Yes
Israel
Yes Yes
Yes Yes
South Africa
Yes
Turkey
Yes
Yes
Yes
Yes
Yes
Yes
Yes
Yes
Yes Yes
Yes
Saudi Arabia
Yes
Yes
Mexico
Russia
Transfer of govt deposits
Yes Yes
Colombia
Loans
Yes
Yes Yes
Yes
Yes
Yes
Yes
Yes
Yes
Yes
Yes
Yes
Occasionally
Yes
Yes Yes
Yes
Yes
Sources: IMF; Hawkins (2005); BIS.
BIS Papers No 28
147
148
Table 9 Overall index of non-market monetary policy operations Direct instruments
Index factor China Hong Kong SAR India Indonesia Korea Malaysia Philippines Singapore Thailand
H
I
J
5
1
1
6%
Yes
1
5% 9% 5% 4% 9% 3% 6%
Yes Yes
1 1 2 2 1 2 1
D
E
F
5
1
1
0.1
Yes
Yes
No
Yes
Yes Yes Yes Yes Yes Yes Yes
C
5
5
G
Uniform rate?
B
A
Remunerated?
NMMPO Index Value
Adjusted last 5 yrs for mon pol?
Directed credits
Bank-bybank credit ceilings
Statutory liquidity requirements?
Maximum reserve ratio
Reserve requirement ?
Interest rate controls
Yes
Reserve requirements
Yes
No No
BIS Papers No 28
Argentina Brazil Chile Colombia Mexico Peru Venezuela
Yes Yes Yes Yes
No No No No
Yes Yes
No
Czech Republic Hungary Poland
Yes Yes Yes
Russia Turkey Israel Saudi Arabia
Yes Yes Yes Yes
No No No
Yes
Yes Yes
15.75 0 9.5 5.5 8 1.8 3.9 2.6 1.6
35% 45% 9% 13% 0% 20% 15%
0 1 1 1 2 2
2 6.5 2.9 3.3 0 6 4
2% 5% 3.5%
0 0 0
1 1 1
3.5% 11% 6.3% 7%
2 1 2 2
Yes Yes Yes Yes
2.7 4.1 4.26 4.4
Note: Column C: China uses window guidance to influence the structure of credit; India has measures to direct credit towards the rural sector; Korea uses the Aggregate Credit Ceiling system to direct credit towards small and medium-sized enterprises. Column H takes value of 0 if required reserves are remunerated at fully or at very near market rates, 1 if partially remunerated and 2 if mostly not remunerated. Column J is calculated as {Σ(A..C) + [D+E+(F*G*H)] + I}. Sources: National sources; Hawkins (2005).
References Afanasieff, T S, P M Villa Lhacer and M I Nakane (2001): “The determinants of bank interest rate spread in Brazil”, Central Bank of Brazil Working Paper Series no 46. Ahearne, A G and N Shinada (2004): “Zombie firms and economic stagnation in Japan”, paper prepared for a CGP Program Part 2 conference on Macro/financial issues and international economic relations: policy options for Japan and the United States, Ann Arbor, October. Alexander, W E, T J T Baliño and C Enoch (1995): “The adoption of indirect instruments of monetary policy”, IMF Occasional Paper No 126. Bank for International Settlements (1996): “Changing financial systems in small open economies”, Policy Papers no 1. Bank of Korea (2003): Monetary Policy in Korea, available on http://www.bok.or.kr/template/eng/ default/mpolicy/view.jsp? Barth, J, G Caprio and R Levine (2002): “ Bank regulation and supervision: what works best?”, NBER Working Paper 9323, November. Bensidoun, I, V Coudert and L Nayman (1997): “Interest rates in East Asian countries: internal financial structures and international linkages”, CEPII document de travail no 97-02. Berstein, S and J R Fuentes (2004): “In there lending rate stickiness in the Chilean banking industry?”, in L A Ahumada and J R Fuentes (eds), Banking Structure and Monetary Policy, Central Bank of Chile conference volume. Bank for International Settlements (1996): “The determination of long-term interest rates and exchange rates and the role of expectations”, Conference Papers, vol 2, July. Bonin, J P and M Imai (2004): “Soft related lending: a tale of two Korean banks”, Department of Economics, Wesleyan University. Borensztein, E and J-W Lee (2000): “Financial crisis and credit crunch in Korea: evidence from firmlevel data”, IMF Working Paper 00/25, January. Borio, C E V (1997a): “Monetary policy operating procedures in industrial countries”, in Implementation and tactics of monetary policy, BIS Conference Papers, vol 3, March. ——— (1997b): “Credit characteristics and the monetary policy transmission mechanism in fourteen industrial countries”, in Alders (ed), Monetary Policy in a Converging Europe, Kluwer, Amsterdam. Borio, C E V and W R White (2004): “Whither monetary and financial stability? The implications of evolving policy regimes”, BIS Working Papers no 147, February. Brock P L and L Rojas-Suarez (2000): “Understanding the behaviour of bank spreads in Latin America”, Journal of Development Economics, 63. Caballero, R J and A Krishnamurthy (2004): “Exchange rate volatility and the credit channel in emerging markets: a vertical perspective”. Ceccetti, S G (1995): “Distinguishing theories of the monetary transmission mechanism”, Federal Reserve Bank of St Louis Review, 77/3. Chinn, M and M Dooley (1995): “Asia-Pacific capital markets: integration and implications for economic activity”, NBER Working Paper No 5280, September. Christiano, L J, M Eichenbaum and C Evans (1998): “Monetary policy shocks: what have we learned and to what end?”, NBER Working Paper 6400, February. Cottarelli, C, G Ferri and A Generale (1995): “Bank lending rates and financial structure: a case study”, IMF Working Paper 95/38. Cottarelli, C and A Kourelis (1994): “Financial structure, bank lending rates, and the transmission mechanism of monetary policy”, IMF Working Paper 94/93, March. De Brouwer, G (1995): “The liberalisation and integration of domestic financial markets in western Pacific economies”, Reserve Bank of Australia Research Discussion Paper 9506, September.
BIS Papers No 28
149
De Haan, L (2003): “Microdata evidence on the bank lending channel in the Netherlands”, De Economist, 151 No 3. Demirgüç-Kunt, A, L Laeven and R Levine (2004): “Regulations, market structure, institutions and the cost of financial intermediation”, Journal of Money, Credit and Banking, 36(3), June. Di Lorenzo, G and G Marotta (2005): “A less effective monetary transmission in the wake of EMU? Evidence from lending rates pass-through”, Università degli Studi di Modena e Reggio Emilia Dipartimento di Economia Politica Materiali di discussione No 482, June. Disyatat, P and P Vongsinsirikul (2002): “Monetary policy and the transmission mechanism in Thailand”, Monetary Policy Group Discussion Paper 04/2002, October. Ehrmann, M, L Gambacorta, J Martínez-Pagés, P Sevestre and A Worms (2001): “Financial systems and the role of banks in monetary policy transmission in the Euro area”, Banco de España Working Paper No 118. Espinosa-Vega, M A and A Rebucci (2004): “Retail bank interest rate pass-through: is Chile atypical?”, in Banking Structure and Monetary Policy, edited by L A Ahumada and J R Fuentes, Central Bank of Chile conference volume. Fernandez, Viviana (2004): “The credit channel in an emerging economy”, Centre for Applied Economics, University of Chile, unpublished paper. Fukuda, S, M Kasuya and J Nakajima (2005): “Deteriorating bank health and lending in Japan: evidence from unlisted companies undergoing financial distress”, CIRJE Discussion Paper F-364, September. Gambacorta, L (2004): “How do banks set interest rates?”, NBER Working Paper no 10295, February. Gertler, M and S Gilchrist (1993): “The role of credit market imperfections in the monetary transmission mechanism: arguments and evidence”, Scandinavian Journal of Economics, 95/1. ——— (1994): “Monetary policy, business cycles, and the behaviour of small manufacturing firms”, Quarterly Journal of Economics, May. Glick, R and R Moreno (1994): “Capital flows and monetary policy in East Asia”, Centre for Pacific Basin Monetary and Economic Studies, Federal Reserve Bank of San Francisco, Pacific Basin Working Paper no 94(8). Goldstein, M and P Turner (2004): Controlling currency mismatches in emerging markets, Institute for International Economics, Washington DC. Hannan, T and A Berger (1991): “The rigidity of prices: evidence from the banking industry”, American Economic Review, 81(4). Hawkins, J (2005): “Globalisation and monetary operations in emerging economies” in Globalisation and monetary policy in emerging markets, BIS Papers no 23, May. Ho, C and R N McCauley (2003): “Living with flexible exchange rates: issues and recent experience in inflation targeting emerging market economies“, BIS Working Papers no 130, February. Horváth, C, J Krekó and A Naszódi (2004): “Interest rate pass-through: the case of Hungary”, Magyar Nemzeti Bank Working Paper 2004/8, January. International Monetary Fund (2004): “Monetary policy implementation at different stages of market development”, Paper prepared by the staff of the Monetary and Financial Systems Department. Kamin, S, P Turner and J Van ‘t dack (1998): “The transmission mechanism of monetary policy in emerging market economies: an overview”, BIS Policy Papers no 3, January. Kashyap, A K, J C Stein and D W Wilcox (1993): “Monetary policy and credit conditions: evidence from the composition of external finance”, American Economic Review, 83/1. Kim, H E (1999): “Was credit channel a key monetary policy transmission mechanism following the recent financial crisis in the Republic of Korea?”, World Bank Policy Research Working Paper 3003, April. Kose, M A, E Prasad, K Rogoff and S-J Wei (2005): “The macroeconomic implications of financial globalization: a reappraisal and synthesis”, unpublished paper, November.
150
BIS Papers No 28
Martinez Peria, M S and A Mody (2004): “How foreign participation and market concentration impact bank spreads: evidence from Latin America”, World Bank Policy Research Paper 3210, February. Mojon, B (2000): “Financial structure and the interest rate channel of ECB monetary policy”, ECB Working Paper no 40. Neumark, D and S Sharpe (1992): “Market structure and the nature of price rigidity: evidence from the market for consumer deposits”, Quarterly Journal of Economics, 107(2). Sellon, G H Jr (2002): “The changing US financial system: some implications for the monetary transmission mechanism”, Federal Reserve Bank of Kansas City Economic Review, First quarter. Tornell, A and F Westermann (2003): “Credit market imperfections in middle income countries”, a paper prepared for the conference Financial Market Development in Latin America, Centre for Research on Economic Development and Policy Reform at Stanford University (this version January). Van ’t dack, J (1999): “Implementing monetary policy in emerging market economies”, in Monetary policy operating procedures in emerging market economies, BIS Policy Paper No 5, March.
BIS Papers No 28
151
Banking issues in Argentina Miguel Angel Pesce 1
I.
Banks and aggregate credit: what is new?
The convertibility plan ended in January 2002 in the middle of a huge social, financial and economic crisis. With a new set of relative prices in place, the economy started its recovery in the second half of 2002. The positive evolution of the economy then allowed the financial sector to begin its recovery from the crisis and since the second half of 2003, private sector credit has been steadily growing again within a framework of strong macroeconomic growth and orderly monetary and fiscal policies. The subsequent measures implemented by the Central Bank (Banco Central de la República Argentina, BCRA) to foster local credit have had a favorable effect on credit evolution. Amongst the most relevant measures the following can be mentioned: (i) the relaxation of the classification of debtors that refinanced their obligations; (ii) the option for banks to grant new financing above the current limit of 300% of the net capital of the debtor; (iii) the reduction of provisions and of classification of debtors which refinanced their debts with reductions; (iv) the increase of the maximum limit for commercial credits from $200 to $500 thousand, which was established as a criterion so that institutions could apply consumption-portfolio guidelines as regards classification of debtors as well as credit rating and fractioning. As a result of the favorable macroeconomic context and the measures adopted by the Central Bank, credit to the private sector grew by 25% in 2004, while the accumulated figure in 2005 shows an increment of 36% (yearly; see Chart I.1). Although the sustainable recovery of the financial system continues, there are still short and medium term pending tasks. Even though the expansion of private sector credit has characterized the financial system for the last two years, private loans have only reached around 23% of total assets and approximately 10% of GDP (see Chart I.2). These values are below both domestic historical and international levels. The vast potentiality for expansion of financial activity should materialize together with the introduction of adequate criteria for debtor assessment. These will be key mechanisms for financial system performance in the medium term. Chart I.1
Chart I.2
Private Credit Evolution
Loans to Non-Financial Private Sector % of GDP
million $ 55,000
180 164
160 50,000
140 120
45,000
99
100 80 40,000
61
60 40
35,000
24
20
28
10
0
30,000 Jun-02
65
Oct-02
Feb-03
Jun-03
Oct-03
Source: BCRA
1
Feb-04
Jun-04
Oct-04
Feb-05
Jun-05
Oct-05
Arg. Sept-05
Arg. 1999
Brazil 2004
USA 2004
Chile 2004
Japan 2004
RU 2004
Sources: IMF, INDEC and BCRA
Deputy Governor.
BIS Papers No 28
153
With the purpose of spurring medium and long term private financing, the BCRA is encouraging the reduction of financial institutions’ exposure to the public sector. In this sense, it was established that institutions’ maximum lending to the public sector should fall below 40% of total assets as from 2006 (see Chart I.3). In addition, the schedule for the valuation of public sector assets at realization value is being implemented, thus improving the quality of balance sheet information and resulting in both a lowering of the portfolio due to revaluation and a major incentive for selling these assets. This last point will also be stimulated by the conclusion of compensations for asymmetric pesification. Chart I.3 Public and Private Credit Risk As a % of netted assets - 3-months moving average
% 60 55 50 45 40
Private Credit
35
Public Credit
30 25 20 15 Dec-98
Jul-99 Feb-00
Sep-00 Apr-01 Nov-01
Jun-02 Jan-03 Aug-03 Mar-04 Oct-04 May-05
Source: BCRA
As regards costs, a sustainable fall in the interest rates of all credit line categories has been registered in the last three years. In the last few months, the large idle lending capacity of financial institutions together with the lower credit risk of companies has led interest rates paid by the corporate sector to relatively low levels (see Chart I.4). Chart I.4 Commercial Loans Margin between lending interest rate and that of time deposits (less than 59 days) ANR, % 25 23 21 18.6
Advanced payments
19
Documents
17 15 13 11
12.6 10.8
10.9
9 7
7.5 7.0 7.1 6.1 5 Sep-03 Nov-03 Jan-04 Mar-04 May-04 Jul-04 Sep-04 Nov-04 Jan-05 Mar-05 May-05
Source: BCRA
154
BIS Papers No 28
The most dynamic sectors in the current macroeconomic context (construction, manufacturing and exports) have access to corporate financing. In this sense, industry and primary production of goods financing represented, in September, 60% of lending to companies (see Chart I.5). Commerce and construction lending remained stable at 13% and 6% respectively. Only the services sector registered a decline in 2005, representing 22% of the financing portfolio. Non-performing loans (NPLs) as a percentage of total financing has steadily been declining as from 2004 in all sectors (see Chart I.6). Chart I.5
Chart I.6
Productive Sectors’ Exposure
Productive Sectors’ NPLs
As a % of netted assets
NPLs Portfolio as a % of financing
% AN 18 16
Utilities
Industry
Commerce
Construction
%
Primary Production
65
55
14 12
45
10 35
8 6
25
4 15
2
Construction
Industry
Primary Production
Utilities
0
Jun-02
Commerce
Oct-02
Feb-03
Jun-03
Oct-03
Feb-04
Jun-04
Oct-04
Feb-05
Jun-05
Source: BCRA
5
Jun-02
Oct-02
Feb-03
Jun-03
Oct-03
Feb-04
Jun-04
Oct-04
Feb-05
Source: BCRA
Unlike in 2004, in the first half of 2005 credit lines for large companies were responsible for credit growth (see Chart 1.7). This expansion was consistent with the relatively low levels of non-performing loans (NPLs) associated with this type of credit. The appearance of new niches in both the local and export markets will lead to better repayment by these companies. Chart I.7 Corporate Financing Evolution according to Size Index Dec-03=100 % 200
180
Small (up to $200 thousand)
Large (more than $5 million)
Medium (from $200 thousand to $5 million)
160
140
120
100
80 Dec-03
Mar-04
Jun-04
Sep-04
Dec-04
Mar-05
Jun-05
Source: BCRA
Lending to households has shown robust growth, generating an increase of the financial system exposure to individuals’ credit risk of nearly 9% of assets in mid 2005 (see Chart I.8). The favorable evolution shown by secured loans (pledge backed loans) should also be mentioned (even though they still represent less than 5% of lending to the household sector) as well as the steady growth of personal loans and credit cards; these categories represent half of household financing. Additionally,
BIS Papers No 28
155
Jun-05
in the third quarter of 2005 the granting of mortgage loans increased for the first time after the crisis (especially because this was being promoted by a small group of strong banks). However, the evolution of the total stock of mortgages is still being affected by significant depreciation. Chart I.8 Household Sector NPLs and Exposure %
%
12
35
30
11
25 10 20 9 15
8
Financing/Netted Assets
10
NPLs Portfolio/Financing (right axis) 7
5 Jun-02
Dec-02
Jun-03
Dec-03
Jun-04
Dec-04
Jun-05
Source: BCRA
The increase of formal employment, with higher salaries, is generating an improvement in household finances. These factors, combined with the strategies of the financial institutions for granting more credit to that sector (concentrating their credit portfolio and thus their counterparty risks), within the framework of higher competition, have led to a steady fall in interest rate costs (see Chart I.9). Chart I.9 Consumer Loans Margin between lending interest rate and that of time deposits (less than 59 days) ANR % 33 30.8 31 28.7
29
29.5
27
26.0
25
Personal
25.4
Credit Cards
24.4
23
22.2 21.9
21 Oct-03
Dec-03 Feb-04 Apr-04
Jun-04 Aug-04 Oct-04
Dec-04 Feb-05 Apr-05
Jun-05
Source: BCRA
The decline in interest rates is consistent with the reduction of implicit household credit risk, and for this reason the quality of the portfolio’s indicators have improved. The favorable prospects for economic growth for the rest of 2005 and for 2006 have set up an encouraging scenario for the recovery of household lending. As regards demand, the strengthening of the labor market is allowing households to finance a huge proportion of their consumption expenditure through consumer loans. Household lending will remain strong as a result of the good banking liquidity and the optimistic perspectives regarding the risk-return relation for families.
156
BIS Papers No 28
II.
Changing Nature of Banks’ Risk Exposure
In the last three years the financial system has succeeded in reducing its exposure to potential shocks that could have endangered financial stability. However, in terms of economic activities an increase in domestic interest rates might affect the positive trend reflected by the improved performance of the lending portfolio assigned to the private sector. This kind of shock may further cause adverse effects as a result of a currency mismatch between a financial entity’s assets and CER-adjustable liabilities (CER: price-indexed Reference Stabilization Coefficient). In the case of institutions holding marked-tomarket government securities, such a shock may even affect their net worth. The current encouraging macroeconomic framework has given rise to a decrease in the counterparty risk to which the financial system is subject, with continuous improvement in financial institutions’ asset quality. Nevertheless, making allowances for the mounting exposure to traded sectors within the economy over the last few years, an international drop in commodity prices or an exchange rate appreciation could reduce their competitiveness or otherwise affect their levels of non-performance. Household lending may be an additional source of potential weakness in the face of a decrease in the rhythm of economic growth. A prudential implementation of lending criteria with an in-depth assessment of related risks may smooth this risk. As regards market risk, an increasing number of financial institutions are currently assessing the whole of their government securities holdings at market values. Nonetheless, there is a schedule in place to gradually adjust a substantial portion of government securities recorded at accounting values (according to the rule on investment accounts) to market prices. Even though market valuation may cause volatility in financial institutions’ results, this effect is well counteracted by the income derived from the better reputation of banks that manage their assets and, therefore, their net worth on a more transparent basis. Prudential management of risks and the fulfillment of pay-in capital requirements for market risk may soften potential effects of these instruments’ volatility. From the viewpoint of currency risk, the BCRA has set out that a financial entity’s lending capacity arising from foreign currency denominated deposits shall be basically allocated to those sectors eligible to make reimbursements in foreign currency (manufacturers of goods subject to export). Any lending capacity in excess causes an additional requirement of minimum cash in foreign currency. Thus, financial institutions shall hold such a foreign exchange surplus in cash or else deposit it with the BCRA. This mechanism helped to reduce the risk carried by the financial system over the 1990s: an implied mismatch of foreign currency within the Argentine financial system made the peso devaluation contribute with a remarkable growth of NPLs granted in foreign currency to non-tradable sector economic agents with a yield in pesos. Over the past year and a half, securitization of assets with private sector risk has been expanded on a domestic basis (government sector securities have also been transferred to trust funds), thus providing institutions with a mechanism for obtaining additional resources to place new loans but with lower credit risk. In addition, banks may channel a portion of their resources through BCRA assets, with immediate liquidity and low maturity. The implementation of these mechanisms reduces the potential risks of financial institutions that receive US dollar denominated deposits. As regards banking liabilities, the BCRA is devoted to encouraging the term-deposit secondary market with a view to providing these instruments with liquidity. This mechanism may allow the attainment of an increase in private placement maturity within the financial system. It is worth mentioning that upon the implementation of a floating rate system, the BCRA role of lender of last resort was fully restored. In connection with the liquidity assistance provided by the BCRA to financial institutions undergoing liquidity problems, the applicable rule has provided for a transparent lending regime. As far as hedge instruments are concerned, the BCRA is currently devoted to finding market solutions so that financial institutions can hedge against foreign exchange and real interest rate risk exposure. In this sense, it is important to point out that the dollar forward market has been increasingly active. Focusing on the fact that capital markets and the financial system supplement each other, we may conclude that a widened capital market may help banks to attain longer term funding, which may, in turn, allow enlargement and improvement in the conditions under which banks may furnish loans to companies and households. In this regard, it should be remarked that asset securitization has been gathering momentum (particularly the creation of trust funds out of consumer and mortgage-backed loans).
BIS Papers No 28
157
Furthermore, futures and hedge market development is of paramount importance. The need for an adequate and active operation of these markets is particularly relevant to domestic banks with a view to attaining better management of their risks as well as rendering hedging services to their customers. The BCRA has played an active role in spurring forward markets by taking part in them. The dollar futures market has recently started to widen, and the interest rate futures market is expected to do so.
III.
An Evaluation of Major Structural Changes
After the Tequila crisis of end-1994, a substantial group of financial institutions, mostly cooperative and provincial banks, withdrew from the market or merged with other institutions which were free of liquidity and/or creditworthiness problems. This situation led to a sizeable reduction in the number of institutions operating in the domestic field (from 205 in 1994 to 138 by December 1997). Moreover, in the second half of the 1990s, large national private institutions were sold to non-residents; consequently, capital inflows entered the financial system. From a global viewpoint, even though the 1998-2000 period showed a slight decrease in the number of institutions making up the financial system, a significant downsizing of its structure only came to pass subsequent to the 2001-2002 crisis (a significant reduction in both branches and staff; see Chart III.1). Chart III.1 Financial System Structure thousands
staff and entities
230
5,0
210
Staff (thousands)
Entities (units)
Branches (right axis)
190
4,5
170 150 4,0 130 110 3,5
90 70 50
3,0 1994
1995
1996
1997
1998
1999
2000
2001
2002
2003
2004
Jun-05
Source: BCRA
According to the Argentine experience, foreign banks’ private financing endured a larger constraint over the 2001-2002 crisis (dropping to less than half of the end-1997 volume) with a slower recovery during the post-crisis period vis-à-vis both national private and public banks. Although foreign-owned banks’ current participation in the private lending market is the largest, since the period of financial stress (1998-2002) foreign banks have lost almost 7% of their market share, while national private banks have increased their weight (a gain of 10% of that market). This performance has been basically driven by two factors: market and purchase. The former effect accounts for a reduction (in certain cases) in the exposure of foreign banks’ portfolios within the domestic economy (supply) and a clear loss of public trust in foreign banks, shifting their confidence to domestic banks (demand). Secondly, a series of mergers and purchases occurred during the post-crisis period; as a result, foreign-owned institutions became banks owned by residents. Accordingly, since 2001, the number of foreign banks has decreased almost by a fourth (seven institutions), while the drop in the number of domestic private banks in the same period was 10% (four institutions). As from 2004, the aggregate financial system structure paved the way for adapting to the new postcrisis scenario. The level of employment began to grow as from March 2004, consistent with a context characterized by a substantial recovery in the productivity of factors during the previous few years (see Chart III.2), largely related to the process of re-intermediation, effectiveness in the combination and use of factors and technological advances.
158
BIS Papers No 28
Chart III.2 Factor Productivity At 1999 prices Million $
Million $
0.75
1.4 Average Dec.’97/D ec.’01: 1.3 million (right axis)
1.3 Average Dec.’97/D ec.’01: 0.7 million
0.70
1.2
Private deposits/Employment (Private deposits + private loans) / Employment (right axis)
0.65
1.1
1.0 0.60 0.9
0.8
0.55 Mar-03
Jun-03
Sep-03
Source: BCRA
Dec03
Mar-04
Jun-04
Sep-04
Dec04
Mar-05
Jun-05
Although the financial system as a whole deepened its trend towards concentration as from 2001 (see Chart III.3), due mainly to an increase in the private national banks’ market share (larger participation in private deposits) and a series of purchases of foreign banks by private national players, the degree of concentration of deposits in private financial institutions fell over the same period. This behavior was mostly related to the flight of private deposits to public banks (seen as having an implicit guarantee from the government) and the concentration of government deposits in this group of banks. As the public sector, both national and provincial, began to obtain fiscal surpluses, these surpluses became higher amounts of deposits in public banks. Chart III.3 Financial System Concentration Deposits %
IH H
60
1,100
56 900 52
700
48
44
IHH Financial System 500
IHH – Private Banks 40
5 G reater entities (right axis) 300
36 1996
1997
1998
1999
2000
2001
2002
2003
2004
Jun-05
Source: BCRA
New organizational designs for financial institutions face certain challenges from the regulatory and supervisory standpoint. On many occasions, the ownership of Non-Banking Financial Intermediaries (NBFIs - namely, pension and retirement funds, mutual investment funds and insurance companies) and banks has been concentrated in so-called financial conglomerates, which opens the possibility for their members to conduct transactions among themselves, a source of both benefit and cost for consumers and financial stability alike. One of the benefits involves taking advantage of lower costs for production turnover and the unification of activities (administrative and sales activities, inter alia), with an impact on the effectiveness of the financial sector. In addition, institutions in good standing with “know your client” policies may offer new services with lower costs for marketing and monitoring. Nevertheless, there are potential risks connected with conglomeration, as the Argentine financial experience in the 1990s shows us. For instance, large institutions may incur excessive risks in the
BIS Papers No 28
159
hope of a future government bailout, whereby they may endanger the rest of the system. In addition, conglomerates may find ways to avoid complying with certain regulatory aspects by acting among financial segments subject to diverse regulations or taking advantage of legal gaps. On account of these potential effects and their systemic relevance, financial conglomerates are a phenomenon to be monitored with a view to preserving financial stability. Every type of financial intermediary poses inherent risks which affect their sector and global financial stability, basically due to the existence of different types of sector interconnection. In this respect, investment by type of institution in another, such as acquisition of mutual fund units by pension funds or through their deposits in banks, opens a direct channel by which a sector’s liquidity needs may affect those of the rest. In addition, shareholdings among companies from different financial segments constitute another transmission channel. These links make potential vulnerabilities of a conglomerate’s company affect profitability, and consequently, it could impact on the group solvency as a whole with possible systemic effects. Furthermore, different regulations within each financial sector could cause distortions, which may lead to inefficient resource allocation. The existence of less-taxed segments or those with relative advantages in their operating system presents arbitration opportunities, especially in a context of growing similarity between financial products. In terms of Argentina’s experience, most banking institutions have shareholdings in pension and retirement funds, insurance companies and/or companies managing mutual investment funds, whereas other banks participate in NBFIs indirectly through related companies or the financial group to which they belong. In fact, on the basis of 90 financial institutions acting in the domestic market, 24 of them hold shares (directly or indirectly) in one or more segments of an NBFI and/or in other banks. This group is segmented as follows: 13 participate in an NBFI or in another bank, six act in two of the above mentioned intermediaries, three in three of them, and the remaining two financial institutions are fully universal. The domestic conglomeration level is made more prominent in terms of the size of institutions. If only assets administered by NBFIs are considered, more than 60% of them are handled by conglomerates. Making allowances for the fact that larger financial institutions are the main institutions connected with NBFIs, this value reaches 80% in terms of the total amount of financial intermediaries. At the domestic level, the creation of the pension and retirement fund market as from 1994 and the influx of large foreign financial groups in the second half of the 1990s fostered the expansion of this undesirable phenomenon. However, conglomeration is not currently linked with a given type of entity. National private, foreign and public institutions manage 25%, 42% and 33%, respectively, of overall conglomerate assets. It should be noted that during 2000-2001, an analytical task force reporting to the Ministry of Economy was appointed to analyze the issue of regulation of all domestic financial players. Then, during 2003, a decree was passed implementing a Cabinet for Financial Regulatory and Supervisory Coordination as a forum to discuss and coordinate the action of the Ministry of Economy and different institutions supervising financial services, albeit with a reduced executive capacity. In terms of financial institutions’ supervision by the Superintendence of Financial and Exchange Institutions (SEFyC), it is important to point out that SEFyC implements consolidated regulatory principles. Financial institutions must submit their accounting statements and other relevant data requested pursuant to effective rules on consolidation (on a monthly and quarterly basis). The levels of consolidation are inclusive of an entity’s affiliates in the country and abroad, subsidiaries in the country and abroad, and institutions where 12.5% or more of their voting power is under their control. The assessment of an entity’s creditworthiness and compliance with technical ratios to determine its eligibility for loan assistance measures any financing supplied to such an entity either directly or through its subsidiaries. After the outbreak of the crisis, the regulation requiring financial institutions to obtain a certain quarterly rating by an international rating agency, with the intention of fostering market discipline by private agents, was left in abeyance (compiled text for “Evaluation of Financial Institutions” is available at the BCRA web site). The BCRA publishes a monthly Report on Banks with information about financial institutions’ balance sheets in addition to quarterly balance sheets on the internet. It also issues a half-yearly Financial Stability Bulletin. These measures encourage private agents to exercise market discipline, generating a framework to channel a growing flow of data available to assess the development of domestic financial institutions and the financial system as a whole.
160
BIS Papers No 28
IV.
Is Financial Stability Policy Now Better Placed to Prevent Systemic Banking Crises?
The financial system is gradually overcoming the problems that stemmed from the crisis of 2001-2002. In this manner, although there are still some remnants of the crisis, a new map of the risks managed by the country’s financial institutions is emerging. In this context, the Central Bank is focusing its efforts on monitoring both the complete normalization of the banking system and the direction towards which the new developments in financial services are leading. In a macroeconomic framework where the current trends of growth with low levels of inflation are maintained, it is estimated that over the short run the financial system will continue to exhibit a position strengthened by a global assessment which bears in mind the principal inherent risks. The banking system also shows a growing level of resilience vis-à-vis possible negative shocks, which have a small probability of occurring. The combination of both elements leads to the belief that the progress in domestic financial activity will enable completion of the normalization plan in a context in which the principal conditions that make for financial stability will prevail. During the first half of 2005 the financial system managed to improve its overall balance of risks. In this regard, the principal change during the period was the reduction in the exposure to the public sector and the increased exposure to the private sector. This improved the risk profile of the banking system, due especially to the diversification of portfolios and the contraction of the mismatch in the maturities of assets and liabilities. On the other hand, the financial system also shows a relatively strong position as regards liquidity risk. The sustained recovery in the confidence of depositors, the high levels of liquid reserves and the deepening of money markets are signs of the good coverage that banks have vis-à-vis liquidity risk. In addition, and within a transparent regulatory framework, the Central Bank, by deepening the repo market and in its function as the lender of last resort, has induced a sharp reduction in the probability that an adverse individual liquidity shock will be transformed into a systemic problem. In the first half of 2005 financial institutions increased their soundness with regard to credit risk. Although the financial system still exhibits a significant exposure to the public sector, the conclusion of the debt restructuring program and the sustained fiscal discipline mean that the most probable scenario over the medium term will be the strengthening of the payment capacity of the public sector. Likewise, the improvement in the quality of the private portfolio, added to a prudent policy of provisioning, led the financial system to show a full coverage of the losses expected from nonperforming loans to the private sector. At the same time, the reduced levels of corporations’ and families’ debt and the low exposure of the banking system to these allow for the statement of a minimal probability of a negative credit shock and a limited impact on capital. In line with the above, during the first half of 2005 the banking system carried out a prudent policy in granting private credit. For example, the expansion of new private credit to companies with an adequate financial position reflects the increase in the exposure to credit risk on a sound basis. On the other hand, the financial system has achieved few advances in reducing its exposure to real interest rate risk. However, the possible scenario that includes increases in real interest rates beginning to have some impact on the solvency of the financial system has a very small probability of occurring. These developments in the financial system, and the probabilities assigned to each of these scenarios, are consistent with a scenario in which a positive macroeconomic performance is maintained. In this regard, both monetary discipline and the continuity of fiscal responsibility will be the key points that will define the total normalization and healthy expansion of financial activity. Financial institutions have been recovering their levels of profits at a sustained pace during the postcrisis period. In the first half of 2005, for the first time after the crisis, the banking system registered half-year profits. The continued progress in terms of results, added to the sustained process of capitalizations carried out by financial institutions, make up a framework of a sustained solvency margin, increasing resilience to negative shocks. For the next few months and years the most probable scenario in which the financial system may operate will boost the consolidation of the recovery of financial institutions, while promoting the necessary conditions for financial stability. However, the financial system should focus its efforts on the continued recovery of its portfolio of assets and in lessening the mismatch in real interest rates. Overcoming these challenges will contribute greatly to the strengthening of the financial system. For
BIS Papers No 28
161
this purpose, the Central Bank is promoting market mechanisms to support the financial institutions that overcome these weaknesses, by providing a realistic framework for the short and medium term. Within that framework, the policy implemented by the Central Bank includes minimum capital regulatory requirements for credit, market and interest rate risks (these regulations are, in certain cases, subject to phased compliance). In addition to credit risk requirements, financial entities must pay in capital on account of interest rate risk. Interest rate risk capital requirements are set so as to put a cap on the risk arising from the sensitiveness (“duration”) of assets vis-à-vis changes in the interest rate, when such sensitiveness is not in line with that of liabilities. On the other hand, minimum capital requirements are designed to cover the market risk of entities’ portfolios measured according to their risk value (VaR). The US dollar is included as a foreign currency for the purposes of complying with the market risk capital requirements by taking into account all US dollar denominated assets and liabilities. Finally, the prudential regulatory system provides that, in order to reduce entities’ credit risk exposure for changes in exchange rates (taking into account the currency mismatch that characterized the financial system in the 1990s and that caused several problems in the most recent financial crisis), their lending capacity arising from foreign currency denominated deposits shall be basically allocated to those sectors eligible to make reimbursements in foreign currency (manufacturers of goods subject to export). Lending capacity in excess causes an additional requirement of minimum cash in foreign currency. Thus, financial entities shall hold such a foreign exchange amount in cash or else deposit it with the BCRA. The implementation of all these policies and measures, in the above mentioned healthy framework of macroeconomic growth, give us confidence that the economy is now better placed to prevent and face a systemic banking crisis.
162
BIS Papers No 28
Improving the banking system: the Chilean experience1 Cristina Betancour, José De Gregorio, Alejandro Jara Central Bank of Chile
Abstract This paper presents some evidence on the current state of the banking system in Chile, with particular focus on the adjustments it must undergo to comply with the Basel II Capital Accord. We present some basic facts about the Chilean banking system and a brief international comparison. We consider separately local banks, the country’s publicly owned bank and foreign banks, and present the evolution of some basic indicators of performance. The evidence shows some important efficiency gains over time. We also examine issues like the changing procyclicality of banks’ lending and the changes in capital requirements which will result from the adoption of Basel II. The Chilean banking system is well prepared to implement Basel II, albeit in a gradual way.
I.
Introduction
The development of the banking system over the past few decades has played a major role in Chile’s macroeconomic performance. Similarly, the macro-financial stability that has characterized the economy during this period has enhanced the presence of banks as a source of financing, and has allowed an increasing diversification and flexibility in banks’ loans, especially in the retail sector. On the other hand, exposure to credit, liquidity and market risks has remained limited, and more recently banking regulation has moved gradually towards a modern approach to risk assessment, in line with Basel II. Until the mid-1980s, Chile was characterized by having a deep but poorly regulated financial system. It was not until the banking crisis of 1982-83 that some major financial reforms were introduced, building a sound financial regulatory framework that has remained at the core of the Chilean banking system up until now. Like other economies, during the 1990s Chile saw an important process of bank consolidation plus a steady incorporation of foreign banks. These two factors were crucial in improving operating efficiency and, with the sole exception of the Asian crisis aftermath, contributed to a process of increasing bancarization. During the last several years, competition among banks has increased, as the net interest margin has gradually narrowed and the higher willingness to lend has brought more financing alternatives to the retail market. Prudential regulation has also improved. Since Basel I was implemented in Chile, banking regulation has progressively adopted a modern risk-management approach. According to the road map designed jointly by the Superintendence of Banks and Financial Institutions (SBIF) and the Central Bank, the gradual implementation of Basel II is expected to reduce capital requirements in the short term. Although these results are sensitive both to risk-weighted parameters and to operational risk, capital adequacy ratios are expected to remain high. The purpose of this paper is to analyze some key features of the Chilean banking system during the past two decades. Section II describes the conditions under which the 1986 General Banking Law was established, starting from a brief description of the banking crisis of the early 1980s. Section III describes some characteristics and the evolution of the Chilean banking system during this period. It
1
This paper was prepared for the BIS meeting on “The Banking System in Emerging Economies: How Much Progress Has Been Made?” Basel, December 2005. We are thankful to Günther Held, José Miguel Matus and Sergio Rodríguez Elorza for their useful comments. The views expressed in this article are those of the authors and do not necessarily reflect the opinions of the Central Bank of Chile.
BIS Papers No 28
163
also addresses issues such as the presence of foreign banks, the role of the State and the more recent impact of monetary policy on the credit channel. Section IV deals explicitly with capital regulation and its implications for procyclicality. Section V concludes.
II.
General background
In the late 1970s, Chile went through some major trade and financial reforms. The banking system was liberalized, leading to the elimination of controls on credit and interest rates and to bank privatization. However, this process lacked prudential regulation, which, in conjunction with the fixed exchange rate regime in place at the time, led to a rapid increase in bank credit to the private sector, especially to the non-tradable goods sector. Therefore, although there was no currency mismatch in the banking system’s balance sheets, there was a mismatch in the sector banks were lending to (Cowan and De Gregorio, 2005), setting the stage for the country’s worst financial crisis since the Great Depression. During the late 1970s, domestic credit grew at an annual average rate of 40%, thus increasing banks’ proportion of GDP from 8% in 1975 to 35% in 1980. The lack of supervision and regulation of banks during this period became evident when they began to take excessive risks, as credit to related parties reached 19% of total loans in 1982. There was also a presumption that the government would bail out the banking sector - a bank had been saved in the late 1970s and there had been public statements by the authority on the need to avoid bank failures - which contributed to banks’ moral hazard problems and set the scene for the banking crisis that ensued. Actually, even though the deposit insurance system introduced in 1977 and 1981 was limited in scope, depositors behaved as if their deposits were fully guaranteed, searching for high returns without taking into account the risk involved. Therefore, banks increased their credit exposure and became extremely vulnerable to macroeconomic conditions. In fact, the external shock that hit in 1982, combined with the weaknesses of the Chilean banking system, along with the collapse of the fixed exchange rate regime, led to a deep currency and banking crisis. As a result, unemployment soared to almost 20% while GDP fell by 14% in 1982. Nonperforming loans also went up to 9% of total lending in 1985 and banks’ profits turned into losses of US$671 million. This led to a costly banking system intervention by the Central Bank, estimated at 2 about 35% of GDP. As a consequence of this crisis, from 1983 to mid-1986, the authorities established a fully guaranteed demand and time deposit insurance scheme in order to prevent a bank run. Therefore, it was not until late 1986 that the general process of recovery actually began, leading to a new banking regulation framework. The General Banking Act (GBA), introduced at the end of 1986, set the basics for resolving the fundamental problems that had caused the crisis of 1982: improving supervision and prudential regulation by restricting lending to related parties and limiting the State guarantee on 3 deposits. The GBA’s original basic framework is still in place, and is considered to be at the core of the current strength of the Chilean banking system. Additionally, the amended GBA of the 1990s upgraded the banking legal framework introducing capital adequacy requirements in line with Basel standards, and allowed banks to expand their activities and invest overseas, helping to consolidate and develop the banking system even further. Besides the banking system reforms described above, the evolution of the banking sector during the past 20 years has benefited from the developments in the Chilean capital market that have taken place since the late 1980s. Furthermore, the whole financial system has taken advantage of the Pension Funds Reform of the early 1980s and of the sound fiscal policy that has characterized this
2
For details on the Chilean banking crisis, see Velasco (1991), De la Cuadra and Valdés-Prieto (1992), Valdés-Prieto (1994), Matus (1995), Held and Jiménez (1999), Sanhueza (1999), Barandiarán and Hernández (1999), and Hernández and Parro (2004).
3
In the Chilean deposit insurance system, the Central Bank guarantees 100% of demand deposits in full, and 90% of household savings and time deposits up to UF 120 (approximately US$4,000). In this framework there is no permanent fund in place, therefore in order to limit the Central Bank’s exposure, banks with demand deposits in excess of 2.5 times their core capital are required to maintain 100% reserves at the Central Bank in short-term central bank and government securities.
164
BIS Papers No 28
period. All this has increased the supply of long-term funding, helping to expand the banking system and other financial institutions, such as the domestic stock market, financial intermediaries and 4 institutional investors (pension funds, mutual funds and insurance companies, among others). These developments have consolidated a solid financial system, making it comparable to those of other developing economies, as shown in table 1. In fact, as expressed by Moody’s, the strength of the Chilean banking system is rated at the top among emerging markets and at a similar level to many industrial countries. The fifth column of table 1 shows a financial strength index for a variety of 5 countries worldwide. Chile is ranked at a similar level to some industrialized countries, like Italy, and above others, like Germany.
Table 1 Financial Deepening Percentages Private credit/GDP
Stock market capitalization/ GDP
Argentina
12
62
6
10
0
Brazil
33
36
32
10
24
Chile
75
86
10
19
58
Mexico
18
18
21
3
42
Colombia
23
15
3
0
24
174
118
121
113
77
Italy
83
37
121
44
63
France
88
67
85
42
73
Germany
117
37
129
43
47
Spain
111
71
157
24
77
30
18
52
7
41
28
15
27
n/a
31
Japan
105
60
87
44
21
Korea
120
48
235
50
18
Malaysia
132
141
34
53
35
35
40
9
0
19
Turnover ratio
Private bonds/ Financial GDP strength index
Latin America
USA Europe
Czech Rep Poland Asia
Philippines Sources: World Bank, Moody’s.
6
When taking into account indicators of the financial sector’s size, like private credit as a percentage of GDP, Chile is ranked almost as high as some developed countries, such as France and Italy (75% vs.
4
For further details, see Cifuentes et al. (2002).
5
Based on Moody’s index of financial system strength, computed in May 2004, converted to an index from 0 to 100 by the IMF according to a numerical scale assigned to Moody’s average rating by country.
6
The data shown in table 1 have been updated with comparable data from the World Bank as of 2003.
BIS Papers No 28
165
88% and 83%, respectively), and well above other Latin American economies. Stock market capitalization as a percentage of GDP is also high in Chile, above Spain, France, Germany, Japan, and all the other Latin American countries. However, turnover ratios are still relatively low, which indicates that the market is not as liquid as could be expected given the degree of capitalization. The development of pension funds has also allowed Chilean firms to resort to domestic funding. Firms have been able to switch from foreign financing to internal and long-term loans. This has resulted in a healthier financial structure of Chilean corporations. As shown in figure 1, the Chilean corporate bond market grew from US$2.2 billion in 1995 to US$6.8 billion in 2002. Also, more recently, the low interest rates and low credit risk that have characterized financial markets around the world have forced institutional investors to reallocate their investment portfolios in search of higher yields. As a result, corporate bond stocks increased to US$10.1 billion in 2003, and to US$13.0 billion in October 2005.
Figure 1 Corporate Bonds Billions of US dollars 14.0 Flow Stock
12.0 10.0 8.0 6.0 4.0 2.0 0.0 1995
1996
1997
1998
1999
2000
2001
2002
2003
2004
Oct05
Source: Superintendence of Securities and Insurance.
Therefore, as has been shown, the Chilean financial system has reached a high degree of development during the last two decades.
III.
The Chilean banking sector: Where do we stand?
This section briefly addresses some of the important changes experienced by the Chilean banking system during the last two decades. We begin with a description of the current structure and the evolution of the banking sector and then examine the new risks faced by the financial system.
III.1
Structural changes and performance
The structure of the Chilean banking system has undergone deep changes in the past decades, characterized by significant entry of foreign banks and an increasing presence in retail credit. Currently, there are 26 banks established in Chile: 14 of them, one of which is state-owned, are
166
BIS Papers No 28
considered “domestic” and the other 12 are either branches of foreign banks or mainly controlled by 7 foreigners. Although the number of banks (both domestic and foreign) in Chile has decreased substantially since 1990, the market share of foreign banks has increased substantially in recent years (table 2), giving them a major role in the domestic and credit market. By the beginning of 2005, they accounted for almost 40% of total assets (equivalent to US$41 billion), compared with 16% in 1990, and 22% in the mid-1990s.
Table 2 Evolution of the Structure of the Chilean Financial System
Foreign banks Local private banks State-owned bank
Number 1990 2005 22 12 17 13 1 1
% total loans 1990 2005 15.2 39.0 66.5 47.7 18.2 13.2
% total deposits 1990 2005 16.3 39.4 64.1 44.2 19.6 16.3
Source: SBIF.
The consolidation process that took place mainly between 1995 and 2002 heightened the degree of bank concentration. Presently, the three largest banks in Chile account for approximately 54% of total loans, and 55% of total deposits. This process of consolidation, however, has followed a similar pattern 8 to that in other countries, and has not prevented higher bank penetration and global integration. Actually, the increasing role played by foreign banks in Chile has improved the efficiency and quality of financial risk management, laying the groundwork for enhanced competition through the introduction of technological innovations. Banks’ funding structure has also diversified, contributing to financial 9 stability. Tables 3 and 4 show some characteristics of the Chilean banking system for two different sample periods: 1990-99 and 2000-05. During this latter period, foreign banks became relatively more important in Chile. The two tables also classify each institution according to its ownership origin: private domestic, state-owned and foreign. As can be seen from table 3, interest rate margins have narrowed recently in all categories of banks, but profitability has remained high. The decrease in interest margins reflects not only higher competition, but also improved efficiency and lower credit risk. Efficiency has increased significantly while overhead costs as a percentage of net operational income has approached 50% in both private domestic and foreign banks. The asset composition of the banking sector has moved towards retail credit. Loans to households have increased substantially over the last five years, mainly due to the strong growth in mortgage loans. Foreign banks have been particularly aggressive in this development, as almost 30% of their total loans are now aimed at the household sector, including personal loans, credit cards and mortgage loans. In the search for higher returns, banks have eased lending conditions to the household sector. Higher flexibility in payment plans, longer loan maturities and the higher share of variable-interest-rate loans in the banks’ portfolios have facilitated the process of bancarization in the retail market. It is important to note that financial stability has not been jeopardized by this process, since economic conditions and expectations have improved during the last few years, and interest rates have reached historical lows.
7
All banks in Chile are subject to the same supervisory and regulatory norms.
8
See Karasulu (2005).
9
See Ahumada and Marshall (2001) for details on the Chilean banking industry’s consolidation experience and IADB (2005) for several hypotheses about the role played by foreign banks in Latin America.
BIS Papers No 28
167
Table 3 Performance of Foreign and Domestic Banks in Chile Domestic Private State-owned 1990-99 2000-05 1990-99 2000-05 Net interest margin (% of total assets) Overhead cost (% of total assets) Overhead cost (% of net operational income) Loan-loss provisions (% of total assets) ROA ROE
2000-05
3.9
4.6
3.3
4.1
3.7
3.2 55.2
2.6 52.8
3.2 62.3
2.9 65.8
3.0 62.0
2.6 51.5
0.9
1.1
1.0
0.6
0.7
0.9
1.8 25.5
1.3 17.6
0.6 10.2
0.5 9.4
0.9 7.6
1.6 16.7
12.2
% Consumer to total loans % Mortgage to total loans
1990-99
5.0
Capital adequacy ratio Asset structure % Loans to total assets % Household credit to total loans
Foreign
12.2
16.0
72.8 17.8
76.1 20.7
58.2 36.5
32.5 45.5
60.3 18.4
68.3 27.0
7.5 9.8
8.4 12.4
4.0 32.5
7.1 38.5
8.0 10.5
9.6 17.4
Source: SBIF.
On the liabilities side, time deposits remain the most important source of financing (more than 40% of total assets), and their relative importance has even increased in the past few years, as more resources are now being channeled from institutional investors (particularly mutual funds) to the banking industry in the form of deposits. However, the banking system has also adjusted its funding structure over the past few years. In particular, the recent record-low levels of interest rates have allowed banks to adapt their financial structure in favor of issuance of long-term banking debt instruments (table 4). Table 4 Foreign and Domestic Banks in Chile: Sources of Funds Percentage of total assets
Domestic Foreign Private State-owned 1990-99 2000-05 1990-99 2000-05 1990-99 2000-05 Short-term treasury funding (*) -5.9 -9.9 -32.7 -29.1 -14.4 -15.1 Time deposits 40.2 46 36.5 40.8 37.3 42.7 Demand deposits 9.1 10.9 17.6 16.4 8 9.8 Fixed-income securities 13.2 15.2 18.7 24.7 8.6 16.7 Others 15.4 14.9 11.1 8.4 19.1 15.9 (*) Includes net interbank funds, external lines less cash and securities. Source: Authors’ calculations using SBIF data.
Above all, the Chilean banking industry has remained sound and profitable compared to other countries (figure 2). Its capital adequacy ratio (CAR) averaged 13.5% between 2000 and 2004, and all banks maintained a CAR higher than 10%, a figure well above the required minimum of 8%. Profitability has also remained high and stable, with the only exception being the aftermath of the Asian crisis. The average return on equity (ROE) in this period was 15.6%, in spite of the decrease in net interest margins. In fact, net interest margin, the main source of bank profitability, declined from 4.4% to 3.2% of total assets between 1996 and 2005 (figure 3). However, this decrease was partially offset by lower provisions and higher operational efficiency, allowing profitability to remain high.
168
BIS Papers No 28
Figure 2 Capital Adequacy and Return on Equity Percentage, average 2000-04 15 MEX
14 CHI CO
13
PE
MAL USA
CAR
UK CAN
12
11 KOR
10
AUS ISR
9 0
5
10
15
20
ROE Source: National Authorities.
Figure 3 Monetary Policy Rate and Banks’ Interest Margin
1
Percentages, 12-month average at the end of each year 16 monetary policy rate 14
12
10
8 interest income *
interest expenses * 6
4 net interest margin * 2
0 1996
1997
1998
1999
2000
2001
2002
2003
2004
2005
1
Before August 2001, nominal equivalent monetary policy rate is estimated (see footnote 10). (*) Percentage of total assets. Sources: SBIF and Central Bank of Chile.
BIS Papers No 28
169
10
The nominal equivalent monetary policy rate has fallen steadily since 1996, allowing the banklending rate to drop significantly during this period. In fact, the average interest rate earned by banks’ assets decreased from almost 12% in 1996 to less than 6% in 2004. Although pass-through from the monetary policy rate and the banks’ market rates has not been full, the Chilean banking system exhibits high flexibility in its bank-lending rate compared to other countries (see Berstein and Fuentes, 2003). More recently, interest rates have started to increase as the Central Bank of Chile has begun to reduce the degree of its monetary policy expansion. However, the average interest rate has remained at a historical low, allowing bank loans to continue growing.
III.2
New forms of risk
As described above, the changes faced by banks, as well as the macroeconomic environment in which they have operated, have resulted in exposure to new and more complex forms of risk. Increased market volatility, contagion among financial markets, and increased competition among financial intermediaries are some of the factors that have contributed to these changes. This section briefly highlights some of the new forms of risk faced by banks and the financial regulation and infrastructure initiatives undertaken by the authorities in order to limit their incidence. Contagion through the payment system The payment system is an essential component of the economic and financial infrastructure, because it allows secure and prompt completion of transactions, a key condition for good economic performance. However, the payment system can also bring risks to its participants, and it can be transformed into a channel that spreads financial problems from one agent to the market at large. This possibility of transforming individual risk into systemic risk is related to the appropriate functioning of the payment system and constitutes a fundamental concern for central banks. Given that the volume of interbank operations in Chile has grown during the past several years, interbank payment risk exposure has also increased, adding new risks to the banking system. As a consequence, a series of initiatives to modernize the payment system have been adopted with a view to augmenting its efficiency and security. One of these initiatives was the implementation of real-time gross settlement and the Domestic Currency Large-Value Payments Clearing House (see Working Group on Payment Systems, 2003). Increased use of derivatives Derivatives allow banks to improve their management of market, credit, liquidity and operational risk. These instruments include a variety of financial contracts, such as forwards, futures, swaps, and 11 options. Although the use of derivative instruments is not new to the banking industry, their volume, complexity, and diversity have grown significantly in the past few years, adding new challenges to 12 adequate risk management. In this regard, banking supervisors have tightened control of bank operations with derivatives, and promote healthy practices such as: appropriate supervision, an integral process of risk management (sensible limitations, continuous measurement and information 13 procedures), and internal controls, as well as an adequate measure of the capital base. For that reason, in Chile, in order to ensure proper administration and control of market risk associated with the use of derivatives, sensitivity and volatility parameters used by banks must be authorized by the SBIF.
10
Before August 2001, the Chilean monetary policy rate was indexed to a price index (UF); we therefore added the inflation rate in order to compute its nominal equivalent and make it comparable to the monetary policy rate effective since then.
11
Other negotiable instruments, such as implicit options, also contain characteristics of derivatives.
12
In Chile, banks were authorized to sell options on currencies and interest rates in June of 2005, contributing to the development and enhancement of the Chilean capital market, and expanding the supply of currency and interest rate risk hedges.
13
The amendment to the Capital Accord of 1988 (Basel I) incorporates requirements for capital associated to market risks and sets out a methodology to measure the risk related to positions in options.
170
BIS Papers No 28
Risk transfers Recently, banking institutions have developed a growing number of mechanisms to transfer risk. Among others, the development of securitization and credit derivatives has favored the transfer of banks’ operational and credit risks to other agents. Also, the increasing use of variable interest rates in mortgage contracts has shifted interest rate risk to households, transforming it into a bank credit risk, as households’ payment ability decreases when interest rates increase. Consequently, banking supervisors have to be aware of the risks involved in each type of operation. In this regard, a new regulatory framework was approved in January 2005. The new regulations gave banks better means of identification, measurement, and control of interest rate and currency risks. This new framework incorporated international standards and recommendations, such as the 1996 amendment to Basel I, and the 2004 recommendations on the administration and supervision of interest rate risks incorporated in Pillar II of the New Capital Accord (Basel II). It also allows the quantification of risks associated with maintaining open positions on options, and limits the exposure of available capital once the charges associated with credit risks are deducted. Managing liquidity risk In Chile, banks have faced additional challenges regarding their liquidity risk management due to the differences in their asset composition, and the growing presence of institutional investors in their funding structure (see Jara and Winkler, 2005). As a result, new norms on liquidity risk management were introduced in 2004 to promote better management, measurement, and control of liquidity risk. According to this new regulation, and in line with international standards, financial institutions now have to adopt and implement a “liquidity management policy” aimed at ensuring proper payment of obligations, not only in normal conditions but also in exceptional circumstances.
IV.
Capital regulation: present and future
In the context of the new Basel II framework, two key issues are (i) whether implementing this new capital arrangement will result in less or more stringent capital requirements and (ii) the behavior of capital requirements across the business cycle. The first issue is relevant to evaluating the ability of the banking system to intermediate. The second is important because procyclicality of banking activities could make banks cut back on lending during recessions, amplifying the cycle. These and other issues related to the implementation of Basel II are examined in this section. Before proceeding, it is useful to look at the facts. The literature has emphasized the concern that financial systems are extremely procyclical. Since risk is defined in many countries by accruals rather than by forward-looking criteria, banks tend to behave procyclically, i.e. reducing lending during recessions, which makes credit markets very volatile. In fact, if loans are perceived as risky only when the loss is already realized, banks will only start to build up capital to buffer such loss when it is too late. Therefore, given that losses are exacerbated during recessions, it is more costly to buffer them than during booms, so bank lending contractions have the potential to worsen the cycle. Therefore, we should expect to find high procyclicality in the data. We measure procyclicality as the correlation coefficient between private credit and GDP (rho). As shown in figure 4, which includes developed and developing countries, most countries are concentrated in rho values from -0.5 to 1. However, most countries show a positive correlation. In fact, Latin American countries’ correlations vary from -0.4 (Argentina) to 0.5 – 0.6 (Paraguay and Venezuela) and 0.8 (Chile). Figure 4 plots the correlation coefficient against GDP growth, from 1990 to 2004, using annual data. As shown in the figure, there is no relationship between the procyclicality of the banking system and GDP growth. As we argue below, because the banking system is more vulnerable during recessions, credit may, for prudential reasons, contract, while from a stability standpoint an expansion of credit would be desirable. This tradeoff is what could explain the lack of clear relationships between procyclicality and growth. Further explorations of the possible patterns followed by procyclicality are depicted in figures 5 to 7.
BIS Papers No 28
171
Figure 4
.08
Procyclicality and Growth
INDO IRE MAL SIN
Gdp growth 1990-2004 Gdp growth 1990 04 .02 .04 .06
CAMB BUR IND
KOR KUW
CHI BELZ BTW THA IR AN SRI CoR SAL EGY CY P TUR ISR HK
BAN TUN DOR GHA PER POL
NIG ARG
NEP
BOL PHI NIC MOR HON NOR POKEN RBELG
BRA DEN
URU SWE
AUSTRIA
HUN
0
ZIM
GUA CZESEN ECU COL GRE FIN ICE VEN PAR
CRO CAM
-1
- .5
0 .5 Rho (pr cred-gdp) 1990-04 Rho (pr cred-gdp) 1990-2004
1
Source: Authors’ calculations using IMF data.
Figure 5 plots bank strength and the correlation coefficient, rho, showing that there is no correlation between these variables. Stronger banking systems are neither more nor less procyclical than weak banking systems. We explored other evidence as well, which is not documented here, and obtained the same results with regard to lack of correlation between procyclicality of lending and variables like inflation, GDP volatility and others. 14
Figure 6, in contrast, plots the relationship between procyclicality and credit market depth for the same period (1990–2004), using annual data. It shows a positive correlation, i.e., procyclicality increases with deepness. Indeed, the banking systems in the most advanced countries, such as Hong Kong, Japan, the UK and Switzerland, are deeper, but also more procyclical. Interesting results are obtained for Latin American countries, which have less developed financial systems. According to the data in the graph, these countries should be less procyclical and, in fact, some of them even show negative indicators for procyclicality, like Argentina and Peru. However, other LA countries are highly procyclical, even if their banking systems are less developed. Examples of the latter are Colombia, Mexico, Paraguay and Guatemala. In these cases the banking system is neither a significant contributor to financing, nor to financial stability. Chile, in turn, is comparable to the US, showing high procyclicality (as do Switzerland and Hong Kong), though not as deep.
14
Deepening is defined as private credit as a percentage of GDP.
172
BIS Papers No 28
Figure 5 14
Procyclicality and Bank Strength
12
ARG
BOL
URU
INDO
Bank strength 8 10
BUL BRA IND
PER POL
HK
PHI KOR TUR CRO MEX
THA VEN EGY COL JAP MAL CYP CZEGRE
ISR
6
SA POR
ITA
AUST NOR
NZ
UK
4 -1
-.5
GER CHI IRE ICE AUSTRIA USA FRA
SWI FIN NETH SIN
SWE BELG
HUN
DEN CAN
SPA
0 .5 Rho (pr cred-gdp) 1990-2004
1
Sources: Authors’ calculations using IMF data; Moody’s (Dec 2004).
Figure 6 Procyclicality and Deepness of the Banking System 150
SWI HK
UK
Priv cred/GDP 1990-2004 50 100
CHINA JAP NZ
AUSTISR KOR SA
THA ICE
DEN
POL PER
0
NIG
-1
BIS Papers No 28
CYPSIN MAL
-.5
BUL ARG
CAN NORSWE CHIUSA TUN CRO CZE KUW MORBOL EGY BELZ URU PHI HUN HON INDO BRA IND IRAN SRI CoR KEN BAN DOR NIC PAR SEN COLGUA MEX TUR BUR CAM VENBTW CAMB SAL
0 Rho (pr cred-gdp) 1990-2004
.5
1
173
Source: Authors’ calculations using IMF data. 15
Figure 7 plots the volatility of lending relative to that of GDP against the correlation coefficient between lending and GDP. As shown in the figure, correlation between both variables is slightly positive and mainly driven by countries such as Guatemala and Paraguay. In principle, one could think that it is precisely procyclicality which adds volatility to output, although this is not strongly supported by the simple evidence shown here. Moreover, a more comprehensive analysis should consider the procyclicality of all available forms of financing. Figure 7
15
Volatility and Procyclicality in the Credit Market
BOL BELG BAN
Credit vol/gdp vol 1990-2004 5 10
PAR
GUA
SWE PHI MEX
0
ECU COL TUR EGY IRE BTW VEN URU CoR HON KEN ITA ICE SEN BUR NOR CAM NEP SAL USA SPA FRA GRE ISR DOR KUW TUN UK THA CHI HUN HK INDSA CHINA AUSTRIA MOR JAPSWI AUST POR INDO CAN IRANMAL CYP FIN SIN NETH BELZ NZ KOR GER
-.5
0 .5 Rho (pr cred-gdp) 1990-2004
1
Source: Authors’ calculations using IMF data.
Although the correlations presented here suggest, in particular, that procyclicality is unrelated to economic growth and that it would tend to be higher in countries with deep banking systems, a more definite assessment would require a more detailed econometric analysis. The following sub-sections show the impact of Basel II on procyclicality and point out some interesting issues to consider when implementing the new framework in Latin American countries.
IV.1
Expected impact of Basel II
The Basel II framework promises key advances in risk management and banking supervision around the world. It represents a substantial improvement on the existing Accord, but it is much more than just a new formula for calculating regulatory capital. It provides a comprehensive structure for dealing with risk management and banking supervision, and seeks to attain best standards and practices. In the coming years, Basel II will become a global standard. It will be adopted by a great majority of countries: 88 out of 107 non G-10 countries have already expressed their intention to implement the framework. This high level of acceptance is common to all regions of the world.
15
Volatility is measured as the standard deviation of the growth rate of the variable and the period in question.
174
BIS Papers No 28
The new framework requires fulfillment of certain prerequisites concerning the existing quality of regulation, supervision, and risk management. Prior to implementation, it will be necessary to establish an accurate diagnosis of the main issues already mentioned. In any case, a number of aspects must be examined, such as: the legal and regulatory framework; the supervisory system (risk-based vs. rules-based supervision); financial infrastructure (accounting and auditing rules); corporate governance in the banking industry; financial disclosure and market discipline. The New Accord seems to have positive effects for financial stability, thus buffering the cycle and diminishing the procyclicality shown in the section above. We estimate the potential effects that a Basel II type of approach would have on the Chilean banking system, and compare it with the current requirements of Basel I. We focus on two corrections of Basel II with respect to Basel I. First, we correct by the new weights of mortgages and, second, we weight corporate debt by risk classification. Specifically, we estimate the capital adequacy index under Basel II, and compare it with the index under Basel I for the 1996-2005 period. We use disaggregated information on rating agencies’ rankings (as a proxy for the banks’ internal 16 ratings that will be used for the IRB approach ) to convert them into a probability of default (PD), 17,18 The PDs are mapped into using a fixed correspondence following Kashyap and Stein (2004). capital charges using the Basel Committee’s formula. Then we use the same companies’ level of debt with the banking system. Under this exercise, a corporate borrower may have a lower capital requirement than the current minimum of 8% if rated above BBB. If the corporate loan is not rated it will continue to maintain the minimum 8% charge. Figure 8 shows that capital adequacy ratios would be higher under Basel II, thus reducing capital requirements. In addition, the correlation between capital adequacy ratios and GDP declines from -0.51 under Basel I to -0.60 under Basel II, supporting the thesis that improving risk management and bank supervision should diminish procyclicality of lending. In any case, as argued by Held et al. (2004), although Basel II could reduce minimum capital requirements, these results depend on the assumptions and weights used. However, when using assumptions and weights closer to the Chilean market experience, capital gaps tend to narrow. In addition, we do not incorporate operational risk into 19 our calculations, which would reduce the procyclicality of capital requirements as operational risk declines in periods of low economic activity. In any case, since Chilean banks hold high levels of 20 capital, the impact of Basel II is not significant. One important issue arises regarding the risk classification of corporations: there is a clear disincentive for a corporate borrower to be rated if the rating is likely to be a poor one. This potential bias toward good ratings is more significant in Latin America, because the rating business is less developed, so it is not currently available for every firm. Ratings are usually associated to firms that issue public debt, typically corporations that are stronger financially. This bias, plus the fact that the majority of banks’ portfolios are currently unrated, implies that this approach does little to link bank capital to risk. The standardized approach also includes (not considered in the exercise above, except for mortgages) a set of specific changes in the Capital Accord that affects, in particular, the capital requirements on mortgages, retail exposure, lending to the sovereign in local and foreign currency, and lending to other financial institutions. Since it introduces lower charges on the first three (mortgages, retail exposure and sovereign), we would observe a larger reduction in capital requirements than the one presented here.
16
Although the most relevant options for developing countries are the standardized approach and the simplified standardized approach, we use the IRB, which is supposed to show higher reductions in capital requirements, so we are overestimating the effect of Basel II on capital.
17
The mapping is as follows: AAA corresponds to a PD of 0.01%; AA to 0.03%; A to 0.07%; BBB to 0.23%; BB to 1.07% and B to 4.82%.
18
We use standard mapping because of lack of data. Nevertheless, probabilities of default should be underestimated with this exercise.
19
The introduction of a specific capital charge for operational risk is made under Basel II. This will be an add-on to capital required for credit risk.
20
Only one bank reduces the capital adequacy index marginally below 10% when extreme conditions are assumed.
BIS Papers No 28
175
Under Basel II, the risk weight for mortgage loans is reduced. Lending to the banks’ own sovereign in domestic currency is free of charge, but lending in foreign currency requires weighting the loan according to the sovereign rating. Lending to other banks may increase capital requirements significantly, which allows a 20% risk weight charge if the loan term is shorter than six months. Figure 8 Capital Adequacy Indexes 16%
15%
14%
13%
12%
11%
10% Dec-96 Jun-97 Dec-97 Jun-98 Dec-98 Jun-99 Dec-99 Jun-00 Dec-00 Jun-01 Dec-01 Jun-02 Dec-02 Jun-03 Dec-03 Jun-04 Dec-04 Jun-05
CAI Basel I
CAI Basel II
Source: Authors’ calculations using SBIF data.
Some critics have argued that a cut in capital requirements may end up increasing vulnerability, hindering the recovery of defaulted credit. This criticism may have some relevance in the case of Chile. According to the World Bank (2004) Chile is weak in the recovery rate on business closures, with only 19 cents recovered for each dollar lost. The top 30 countries in the World Bank’s ranking all have recovery rates above 50 cents on the dollar. This illustrates Chile’s ineffective bankruptcy procedures. Moreover, the legal formalities related to doing business are relatively slow. Retail credit is highly concentrated and, therefore, there is a potential systemic risk that is not considered for capital requirements. The key for estimating the impact of Basel II has to do with the empirical effects of these potential risks. If we consider that the capital charge due to operational risk will reduce adequacy ratios, for most banks this should offset the effects of raising capital requirements due to the kinds of credit risk just illustrated: low recovery rates on business closures and concentration. In addition, as we argued above, it is unlikely that Basel II will affect capital requirements materially. The latter issue is reinforced by international evidence for Latin America, such as Powell et al. (2004) and IADB (2005), which has shown a limited impact of Basel II implementation in the region. In Chile, for example, the QIS 3 exercise performed by the SBIF and documented in Held et al. (2004) yields that banks will reduce their capital requirement by approximately 3 percentage points (see table 5). These computations include operational risk. Only foreign banks will increase their capital requirement due to the higher impact of operational risk. In other Latin American countries (e.g., Brazil), the capital requirement will also decrease (0.9%). Only in Peru and Colombia will the capital requirement increase, although by a small percentage.
176
BIS Papers No 28
Table 5 Impact of the New Capital Accord
RLM
Credit risk impact (%)
Operational risk Global impact impact (%) (%)
Established banks in Chile
7
-13.4
10.2
-3.2
Foreign banks’ branches
-
-11.6
12.6
1.0
Total banking system
7
-13.3
10.3
-2.9
Source: Held et al. (2004).
Therefore, going from Basel I to Basel II will require no big increase in capital, and the rise in the cost of capital due to a higher capital requirement will be limited. As shown in Powell et al. (2004), the spread may only experience a significant increase in Ecuador and Venezuela.
IV.2
Difficulties in implementing Basel II
Some problems that developing countries will encounter when implementing Basel II include: credit risk underestimation, overvaluation of credit risk mitigants (guarantees and collateral), underprovisioning, absence of capital charges for market risks, underestimation of capital requirements, accounting rules not aligned with international standards and lack of consolidated supervision. As suggested by White (2006), a heightened degree of cooperation between all agencies of government - and even private ones - would help to build a common culture, which would facilitate the solution of the problems mentioned above. Asset risk varies over the business cycle. Risk assessment, whether based on credit rating agencies’ rankings or internal ratios, reflects this procyclicality, possibly more so in the case of internal ratings, which typically do not attempt to assess risk “through the cycle”. This procyclicality in ratings will create a similar procyclicality in capital charges, with the implication that banks hold less capital at the 21 peak of the cycle - exactly when the danger of systemic crises is largest - while they will hold too much capital or under-lend during the downturn when macroeconomic stabilization calls for an expansion of credit. Consequently, regulation not only renders bank crises more likely to occur but could also destabilize the whole economy by exaggerating fluctuations. This is why countercyclical macroeconomic policies are needed. However, Latin America’s capital markets remain underdeveloped, imposing an important restriction on the full implementation of Basel II: greater penetration of rating agencies and provision of adequate information are needed to strengthen regulation, which is also needed to allow the full implementation of the New Accord. There is not only a shortage of rating agencies in Latin America, covering a small percentage of banks’ total loans (table 6), but also a lack of regulation. Furthermore, the quality of rating agencies’ credit risk estimates is uncertain.
21
Because of the credit expansion during booms.
BIS Papers No 28
177
Table 6 Rating Agencies
Country
Number of agencies
Percentage of total loans granted to rated firms
Argentina
4
24.4
Bolivia
2
Non-significant
Brazil
5
18.0
Chile
4
18.0
Paraguay
0
-
Peru
4
Non-significant
Uruguay
3
Non-significant
Source: Central Bank of Chile.
In any case, the costs of implementing Basel II may be low, due to the active presence of foreign banking in a relatively concentrated system.
V.
Concluding remarks
The Chilean economy has gone through a process of financial development with a sound banking system during the past two decades. By most international as well as historical comparisons, the banking sector’s performance has been good. In the context of banking consolidation, as has occurred in many other countries, interest rate margins have declined and efficiency has improved. This has happened for all local and foreign banks and for the country’s state-owned bank. Only foreign banks have increased returns in recent years, although the evidence shows that this is due to a reduction in costs. Overall, the greater participation of foreign banks has brought efficiency gains. However, we should also mention the contribution of the one state-owned bank, whose performance is comparable to that of the rest of the banking system, but which has also acted as a promoter of competition. This has been particularly important in the household sector and with small and medium-sized enterprises. Perhaps the only important concern banks are facing today has to do with the greater exposure coming from the household sector. The banking system has also shown a response to monetary policy in line with the behavior observed in industrialized countries. We have shown that when computing simple correlations between bank lending and output, the figure obtained for Chile appears to be relatively large. This would indicate high procyclicality. Although volatility is moderate, the evidence on procyclicality could indicate that the banking system could extend the amplitude of the business cycle. However, there are two caveats to this conclusion: first, these are simple correlations and more statistical analysis would be required to check the robustness of this finding; second, and more important, bank lending is not the only source of funding for the corporate sector. As we have shown, there has been an important development in the bond market in Chile, which could offset - or explain - the relative contraction in credit during the downturn. More research needs to be done to evaluate the implications of the behavior of the financial system for the business cycle. One of the main criticisms of Basel II is that its application could exacerbate procyclicality, which in turn might deepen volatility of output, in particular in developing economies. However, we have shown
178
BIS Papers No 28
that the implementation of the New Accord should diminish capital requirements and procyclicality should be reduced. Additionally, operational risks should stabilize capital requirements via their countercyclical effect. Measuring operational risk is always complex, especially in developing countries, thus giving another reason for careful analysis. In the case of Chile, we presented evidence that the banking system has tended to hold more capital than required, which should reduce the impact of the changes in the index of capital adequacy over the cycle. We have argued that the Chilean banking system is on solid ground to follow a gradual implementation of Basel II. From a stability point of view, one might prefer banks to expand lending during recessions. But this could be achieved only at the cost of increasing financial vulnerability. Indeed, regulation should be forward-looking, but downturns generally bring bad news about the future; hence, it is reasonable to expect more cautious behavior and tighter regulation during downturns. At a deeper level, it is not the banking system that is in charge of stabilizing the economy. Indeed, what is required is a set of sound fiscal and monetary policies. In Chile, the fiscal rule based on a stable cyclically adjusted fiscal balance, together with an independent central bank with the goal of maintaining price stability, which it implements through an inflation target and a flexible exchange rate, have proved to be a good cushion for the business cycle.
References Ahumada, A. and J. Marshall (2001), “The Banking Industry in Chile: Competition, Consolidation and Systemic Stability.” BIS Papers N° 4. Barandiarán, E. and L. Hernández (1999), “Origins and Resolution of a Banking Crisis: Chile 1982-86.” Working Paper N° 57, Central Bank of Chile. Berstein, S. and J.R. Fuentes (2003), “Is There Lending Rate Stickiness in the Chilean Banking Industry?” Working Paper N° 218, Central Bank of Chile. Cifuentes, R., J. Desormeaux and C. González (2002), “Capital Markets in Chile: From Financial Repression to Financial Deepening.” Economic Policy Paper N° 4, Central Bank of Chile. Cowan, K. and J. De Gregorio (2005), “International Borrowing, Capital Controls and the Exchange Rate: Lessons From Chile.” Working Paper N° 322, Central Bank of Chile. De la Cuadra, S. and S. Valdés-Prieto (1992), “Myths and Facts about Financial Liberalization in Chile: 1974-1983.” In P. Brock (ed.), If Texas were Chile, San Francisco, CA: ICPS. Held, G. and L.F. Jiménez (1999), “Liberalización financiera, crisis y reforma del sistema bancario chileno: 1974-1999.” ECLAC. Held, G., L.R. Romero and D. Weinstein (2004), “Ejercicios de aplicación de la propuesta del Nuevo Acuerdo de Capital de Basilea al Sistema Bancario Chileno.” Superintendence of Banks and Financial Institutions, Chile. Hernández, L. and F. Parro (2004), “Sistema financiero y crecimiento económico en Chile.” Working Paper Nº 291, Central Bank of Chile. IADB (2005), “Unlocking Credit: The Quest http://www.iadb.org/res/ipes/2005/index.cfm.
for
Deep
and
Stable
Bank
Lending.”
At
IMF (2005), “Global Financial Stability Report.” September. Jara, A. and N. Winkler (2005), “Liquidity Risk and Bank Funding in Chile.” Article published in the Financial Stability Report, Central Bank of Chile, December. Karasulu, M. (2005), “Competition in the Chilean Banking Market.” In Chile: Selected Issues, IMF Country Report N° 05/316, September. Kashyap, A.K. and J. Stein (2004), “Cyclical Implications of the Basel-II Capital Standards.” Economic Perspectives, vol. 28. Matus, J.M. (1995), “Liquidación y Saneamiento del Sistema Financiero Chileno a raíz de la Crisis Económica de 1982.” Monetaria, April-June 1995, Centro de Estudios Monetarios Latinoamericanos (CEMLA).
BIS Papers No 28
179
Powell A., V. Balzarotti and C. Castro (2004), “Reforming Capital Requirements in Emerging Countries: Calibrating Basel II Using Historical Argentine Credit Bureau and Credit Risk.” Documento de Trabajo 07, Centro de Investigación en Finanzas, Universidad Torcuato Di Tella. Sanhueza, G. (1999), “La crisis financiera de los años 80 en Chile: Análisis de sus soluciones y su costo.” Economía Chilena, volumen 2 Nº 1, Central Bank of Chile. Valdés-Prieto, S. (1994), “Financial Liberalization and the Capital Account: Chile, 1974-84.” In Financial Reform: Theory and Experience, by Caprio, Gerard JR; Izak Atiyas and James Hanson (editors), Cambridge University Press. Velasco, A. (1991), “Liberalization, Crisis and Intervention: The Chilean Financial System 1975-1985.” In V. Surandararajan and T. Baliño (eds.), Banking Crisis: Causes and Issues, Washington DC: IMF. White, W. (2006), “Procyclicality in the Financial System: Do We Need a New Macrofinancial Stabilization Framework?” BIS Working Papers Nº 193. Working Group on Payment Systems (2003), “Modernization of the Payment System.” Economic Policy Paper N° 6, Central Bank of Chile. World Bank (2004), Doing Business 2005: Understanding Regulation. Washington DC: World Bank, International Finance Corporation and Oxford University Press.
180
BIS Papers No 28
The Lessons Learnt from the Development and Reform of China’s Banking Sector Liu Shiyu, Wu Yi and Liu Zhengming
I.
Review of Historical Developments
The reform of China’s banking sector was carried out against the background of the country’s transition from a planned economy to a market economy. Prior to the reform and the opening up of China to the rest of the world, the country’s banking system consisted of only one financial institution, the People’s Bank of China (PBC). It was not until 1984, when the Industrial and Commercial Bank of China (ICBC) was separated out from the PBC, that China became a dual banking system with the PBC acting as the central bank and ICBC, China Construction Bank (CCB), Bank of China (BOC) and Agricultural Bank of China (ABC) as the specialized banks. At that time even though these specialized banks were given some discretion over business operations, within the framework of the planned economy they had limited power in extending credits. In 1993, the overall reform direction toward a socialist market economy was established. The specialized commercial banks were required to transform into real commercial banks. At the same time three policy banks (State Development Bank, Import and Export Bank of China, and Agricultural Development Bank of China) were set up in order to separate policy financing and commercial financing. In 1995, the Law of the People’s Republic of China on Commercial Banks was enacted, establishing the specialized banks as state-owned commercial banks and stipulating that the business operations of these banks were to be governed by the principles of efficiency, safety and liquidity, and that they were to make their own decisions regarding business operations, take responsibility for their own risks, assume sole responsibility for their profits and losses, and exercise self-restriction. At the early stage of reform, however, the whole economy was in transition and government intervention continued to constrain the commercial banks’ discretion with regard to business operations. Although China did not suffer as much as its neighbors from the Asian financial crisis in 1997, in the years that followed the government began to place great emphasis on financial stability and took measures to effectively dissolve financial risks and put the financial sector in order. These measures included strengthening financial oversight and performance, reviewing key financial enterprises, 1 issuing 270 billion yuan of special bonds to increase the state banks’ capital, setting up asset management companies to dispose of non-performing loans (NPLs), closing a number of insolvent or poorly functioning financial institutions, and strengthening financial supervision in terms of prudential accounting, a loan classification system and disclosure requirements. In order to mitigate financial risks, the China Securities Regulatory Commission (CSRC) and the China Insurance Regulatory Commission (CIRC) were set up, taking over the supervisory responsibilities for the securities and insurance sectors but leaving the supervision of the banking sector with the PBC. The Third Plenary Session of the 16th Meeting of the CPC Central Committee decided to turn China’s commercial banks into safe and profitable modern financial enterprises with adequate capital, sound internal control and good services. This clarified the requirements for and the direction of the reform of state-owned banks. The Party Central Committee and State Council decided to start share-holding reforms with BOC and CCB on a trial basis by injecting USD 45 billion of capital into the two banks on December 30, 2003. In 2005, the reform was extended to ICBC with USD 15 billion being injected. A full-fledged reform program, including financial restructuring and improved corporate governance, was launched at these banks after recapitalization. Another significant reform implemented in 2003 was the creation of the China Banking Regulatory Commission (CBRC) to take over responsibility for supervising banks, asset management companies, trust and investment companies, and other depository institutions. At that time, the supervisory framework of parallel supervision for separate
1
The yuan is the unit of the account for the Chinese currency, the renminbi (RMB).
BIS Papers No 28
181
financial industries was established with the release of the Banking Supervision Law, the revised Law of the People’s Republic of China on the People’s Bank of China and the revised Law of the People’s Republic of China on Commercial Banks. Significant progress has been made in building a sound banking system over the years of reform and opening. By the end of 2004, there were four state-owned commercial banks, three policy banks, 12 share-holding commercial banks, 112 city commercial banks, 681 urban credit cooperatives (UCCs), 32,854 rural credit cooperatives (RCCs), eight rural cooperative banks, seven rural commercial banks, 211 foreign financial institutions, 220 foreign bank representative offices, four asset management companies, 59 trust and investment companies, 74 finance companies, 12 financial leasing companies, three auto financing companies and a large number of post office savings institutions all over the country. The total amount of financial assets of both Chinese and foreign financial institutions amounted to 31.02 trillion yuan. China’s banking system remains sound, with total assets, deposits and loans growing steadily, profitability improving and risk control ability strengthened. The banking sector continues to play an important role in resource allocation, channeling savings to investments.
II.
The Reform of the Banking Sector
1.
Toward commercialization: the share-holding reform of the state commercial banks
After the Asian financial crisis in 1997, the Chinese government made strategic plans to push forward comprehensive reform of the state-owned commercial banks. The measures taken included issuing special bonds to increase the state banks’ capital, disposing of NPLs, and promulgating prudential accounting principles and a loan classification system. The state banks also actively engaged in operational mechanism reform, and in improving lending procedures and risk control. The reforms helped the banks to increase capital adequacy ratios, strengthen internal controls and raise profitability. In September 2003, the State Council decided to start the share-holding reform of the state commercial banks through financial restructuring, internal management reform, operational mechanism transformation and strict supervision, turning the banks into competitive, profitable and modern commercial banks with sound corporate governance, strict internal control, and adequate capital. The reform followed the principle of setting up clear ownership structures, clarifying rights and obligations, avoiding government intervention in enterprise operation, and applying scientific The pilot share-holding reform of the state commercial banks was carried out based on both the lessons learned from domestic economic and financial reform and international experiences. The reform proceeded in phases, i.e. financial restructuring, disposing of NPLs, setting up the shareholding company and listing on the stock market. The “one bank one policy” rule was applied. On December 16, 2003, with the approval of the State Council, Central Huijin Investment Co., Ltd. (CHIC) was established. CHIC acts as the state’s representative in state bank financial restructuring and in providing financing, resolving the long-lasting problem of lack of a concrete representative for state ownership. Related reform policies regarding taxation, wages, social security, state land administration, personnel, business registration, and financial supervision were also put into place. Thanks to the scientific design of the reform plan, clear objectives for each stage, and the active cooperation of related government agencies, the reforms have achieved the intended results. On December 30, 2003, CHIC injected USD 22.5 billion into BOC and CCB respectively, and later, USD 15 billion into ICBC. In disposing of their NPLs, the banks wrote off the bad assets and auctioned the NPLs to achieve a higher recovery rate. After financial restructuring and disposal of NPLs, the capital adequacy ratios of BOC and CCB reached 8.26% and 11.95%; their NPL ratios declined to 5.12% and 3.70%; profit before provisioning reached 58.5 billion yuan and 60.8 billion yuan respectively; and loan provisioning stood at 78.3 billion yuan and 58.3 billion yuan respectively. The ability of these banks to mitigate risks has thus been improved significantly. In establishing share-holding companies, BOC and CCB also underwent institutional restructuring and put into place corporate governance and internal control guidelines. BOC established its share-holding company on August 26, 2004 and CCB on September 21, 2004. The share-holders’ meetings, boards,
182
BIS Papers No 28
supervisory boards and new management teams of the two banks are now in operation. The boards and supervisory boards have taken on the responsibility of reviewing important issues and the management teams have made maximizing share-holder value the operating objective. The two banks are working to improve internal control, risk management, institutional streamlining, operational procedures and personnel management. At the same time, they are actively seeking cooperation with foreign strategic investors and have entered into cooperation agreements with Bank of America, Temasek, Royal Bank of Scotland, UBS, and ADB. ICBC’s capital adequacy ratio, asset quality, risk provisioning and profitability have witnessed drastic improvements after capital injection and NPL disposal. In taking on the rights and responsibilities of the state share-holder, the Ministry of Finance and CHIC have begun to play a concrete role in corporate governance reform. ICBC became a share-holding company in October 2005. Positive results have also been seen in ABC’s endeavor to improve operation, deepen internal reform, and strengthen risk control, laying a solid foundation for share-holding reform in the future.
2.
Strengthening of the local banks: RCCs, UCCs and city commercial banks
RCCs were among the early financial institutions established after the People’s Republic of China came into being. Before 1996, ABC oversaw the operation of RCCs. In 1996, the PBC took over this responsibility and invested a lot of resources in revitalizing and supervising these institutions. At the beginning of 2003, the supervision of RCCs was taken over by the CBRC. According to the Plan for Deepening RCC Reform on a Trial Basis, released by the State Council on June 27, 2003, reform trials were launched in Jilin, Shandong, Jiangxi, Zhejiang, Jiangsu, Shanxi, Guizhou and Chongqing. The reform followed the principles of clarifying ownership, strengthening discipline, and enhancing service functions. While the local government took the lead and full responsibility for the reforms, the central government provided valuable support in terms of fiscal transfers, taxation policy and funding in the pilot projects. So far, the reform has yielded noticeable results. The resilience and funding of these institutions has strengthened as their capital adequacy ratio and financial performance have improved significantly, and historical burdens have been partially shed. Reforms in ownership, organization, operational system and especially internal control were also carried out. By August 2004 the reform had been extended to 21 municipalities and provinces including Beijing, Tianjin and Hebei. At present, the reform is proceeding smoothly as the performance and services of the RCCs continue to improve. In 1998 the supervisory authorities started the reform of the UCCs. Reforms included changing the UCCs in the rural counties into RCCs, consolidating and restructuring some UCCs into single legalperson institutions, allowing commercial banks to acquire UCCs, transforming some UCCs into city commercial banks and closing those with high risks. After six years of consolidation and rectification, the number of UCCs had decreased from 3,290 in 1998 to 681 in 2004. The city commercial banks have a number of comparative advantages, such as having many outlets, and enjoy a high degree of flexibility in their operations. These banks are taking comprehensive measures to improve competitiveness, such as improving corporate governance, introducing foreign strategic investors, enhancing disclosure, and strengthening internal control. In order to reduce the risks facing the city commercial banks, the municipal governments have replaced their NPLs with good-quality assets. As a result, most city commercial banks have raised capital adequacy ratios and liquidity ratios to the levels required by the supervisory authorities.
3.
Continued expansion by foreign banks
The business scope and geographical coverage of foreign banks continue to expand. In order to allow them to further expand their scope and to give domestic enterprises greater access to financing, the banks were allowed to do RMB business in 13 cities in 2003, and this number was increased to 18 in 2004. The foreign banks were also allowed to provide RMB services to Chinese enterprises in the above regions. Cooperation between foreign and domestic banks has witnessed great progress in areas such as financing, settlements, commercial paper discounting, government bond investment, derivatives, syndicated loans, credit card business, trade finance, and so on. Several foreign financial institutions
BIS Papers No 28
183
have also invested in Chinese commercial banks, bringing encouraging changes in board operation, risk management, market development and business operations to the latter and gaining market share and customers for themselves.
III.
Risks Facing the Banking Sector
At this stage, Chinese banks face credit risk, market risk, operational risk and liquidity risk and are vigilant in improving their risk control capacity.
1.
Credit risk
Credit risk arising from NPLs and loan concentration is the major risk to the banking sector. There are several problems that require further action. First, the share of indirect (bank) financing is too high and concentrates credit risks in the banking sector. Measures have been taken to increase direct financing by developing the equity and bond markets. Second, the financing relations between the banks and enterprises need to be further improved. As the major bank customers, if enterprises could improve profitability, debt repayment capacity, asset quality and credibility and reduce defaults after reforms, they could help the banks to lower their NPL ratios. Third, the accounting system and taxation policy need to be improved to reflect the fact that the banks need to take enough provisioning to write off NPLs in order to mitigate risks. Fourth, markets where NPLs can be disposed of and risk products can be traded have yet to be established. These markets are essential for banks to identify, price and transfer risks, and to dispose of NPLs accumulated in the past. Fifth, the intermediaries, such as accounting firms, law firms, assessment agencies, rating agencies and credit reporting agencies, have yet to play the role they should have in providing professional services. More efforts should be made in fostering the development of these intermediaries.
2.
Market risk
As China is undergoing interest rate reform, the risks faced by the banking system require special attention. Significant progress has been made in interest rate reform since 2004. The lending rate ceiling and deposit rate floor have been removed and the bands for floating rates widened. However, reform is still in progress here. If the banks cannot charge different lending rates to enterprises with different risk profiles, they may not be able to cover losses, nor can they appropriately price their fee-based services and deposit products. On the other hand, as the banks rely mainly on the interest spread for income, interest rate fluctuations may impact their profitability. They have to put in more effort to develop fee-based businesses and raise the related income share to mitigate the impact of price fluctuations in the market. At the same time, they should pay more attention to macroeconomic research in order to adjust business strategies accordingly to avoid losses.
3.
Operational risk
Since many layers of agent and owner relationship exist between bank creditors and share-holders, share-holders and management, as well as between different levels of management, operational risk may easily arise due to malfunctioning of corporate governance and inadequate internal control mechanisms. In recent years, there have been some reforms in internal control mechanisms in the banking sector, for example in risk control, financial management, wage incentives, business procedures and information technology. Efforts have also been made to improve corporate governance. Nevertheless, great challenges remain in the areas of corporate overnance, operational mechanism transformation and internal control.
4.
Liquidity risk
The mismatch of RMB deposit and lending maturities has been an outstanding weakness. By the end of 2004, the ratio of mid- and long-term lending to mid-/long-term deposits had risen to 135.4%, 35.4 percentage points higher than the required ratio, reflecting the fact that large amounts of short-
184
BIS Papers No 28
term deposits are used for mid- and long-term lending. In addition, over half of the working capital lending is put to uses other than the intended use. Thus potential liquidity risks deserve due attention.
5.
Risk of a sharp turnaround in the economy
In fact, the greatest concern in banking operations is sharp ups and downs in the economy. In a boom, the banking sector usually performs well, with high profits and improved asset quality. Recent years have seen the reduction of NPLs at an annual rate of 3-5 percentage points due to the economic upturn. However, in the event of a recession, NPLs might mushroom. This can be proved by the drastic change in NPLs in Thailand, Korea and Singapore before and after the Asian financial crisis. When a financial crisis happens, the economy slows down and as a result, the NPL ratio usually rises substantially. Economic cycles are inevitable in a market economy, especially during the transition period. To deal with this, commercial banks should set up high-quality research teams with the ability to make economic forecasts and reach timely judgments on possible fluctuations, so as to maintain good performance during economic upturns, and to carry out preventive measures in downturns to mitigate any adverse impact. In order to effectively keep the commercial banks from creating a large amount of NPLs after the recent reform, the Chinese government should make efforts to control the economic cycles, to prevent the economy from undergoing sharp changes. From the macro-adjustment viewpoint, besides adopting appropriate monetary policy instruments at the right time to prevent sharp swings, asset bubbles deserve special attention and should be avoided if possible. Once bubbles are formed, it is not easy to make adjustments and more efforts will be needed. One example of this is Japan’s case. In the case of China, most concerns have been focused on the stock market and real estate market. Nevertheless, asset bubbles might take different forms in China, such as appearing in the manufacturing sector, other processing industries or raw material industries, in the form of excess capacity. If such a situation emerges, it would reflect the imbalance of investment and consumption in relation to GDP. Therefore, macroeconomic management and aggregate analysis could not only help the commercial banks in identifying potential risks, but also help to reduce sharp fluctuations in the economy, thus helping banks to avoid accumulating a large amount of NPLs.
6.
Measures to improve banks’ risk prevention capacity
International experience suggests that capital adequacy ratios and risk management capacity are the essential risk prevention factors for banks. In this vein, China’s banking industry needs to make further efforts. On the one hand, the capital adequacy ratio of some Chinese banks is relatively low, lower than the 8% ratio set by the Basel Capital Accord. Loan provision gaps still exist, and some banks do not have enough provisions to keep up with the rapid increase in lending. International experience also shows that the capital adequacy requirement can not only restrain banks from expanding credit business needlessly, but also encourage them to diversify operational risks by exploring new business areas which do not have a high capital adequacy requirement. China’s commercial banks should follow a scientific approach for development, raise their capital adequacy ratios and strengthen their risk prevention capability, through both internal measures, such as improving asset quality and maximizing profit, and external channels like inviting strategic investors and listing on the stock market. On the other hand, they urgently need to set up risk pricing mechanisms and risk control models. With the majority of their income from interest spread, if commercial banks could fully utilize the interest leverage and accurately price the risks of customers, their net spread could enlarge, and therefore profitability could also be strengthened. Accurate identification, measuring, pricing and control of risks are essential for risk mitigation, and also provide the core strength for banks to compete in the market economy. International experiences suggest financial institutions need to invest large amounts of resources to strengthen risk pricing capability, establish sound risk management policy and procedures, and collect adequate data. The risk control mechanisms need to be tested in market fluctuations and economic cycles.
BIS Papers No 28
185
IV.
The Evolution of China’s Financial Stability Policies
1.
Banking supervision
In the past decade, significant progress has been made in strengthening banking supervision, along with the establishment of a supervisory legal framework and the deepening of banking reform. Since 2002, in convergence with the international trend, China’s banking supervision has shifted from emphasizing regulatory compliance only to emphasizing both regulatory compliance and risk supervision. Since the establishment of the CBRC in 2003, supervision has become better targeted and the new supervisory concept of “supervision of legal person, risks, and internal control and greater transparency” has been formed; new standards have also been put into place. A five-category classification of loans, the CAMEL rating system and other prudential regulations have been introduced. Corporate governance and internal control mechanisms have become the focus of supervision. Offsite surveillance and onsite supervision complement each other in ongoing prudential supervision. A risk assessment system and an early warning mechanism have also been set up. While improving prudential supervision of financial institutions, the supervisory agencies have also begun to pay attention to balancing the need to maintain financial stability with the need to encourage financial innovation. International practice suggests that despite the role they play in financial supervision, central banks usually set up different forms of regulatory coordination mechanism with ministries of finance and other supervisory institutions, to share the responsibilities for maintaining financial stability. In China, it is recognized that a coordinated framework including the central bank, the Ministry of Finance, and bank, securities and insurance supervisors, will help to improve financial regulation and maintain financial stability.
2.
Deposit insurance system
Many countries set up investor protection systems such as deposit insurance schemes, a securities investor protection fund and an insurance policy-holder protection fund, to protect the interests of investors and enhance their confidence in the financial system. Different countries may have different schemes. Currently, China has a securities investor protection fund and an insurance policy-holder protection fund. Now the conditions for setting up a deposit insurance system have also been put into place. Since 1997, many deposit institutions have been closed and liquidated. The liquidated assets of these institutions could not repay all the liabilities to individuals. In order to ensure social stability, the government utilized government funds (including local governments’ specialized borrowings from the central government) and central bank re-lending in filling in the gap. While this implicit deposit insurance increases the burden of the authorities, it is not conducive to raising the risk awareness of investors, and weakens market discipline on the operation of financial institutions. The establishment of an explicit insurance system, and utilization of the premium paid by deposit institutions to save the problem institutions, could relieve the government’s burdens. Meanwhile, elimination of the implicit government subsidy and establishment of a market-based limited compensation system would strengthen the risk awareness of market participants, who could then make investment decisions based on the risk information of different institutions and allow market discipline to play its role. In addition, imposing different levels of premium based on the risk profiles of the deposit institutions could also help to form the positive incentive mechanism. China has been well prepared for establishing such a system. First, the gradual deepening of banking reform has set a good micro-foundation. So far, the share-holding reform of the state-owned commercial banks has been bearing fruit; the pilot program of deepening RCC reform has expanded to 29 provinces, municipalities and autonomous regions; and reforms to other financial institutions, like share-holding commercial banks, city commercial banks, UCCs, and trust and investment companies, have also been proceeding smoothly. Both the asset quality and the capital adequacy ratio of China’s banks have improved with sounder operations. Second, with progress made in financial supervision, supervisory measures have been strengthened and standardized. Third, the gradual improvement of the financial legislation has formed a good external environment which consists of the Law of the People’s Republic of China on the People’s Bank of China, the Law of the People’s Republic of China on Commercial Banks, the Securities Law of the People’s Republic of China, the Accounting Law of
186
BIS Papers No 28
the People’s Republic of China, the Guarantee Law of China and the Company Law of the People’s Republic of China. Fourth, the accounting standard of China’s banks has been improved to be in line with the international standard. To be listed in international capital markets, commercial banks need to adopt international accounting and supervision standards which will facilitate the gradual adoption of prudential accounting standards. Fifth, since many countries have already set up their own deposit insurance systems, China can benefit from their experience and avoid their mistakes. Sixth, the sustained, rapid and healthy growth of the Chinese economy in recent years with sound financial operations provides a beneficial macro-environment for the establishment of a deposit insurance system. Currently, the PBC, together with other relevant agencies, is actively working on designing a deposit insurance system that will allow positive incentives and market discipline to come fully into play.
3.
Lender of last resort
Generally speaking, central banks should only provide liquidity support to financially sound financial institutions which run into liquidity problems that may have systemic impacts, while the fiscal authorities deal with those that have become insolvent and unsustainable and might incur systemic risks. In performing the role of lender of last resort, China’s central bank focuses on the following issues: (a)
Systemic risk prevention. Systemic risk may result in financial instability and hinder economic growth; therefore, it requires the central bank to perform the role of lender of last resort during times of financial crisis.
(b)
Moral hazard prevention. The central bank usually performs the role of lender of last resort if the failure of a financial institutions could have systemic effects. For institutions that are in financial difficulties but have no systemic implications, the central bank steps back and lets market mechanisms such as bankruptcy and liquidation play their role. Thus the investors and senior management have to share the cost of and responsibility for their own decisions. The working of market discipline can help to prevent moral hazard.
(c)
Investor protection system. This system is an important guarantee for a central bank to perform its lender of last resort role. In China’s case, a comprehensive investor risk compensation system is not in place. Neither are employment or medical insurance widely available. Therefore, the PBC has to consider whether the closure of financial institutions will result in social instability, in addition to the possible systemic risks. To some extent, the PBC performs a public finance role. To maintain financial stability, an investor protection mechanism will have to be set up, and its relationship with the central bank’s lender of last resort role should be well balanced.
(d)
Coordination of monetary policy to prevent inflation. While acting as the lender of last resort, the central bank should make an effort to conduct sound monetary policy.
Moral hazard should be effectively prevented. In theory, this can be achieved by raising the lending rate, acting as the lender of last resort in a way that preserves constructive ambiguity, encouraging private capital in restructuring financial institutions and strengthening market discipline. In practice, to prevent and diversify risks and maintain financial stability, having the central bank play the role of lender of last resort is not enough; good corporate governance and internal controls, prudential supervision, an investor protection system, and a market-based exit mechanism should also be put into place.
BIS Papers No 28
187
Public Debt Market Risk: The Effects on the Financial System and on Monetary Policy The Case of Colombia Hernando Vargas H. and Financial Stability Department 1
Introduction The expansionary fiscal policy pursued during the last decade in Colombia has raised important issues for the financial system as well as for the conduction of monetary policy. On the one hand, fiscal deficits have generated a dramatic issuance of public debt. The financial turmoil experienced at the end of the decade increased the appetite for these assets, as financial institutions sought to rebalance their portfolio to less risky assets. In addition, since 2002, the Government has been reducing its foreign exchange risk exposure by relying more on the domestic capital market. Recently, the central bank has increasingly intervened in the foreign exchange market, sterilizing its dollar purchases with sales of Government paper. As a result, the financial system has dramatically changed its asset composition towards undiversified holdings of domestic public debt. This has implied that market risk has become a major concern for institutions used to manage credit risk. In Colombia this issue is magnified by the lack of hedging mechanisms and by problems relating to the measures of market risk used to calculate capital requirements. On the other hand, the increase in public debt can impose constraints on monetary policy that differ from traditional effects such as public debt monetization, crowding out and threats to the payments system or financial intermediation. Namely, due to the specific problems mentioned above, market risk can become a relevant constraint on the response of monetary policy in the outburst of an external shock. Facing a shock to the sovereign spread that causes a depreciation of the currency and a fall in domestic long bond prices that affects the financial soundness of intermediaries, the central bank may be constrained or reluctant to adjust policy to keep inflation on target. This note is divided into three sections. The first presents the evolution of public debt and its effect on the financial system. The second section discusses why market risk may become a constraint on monetary policy and how the central bank could respond to a shock to the capital account in these circumstances. The final section concludes.
1. (a)
Public Debt Market Risk and the Financial System Evolution and effects of public debt
Public debt has increased rapidly in Colombia since the mid-1990s as a consequence of the expansion of public expenditure that resulted from the adoption of a new Constitution in 1991 (Graph 1). Although several tax reforms have been approved since then, tax revenues have not kept up with expenditures and increasing deficits have ensued, especially after proceeds from privatizations declined (Graph 2). Central Government gross debt rose from 14% of GDP in 1995 to 54% in 2002 (Graph 3). Part of this increase, however, is explained by the effect of the sharp real depreciation of 2002 on the domestic currency value of external debt. Since 2003 the public debt ratio has diminished due to both a real appreciation and a reduction of the fiscal deficit (Graph 2).
1
Banco de la República, Colombia. The content of this document reflects our views only and not the official position of Banco de la República or its Board of Directors. We are grateful to Ana F. Maiguashca , Carlos Varela and the editorial committee for helpful comments.
BIS Papers No 28
189
The share of foreign currency denominated debt hovered around 50% of total Central Government debt between 1995 and 2002 (Graph 4), while total debt increased (Graph 3). Thus, the foreign currency risk exposure of the public sector rose significantly, becoming a source of concern. Since 2002, the Government has started to rely increasingly on the domestic market (Graph 5). This process was made easier by the disruption of the credit markets caused by the financial crisis of 1998-2000. The financial weakness of households and corporations reduced credit demand, while the fragility of banks’ net worth and the high credit risk perception decreased credit supply. Hence, the Government was able to place increasing amounts of public paper (called TES) in the domestic financial sector without exerting excessive pressure on the market for loanable funds. The growing size of private pension funds’ portfolios has been another source of demand for TES. In this process the Government has carried out several swaps of foreign debt for domestic currency debt, in addition to the direct placement of TES in the domestic market. More recently, an additional supply of TES to the market has come from the sterilization of central bank intervention in the foreign exchange market (Table 1). This intervention has been linked to the uncertainty about the persistence and strength of the appreciation of the domestic currency. Both the rise in domestic public debt and the sterilization of intervention in the foreign exchange market have produced a growing exposure of the financial system to non-diversified market risk, since a large fraction of its TES holdings are long term, fixed rate bonds that are valued mark-to-market. An interesting aspect of this discussion is the rationale behind the willingness of the financial system to accept a growing exposure to domestic public debt without diversifying it. Part of the explanation has to do with the absence of domestic assets with an inverse correlation. However, financial intermediaries may invest abroad to diversify their portfolios, so their incentives to hold a large stock of domestic public debt must be explained by other reasons. Capital adequacy ratios (CARs) well above the minimum required levels and an international conjuncture characterized by declining sovereign spreads and expectations of currency appreciation may be plausible ones. On the other hand, an underestimation of market risk measures or moral hazard (the expectation of a bail-out) may be other, more worrisome explanations. The increase in domestic public debt holdings by financial institutions is probably the mayor change Colombian banks have suffered during the last 5 years. As Graph 6 shows, by 1997 securities holdings by credit institutions represented around 12% of their assets. By 2005, holdings increased to 32%. This dramatic change in the balance sheet structure implies that market risk issues have increased their importance in a financial system used to manage almost entirely credit risk. A simple stress test applied to the Colombian financial system’s holdings of public securities reveals that the effects described are important today and may become more relevant in the future, if exposure to public debt growth is not curtailed. Tables 2 and 3 show that a 100 bps. parallel increase in the TES spot curve could cause losses close to 17% of the profits obtained by credit institutions, which are historically high, and 2.5% of the value of their portfolios as of May 2005. To provide an idea of the potential for such losses to occur, it suffices to recall the electoral uncertainty in Brazil in 2002 which led Colombian sovereign spreads to rise by 490 bps with a corresponding increase in domestic long interest rates of 430 bps. . It subsequently took six months for the spread to return to its previous levels. The problem is not restricted to credit institutions. Pension funds’ exposure to market risk is also significant (Table 3), although it might be argued that a large part of their TES portfolios is to be held to maturity. However, the option given to savers to change their pension fund every six months increases liquidity and market risk for the funds. (b)
Some Additional Problems Specific to Colombia
Adequate bank capital or the existence of risk sharing mechanisms may alleviate market risk. In this regard, however, there are some deficiencies in Colombia that are a matter of concern, especially given the size of the exposure of the financial system to market risk. (i)
Insufficient aggregate risk sharing:
The financial system as a whole holds an uncovered long position in TES. Again, this is the counterpart of a reduced foreign exchange exposure of the public sector. Both risks may be lessened by transferring them to another agent, which in this case would be non-residents. The participation of foreign investors in the local TES markets is small and has been restricted by a tax on interest
190
BIS Papers No 28
remittances, the need to register and set up a “country fund” and a minimum holding period regulation aimed at discouraging short term volatile inflows. In addition, to some extent, domestic and external bonds are imperfect substitutes due to currency risk, among other things. On the other hand, some aggregate hedging has been provided by recent issues of pesodenominated external debt bonds (called Global TES) by the Ministry of Finance, although the amounts are still small relative to the size of the foreign currency denominated debt stock or the TES holdings of the financial system (the Global TES stock represents 1.6% of total Central Government debt). In addition, the hedge provided by this instrument is limited by the fact that part of these bonds could end up in the hands of local financial intermediaries, in particular if there is an effort to do so to improve the liquidity of the bonds and make them more attractive for potential non-resident buyers. Nevertheless, this mechanism should be exploited as long as there is interest on the part of foreign investors 2. (ii)
Insufficient individual risk sharing:
A well developed system to share market risk among financial intermediaries does not exist in Colombia. Among other things, the following factors explain this deficiency. •
Lack of legal protection for the holders of guarantees, which inhibits the development of liquid Repo and security lending markets. It also constrains the administration of margin calls by the exchanges.
•
Incomplete regulation of security lending markets (it is not clear what may or may not be done) and inadequate regulation of Repo markets3.
•
Lack of a benchmark to develop short and long run forward rate agreements.
The result is the possibility that an under-capitalized and over-exposed institution may fail after a shock to the prices of TES. Depending on the size of the institution, the authorities might then face a “too big to fail” problem that could have been avoided through an adequate distribution of market risk among banks. Since the reasons behind this problem are mainly related to legal or regulatory gaps, there is plenty of room for improvement. A Securities Law approved in June 2005 addressed some of these issues, but more remains to be done. The scope for market risk sharing is large. As long as CARs vary among banks, more capitalized agents could offer hedging alternatives to those exposed to a larger extent to fluctuations in market rates. In particular, those agents with substantial long positions in TES but with a CAR close to the regulatory level of 9% could benefit from the hedging offered by highly capitalized and less exposed agents. Graph 7 shows that there is room for such a risk sharing scheme to develop in Colombia. Firstly, there seems to be a negative correlation between exposure to market risk (in TES only) and CAR 4. Secondly, intermediaries with a similar portfolio (in size) have different exposures and adequacy ratios. This suggests that there are suitable counterparts in the hedging market. (iii)
Problems with the measures of market risk:
The measures of market risk in Colombia are based on a VaR approach that suffers from some shortcomings that imply an underestimation of the related capital requirements. Current regulation allows financial agents to reduce capital requirements by matching active positions belonging to the trading book with liabilities from the banking book, thus underestimating the marginal cost of an additional unit of public debt exposure. To illustrate this, Table 4 shows the estimated capital requirements for the financial system that would result from the application of the standard model recommended by the Basel Committee 5. The interest rate module is disaggregated in all instruments
2
Maiguashca A.F. (2005). “Colombian Issuance of Local Currency Debt Abroad: some notes on the opportunities and challenges of the current juncture”. Banco de la República. Mimeo.
3
For example, capital requirements for a Repo are the same as those for interbank loans without collateral. Also the Banks Superintendency regards the holding of simultaneous large long and short Repo positions as an unsafe practice.
4
Given that market risk measurement is imprecise, current CAR figures may be biased. However as long as there is dispersion in CARs and risk exposure among intermediaries with similar portfolio size, the conclusions remain unchanged.
5
Basel Committee on Banking Supervision (1996). Under this approach, cash flows, from both assets and liabilities in the trading book, are mapped into 14 different time bands, depending on either the maturity or the duration of each instrument. For each band, the total net exposure and a risk weight are calculated, in order to estimate the value at risk (VaR) at each
BIS Papers No 28
191
(TES) which are subject to such a risk. The exchange rate and stock exchange modules refer to the financial system’s exposure to foreign currency 6 and market stocks 7, respectively. This exercise illustrates that the current capital requirement (COP$ 880 billion) is about 50% below the requirement implied by the standard model (COP$ 1,271 billion). This happens even though this methodology takes into account only the risk associated to the trading book and the information available is not sufficient for the measurement of market risk for all positions (e.g. private sector securities and options are excluded from the exercise). A correction of this underestimation does not imply an immediate need to raise banks’ capital, since the current CAR for the system is around 14, higher than the minimum requirement (9). However, if the exposure keeps growing with the financing needs of the Government, this constraint may become binding, especially after 2007, when the introduction of a new system to compute credit risk related provisions could imply lower observed CARs 8. In this sense, a revision of the current methodology to measure market risk is important and, with time, would imply a downward correction of the TES prices, since the marginal cost of capital required to buy TES would be higher. Another issue regarding the measurement of market risk has to do with the fact that TES markets are relatively less liquid in stress periods than bond markets in developed countries, so the time period used to estimate the volatilities needed to compute potential losses is probably longer in Colombia than in other countries. Indeed, the main concern for monetary policy is not the losses stemming from a day to day fall in TES prices, but rather a rapid and persistent climb in interest rates such as the one recorded in 2002-2003 after sovereign spreads skyrocketed (Graph 8).
2.
Public Debt Market Risk as a Constraint on Monetary Policy.
The fact that exposure to market risk is high and that conditions for alleviating such risk are limited may pose a constraint on monetary policy. The importance of these conditions for monetary policy depends on the possible effect that a shock to the capital account (e.g. higher sovereign spreads) may have on the health of the financial system and the risk that this may pose for low and stable inflation. Such a shock could simultaneously cause a depreciation of the currency and a decline in the value of the TES. If the depreciation is pronounced or the pass-through effects are large, the central bank may have to increase its interest rates to keep inflation on target. Higher interest rates may in turn result in further reductions in the price of TES. If banks’ capital is too low to absorb those losses, financial stability considerations could constrain the ability or willingness of the central bank to raise interest rates, thereby inducing higher inflation risks. Hence, the perils of a large public debt are reflected in trading off foreign exchange risk for market or inflation risks, and vice versa. Heavier reliance on domestic public financing and international reserve accumulation may reduce the economy’s and the public sector’s foreign exchange risk, but will probably imply larger market risks. If mechanisms for alleviating suck risk are limited and the central bank tries to avoid the realization of market risks, it must assume an inflation risk:
specific time band. The risk weight is defined as the percentage change in the present value of one peso, given the largest 30-day change in the spot rate at each term during the period 2003-2005. The horizontal summation of the VaR in each time band gives the capital requirements which the regulator should impose. 6
Capital requirements are calculated as 8% of the highest position between total net assets and liabilities. Net positions are calculated for each currency and then all net assets (liabilities) are added to calculate the totals referred to above.
7
Capital requirements for this module are calculated as 8% of total stock exposure.
8
This is due to increases in loan provisions derived from the adoption of countercyclical components and more stringent criteria.
192
BIS Papers No 28
Under the conditions described above, it is worth thinking about an adequate response of monetary policy to a sudden, sharp increase in sovereign spreads. How to deal with the risks implied by the financial losses associated with the resulting fall in the prices of TES? To answer this question, the behavior of the economy after the shock must first be characterized. A rise in the spread will result in a depreciation of the currency and a decline in the TES price. Although exchange pass-through is low in Colombia, if the depreciation is large, the inflation target may be at risk 9. Aside from the cost push effects, the depreciation may increase aggregate demand, since the foreign exchange exposure of the private sector has diminished in previous years (Graph 9). Inflation expectations may also go up if the inflation target is not fully credible, which might be the case after a large depreciation. Hence, the central bank will probably have to raise interest rates to minimize the deviation of inflation from its target. The size of such a rise will depend on the magnitude of the pass-through effects. It will also be affected by the behavior of long term rates and its connection with aggregate demand. The increase in long term spreads will cause long domestic rates to go up. If aggregate demand responds not only to short rates, but also to long rates, the required rise in the former will be smaller, since part of the inflation-control job would be done by the long term rates themselves. This effect would work through the impact of long rates on investment or private sector wealth. If both market risk exposure and the shock to the spread are sizeable, the foregoing analysis will have to be qualified, since the threat of bankruptcy of some financial institutions may force the central bank to be less aggressive in fighting inflation. However, it may still have some degree of freedom to limit this possibility: •
The increase in interest rates could be accompanied by intervention in the foreign exchange market. If (sterilized) intervention is effective, this could curtail the size of the depreciation and the interest rate hike. In addition, the monetary contraction resulting from the sale of international reserves could be compensated by purchases of domestic public bonds, thereby moderating the fall in their price. However, this option is limited because the central bank will probably have to raise interest rates, the demand for money will fall and the sale of reserves cannot be fully compensated by purchases of TES.
•
If the shock to the price of TES is too large and the effect on banks’ balance sheets is severe, the authorities may allow them to temporarily stop pricing part of their portfolios mark-to-market when the following conditions are met:
9
–
The shock is perceived as temporary and exogenous (not linked to domestic fiscal conditions).
–
Public debt is deemed sustainable; that is, it is perceived that the Government will be able to honor its debt.
For example, according to the core simulation and forecasting model used by Banco de la República, a 1% exogenous increase in the nominal exchange rate causes a maximum increase in annual inflation of 0.064% four quarters later. It must be noted that this simulation assumes an active policy by the central bank to drive inflation back into line with the target. The experience of 2002-2003 also reveals a low degree of pass-through. Between May 2002 and February 2003 there was a 28% nominal depreciation and between February and September 2003 the currency appreciated by 3.7%. Annual core inflation (excluding food prices) rose from 5.06% in May 2002 to a maximum of 7.4% in September 2003.
BIS Papers No 28
193
–
3.
Some (possibly large) financial losses are allowed. Otherwise, moral hazard problems may be exacerbated leading to future over-exposure to public securities.
Concluding Remarks
The increase in public debt issuance has brought important consequences for the Colombian financial system. The balance sheet structure, specially that of credit institutions, has changed dramatically with an increasing importance of public securities. As result, market risk exposure has become an issue for a financial system used to manage credit risk. This rebalancing has created potential threats for the stability of the financial system not only due to the size of the exposure, but also because of the existence of institutional features that restrict risk mitigation. Particularly, lack of sufficient risk sharing mechanisms as well as a proper measurement of capital requirements make market risk a financial stability issue. As a consequence, monetary policy conduction might be constrained when facing external shocks thus implying an inflation risk. Public debt market risk needs to be reduced in Colombia. The latter calls for an effort to reduce not only public debt but to remove structural impediments for market risk shedding as well as addressing regulatory issues.
194
BIS Papers No 28
Source: DNP and Confis
2005 Proy.
2004
2003
2002
2001
2000
1999
1998
1997
1996
1995
1994
1993
1992
1991
20 18 16 14 12 10 8 6 4 2 0 1990
% of GDP
Graph 1: CENTRAL GOVERNMENT EXPENDITURE WITHOUT INTEREST PAYMENTS
Graph 2: FISCAL BALANCE OF THE CENTRAL GOVERNMENT 1.0 0.0 1993
1994
1995
1996
-1.0
1997
1998
1999
2000
2001
2002
2003
2004
2005 Sept.
% of GDP
-2.0 -3.0 -4.0 -5.0 -6.0 -7.0 -8.0
Source: DNP and Confis
BIS Papers No 28
195
Graph 3: GROSS DEBT OF CENTRAL GOVERNMENT 60
% of GD P
50 40 30 20 10 0 1995
1996
1997
1998
1999
2000
2001
2002
2003
2004
2005 Sept.
Source: Banco de la República
Graph 4: CENTRAL GOVERNMENT DEBT COMPOSITION As percentage of the total debt
60 50
%
40 30 20 10
Indexed CPI-UVR
2004
2003
2002
2001
2000
1999
1998
Fixed rate
Other
2005 Sept.
Foreign Currency
1997
1996
1995
0
Source: Banco de la República
196
BIS Papers No 28
Graph 5: CENTRAL GOVERNMENT: INTERNAL AND EXTERNAL NET FINANCING As a percentage of its fiscal deficit 120 100 80 %
60 40 20 0 1999
-20
2000
2001
2002
2003
Internal net financing
2004
2005 Sept.
External net financing
Source: Banco de la República
Loans and securities investments of credit institutions 35%
80%
30%
70% 60%
25%
50%
20%
40% 15%
30%
10%
20%
TES /Total assets
BIS Papers No 28
Oct-05
May-05
Dic-04
Jul-04
Feb-04
Sep-03
Abr-03
Jun-02
Nov-02
Ene-02
Ago-01
Mar-01
Oct-00
Dic-99
May-00
Jul-99
Feb-99
Sep-98
Abr-98
0% Nov-97
0% Jun-97
10% Ene-97
5%
Net loans/total assets (right axis)
197
Graph 7
Market Risk Exposure (TES only) and Capital Adequacy Ratio 25% Market Risk (TES) / Eligible Capital
Minimum CAR (9%)
20%
15%
10%
5%
0% 5%
10%
15%
20%
25%
CAR
Size of bubbles = market risk (TES)
Source: Banco de la República
Graph 8: COLOMBIAN EMBI VS TREASURY BONDS 2012 18
1100 1000
17
900 16
800
15
700 600
14
500 13
400
12
Source: Banco de la República and Bloomberg
198
TES Ene 12
Oct-03
Jul-03
May-03
Feb-03
Nov-02
Sep-02
Jul-02
Abr-02
Ene-02
300
EMBI
BIS Papers No 28
Graph 9: NET INTERNATIONAL INVESTMENT POSITION-COLOMBIA PRIVATE SECTOR WITHOUT FDI 1/
1997
1998
1999
2000
2001
2002
2003
2004
0
-2,000
Millions of dollars
-4,000
-6,000
-8,000
-10,000
-12,000
1/ Excluding banks Source: Banco de la República
BIS Papers No 28
199
Table 1 Sterilization of the monetary effects of foreign exchange intervention
2004 Net expansion in the market (billions of COP$) Net purchases of International Reserves from the market Millions of US$ Dollars Billions of COP$
2005 Total operations Jan - Oct
4,501.05
6,691.13
2,904.9 7,628.8
3,730.9 8,691.0
3,127.8
1,999.9
–1,460.28
–6,458.8
500.0 1,313.1
2,950.0 6,872.0
Purchases of TES associated to sales of International Reserves to NG Billions of COP$
1,246.2
5,230.3
Deposits of the NG in the central bank
1,393.4
4,817.1
Sales of TES in the market Billions of COP$ Net expansion with the Government Sales of International Reserves to the National Government (NG) Millions of US$ Dollars Billions of COP$
Source: Banco de la República
Table 2 Resistance of credit institutions’ profits Given a 100 bps. increase in TES B interest rates % of profits that Loss given would be lost given a Profits - last 12 by higher 100 bps. increase in interest rates months (April 2005) TES B rates Total Credit Institutions –502,265 Commercial Banks –473,361 Commercial Finance and Leasing Corporations –1,233 Cooperative Banks –99 Finance Banks –27,573
2,941,908 2,471,470 167,367 17,973 285,097
17.07% 19.15% 0.74% 0.55% 9.67%
The exercise was performed using data up to May 2005. Source: Banco de la República
200
BIS Papers No 28
Table 3 Valuation Losses1 As a percentage of the TES B portfolio
Fixed Rate
CPI
UVR
Total
Total Credit Institutions Commercial Banks Commercial Finance and Leasing Corporations Cooperative Banks Finance Banks
2.11% 2.10% 1.92% 1.58% 2.19%
3.32% 3.34% 2.94% 0.00% 2.95%
3.42% 3.41% 4.31% 0.00% 3.57%
2.50% 2.50% 2.22% 1.58% 2.57%
Total Non-Bank Financial Sector Stock Brokers Insurance Corporations Pension Funds Trust Funds
2.60% 2.20% 2.42% 2.72% 2.33%
3.51% 3.54% 3.55% 3.88% 3.21%
3.68% 3.32% 4.20% 3.88% 2.67%
2.96% 2.63% 3.02% 3.09% 2.57%
The exercise was performed using data up to May 2005. 1
For each parallel shift of 100 basis points.
Source: Banco de la República
Table 4
Market Risk Capital Requirements COP$ Billions July 29, 2005
CAPITAL REQUIREMENTS
TES Fixed Rate
831.2
TES UVR TES TRM
135.2 1.4
Globals
22.0
TES CPI INTEREST RATE MODULE EXCHANGE RATE MODULE STOCK EXCHANGE MODULE
64.4
TOTAL
1,054.3 54.7 162.5 1,271.5
Source: Banco de la República
BIS Papers No 28
201
The banking sector after 15 years of restructuring: Czech experience and lessons Vít Bárta and Miroslav Singer Czech National Bank
1.
Introduction
Over the past 15 years, the banking sector in the Czech Republic has undergone a series of fundamental changes. Nowadays, the sector is stabilised, shows rather healthy financial results and has sufficient equity to cover the risks it undertakes. Apart from being almost exclusively controlled by foreign banking groups it is similar to the banking sectors in medium-sized advanced European economies. Thus, it could be suggested that the transformation of the banking sector has been completed. The restructuring of the sector was anything but easy, smooth and painless. It was accompanied by numerous difficulties, and all stakeholders, i.e. bank owners, markets, lenders, depositors, supervisors and policy-makers, had to learn tough lessons in a hard way. The purpose of this country study is to summarise the basic features of the banking sector restructuring which took place in the Czech Republic during the 1990s and to present basic facts about the final phase of the restructuring process, i.e. after the privatisation of the big banks at the end of the 1990s. We focus on the role of the so-called “transformation institutions”, which facilitated the privatisation process, and study the performance of the banking sector in recent years. We try to identify the most important relationships between the banking sector restructuring process, macroeconomic developments and the overall economic transformation. We present some estimates of the costs associated with the banking sector restructuring process and outline some tentative lessons emerging from the Czech pursuit of a competitive banking sector. We believe our findings to be useful for those emerging markets which are still undergoing the process of banking sector restructuring.
2.
Banking sector restructuring during the 1990s
The development of the Czech banking sector during the 1990s has been thoroughly described in a number of studies. 1 In this section, we summarise only the most important developments. These can be organised under the following headlines:
1
Havel, J. (2004), Bank privatisation - Critical view of the Czech deal, Politická ekonomie 52; Tůma, Z. (2003), Banking Sector Development in the Czech Republic, In: Structural challenges for Europe, Cheltenham, U.K. and Northampton; Weill, L. (2003), Banking efficiency in transition economies - The role of foreign ownership, Economics of Transition 11; Hájková, D., Hanousek, J., Němeček, L. (2002), The Czech Republic’s Banking Sector: Emerging from Turbulent Times, EIB Papers, Vol. 7; Dědek, O. (2001), Bank Consolidation in the Czech Republic. In: The Banking Industry in the Emerging Market Economies: Competition, Consolidation and Systemic Stability, BIS Papers, No. 4, BIS; Matoušek, R. (2001), Banking Sector Restructuring and Debt Consolidation in the Czech Republic, In: Financial and monetary integration in the new Europe: Convergence between the |EU and Central and Eastern Europe, Cheltenham, U.K. and Northampton; Racocha, P. (2000), The Czech Banking Sector - The Role of Prudential Regulation, In: European Union accession: Opportunities and risks in Central European finances, World Bank, Washington; Kunert, J. (1999), Czech banking Certainly not in year zero, Finance a úvěr 49; Jílek, J., Jílková, J. (1999), Impact of May turbulences in 1997 on profit and loss of banks in the Czech Republic, Politická ekonomie 47; Bartlett, D. (1996), Commercial banks and corporate governance in the Czech Republic and Hungary, Post-Soviet geography and economics 37; Mervart, J. (1996), Competitiveness of the Czech banking sector, Politická ekonomie 44.
BIS Papers No 28
203
2.1
Splitting of the “monobank” and creation of big state-owned banks
The building of a competitive banking sector started virtually from scratch. The first step was the splitting of the former socialist “monobank”, State Bank of Czechoslovakia (SBCS), and the creation of a two-tier banking system. From the ashes of the monobank, four large state-owned banks were established. However, at the very beginning of the 1990s the banking sector was suffering from all conceivable deficiencies inherited from the former central planning system: undercapitalisation, a burden of bad loans, a shortage of the long-term funds necessary to support banks’ development plans, inexperienced staff, non-existent risk management, legal loopholes, etc. (see for example Dědek (2001)). These features had far-reaching consequences: the banking sector was very weak and various forms of government assistance turned out to be practically inevitable. 2.2
Consolidation Programme I
The rather difficult starting position of the newly formed banks led to the implementation of “Consolidation Programme I”. In 1991, Konsolidační banka (KoB) was established as a major vehicle for the takeover of bad loans. The Consolidation Programme involved operations associated with the removal of bad loans extended before 1990 from the balance sheets of Komerční banka (KB), Česká spořitelna (ČS), Investiční banka (IB) and SBCS, operations to strengthen the capital of the stateowned banks (KB, ČS and IB), and the clean-up of the balance sheets of other banks in the periods both before and after the division of Czechoslovakia. These operations were as follows: (a)
the transfer of assets to KoB;
(b)
the write-off of loss loans from National Property Fund (NPF) 2 funds;
(c)
increases in the equity of banks with NPF bonds and in the capital of the banks split off from SBCS;
(d)
a capital increase in Československá obchodní banka (ČSOB);
(e)
the transfer of credits and guarantees from ČSOB to Česká inkasní (ČI). 3
The overall costs of Consolidation Programme I are estimated to have reached more than CZK 100 billion (which is about 7% of 1995 GDP). 2.3
Entry of small private banks
Shortly after the economic transformation began, new banks started to operate in the Czech economy. Licensing policy was quite benign at that time. This was a reflection of the rather liberal approach towards new start-ups in any industry in general and in the banking sector in particular. The principal motivation was to increase the competition of the four large banks (created from the monobank), which were considered too inertial and ineffective. The number of newly entering (“truly” private) banks in the Czech economy was impressive: 13 new banks were established in 1990, another 13 in 1991, 17 in 4 1992, 10 in 1993, and four in 1994. However, this huge expansion in new banks later caused serious problems for the Czech financial system.
2
National Property Fund of the Czech Republic was founded in 1991 for the purpose of providing for the technical implementation of individual privatisation decisions and the temporary management of state ownership interests intended for gradual privatisation, in accordance with act on the powers of bodies of the Czech Republic in the transfer of state property to other persons and the act issued by the Czech National Council on the National Property Fund No. 171/1991 Coll.
3
Česká inkasní (ČI) was a single-purpose financial institution controlled by the Ministry of Finance. It was established in 1993 and was authorised to clean up the portfolio of the state-owned ČSOB during the latter’s transformation (particularly of inherited old receivables from state-owned companies having trading partners in countries with a high political risk). Agreements were concluded between the Ministry of Finance, the Czech National Bank and ČSOB. Česká inkasní for this purpose obtained a loan of CZK 29 billion from ČSOB guaranteed by the National Property Fund.
4
The total number of banks peaked at 55 in the mid-1990s. Of these, 32 were Czech-owned, 15 were foreign-owned and eight were foreign bank branches.
204
BIS Papers No 28
2.4
Crisis of small banks
Right from the outset, the small new private banks were operating under difficult conditions. They were typically undercapitalised and faced types of risk that had not been common earlier. Their strategies were focused on increasing their market shares at the expense of the relatively established big banks, which often drove them beyond prudent thresholds. The above-mentioned benevolent licensing policy, combined with inexperienced and still weak banking supervision and the specific process of small- and large-scale privatisation, caused the small banks to take on rather unsound development strategies. Banks assisted the rapid pace of transformation but, at the same time, took on risks comparable with those usually assumed by venture capitalists, risks which even the relatively high margins they enjoyed could not cover. The absence of effective legal and institutional supervision also invited fraudulent behaviour by the managements of these banks. Thus, the new small banks started getting 5 into trouble shortly after the beginning of the economic transformation. During 1995, problems became apparent in some small banks with mostly Czech capital. Although these banks accounted for only a small part of the banking sector (about 4% of its total assets), the situation had to be addressed in order to ensure the consolidation and creditworthiness of the banking sector as a whole. The banking supervisory authority focused on those banks where the problems were most serious, forcing individual consolidation programmes on them. Despite all these efforts and remedial measures, the unfavourable trend was not prevented in most cases. This was chiefly because bank owners were often unwilling or financially unable to take radical action to solve their banks’ problems, and also because the problems originating from when the banks started were just too big to solve. A lack of supervisory experience and motivation also contributed to the failure of the consolidation programmes. 2.5
Consolidation of small banks
The Czech National Bank (CNB) prepared at the end of 1995 and initiated at the beginning of 1996 a comprehensive programme of small bank consolidation to prevent a domino effect within the small bank sub-sector, which could have undermined public confidence in the banking sector as a whole. Consolidation Programme II clarified the negative financial situation facing a number of small domestic banks. The banking supervisory authority reacted with the uncompromising interventions allowed to it by law in cases where banks’ shareholders rejected or were not able to accept an appropriate solution and/or where prolonging those banks’ negative financial situation was unjustifiable. Of the total of 18 small banks, 15 were treated under Consolidation Programme II, with nine of them undergoing a radical solution consisting in the revocation of their licences or the introduction of conservatorship following a reduction in capital. In other cases there was co-operation with the existing shareholders, or new investors were found to cover the banks’ potential losses. The outcome of the greater pressure on the supervisory authority to remedy banks’ shortcomings was a painful but ultimately purgative process, the postponing of which would only have harmed the economy further. It is estimated that the costs of Consolidation Programme II were comparable to those of Consolidation Programme I, i.e. more than CZK 100 billion. 2.6
Stabilisation Programme
The implementation of Consolidation Programme II had negative side-effects. The public’s confidence in the banking sector was falling and the risk of a run on small banks was increasing. To reduce the risk of a liquidity crisis for small banks and to promote the overall stabilisation of the banking sector, a Stabilisation Programme was adopted in 1996. The programme was intended for the 13 small banks 6 existing at the time. It entailed Česká finanční (ČF) purchasing insolvent receivables from banks at
5
Kreditní a průmyslová banka ran into problems in 1993, Banka Bohemia and AB Banka in 1994 and Česká banka in 1995, to mention just a few.
6
Česká finanční was given the task of technically implementing a programme to enhance the stability of the Czech banking sector. This “stabilisation programme”, declared under Czech Government Resolution No. 539 of 16 October 1996, was designed for small and medium-sized banks. ČF was also tasked with implementing a so-called “consolidation programme” which had been announced earlier by the CNB in connection with the consolidation of the banking sector/mergers of small
BIS Papers No 28
205
their nominal value, up to a maximum of 110% of the banks’ capital. This was done on the basis of, return on assets with the banks obliged to gradually create a reserve to repay their dues to Česká finanční after seven years. The Stabilisation Programme turned out to be unsuccessful. Although six banks joined the programme, five of them were later excluded, closed and liquidated after failing to comply with its criteria. Only one bank emerged from the programme successfully. The costs of the Stabilisation Programme are estimated at about CZK 15 billion, still a fraction of the costs of the earlier programmes. 2.7
“Stabilisation recession”
After 1996, the Czech economy struggled with macroeconomic destabilisation. The loss of the nominal anchor in May 1997, the bursting of the privatisation asset price bubble and a consequent koruna depreciation in the second half of the year increased inflation and inflation expectations. Due to the general economic uncertainties, poor supply-side performance and monetary policy tightening, the economy slipped into recession. GDP declined by 0.7% in 1997 and by 1.2% in 1998, and in 1999 growth was still sluggish (1.2%). The negative economic developments and the related worsening in the economic situation of debtors continued to adversely affect even the large banks’ financial results and the quality of their assets. Persistent shortcomings in the legal environment preventing banks from recovering receivables from debtors, together with the diminishing creditworthiness of the business sector and very high ex ante real interest rates, fostered a decline in lending and the maintenance of a relatively high ratio of classified loans to total loans. Figure 1 illustrates the situation, showing that the profitability of banks per employee started to worsen in 1997 and remained negative for three consecutive years, bottoming in 1998. Figure 1 Net profit per employee In CZK ‘000s 1,400 1,200 1,000
in CZK ‘000s
800 600 400 200 0 -200 -400 -600 1994
1995
1996
1997
1998
1999
2000
2001
2002
2003
2004
2005H1
Source: CNB
banks. ČF’s objective is to manage bad debt purchased from small banks in accordance with the law with the maximum return in the shortest possible time and at the lowest possible cost.
206
BIS Papers No 28
The end of the 1990s was thus characterised by increased fragility of this vital component of the economy. Figure 2 shows the decline in loans (in both absolute and relative terms) during the period 1998-2002. In popular terms, the decline in bank lending was termed a “frozen credit channel”. Needless to say, the observed credit contraction impeded and slowed down the economic recovery and at the same time substantially weakened the efficiency of the transmission mechanism of CNB monetary policy. The situation of credit contraction was sometimes labelled a “credit crunch” (see Hampl & Matoušek (2000) for more details). Figure 2 Bank loans and ratio of loans to GDP, 1994-2004
0.6
1,200
0.5
1,000
0.4
800
0.3
600 Loans/GDP (left axis)
0.2
400
Loans (right axis)
200
0.1
0
0 1994
1995
1996
1997
1998
1999
2000
2001
2002
2003
2004
2005H1
Source: CNB, CZSO, own computations
Only in 2003 did loans recover in both absolute and relative terms, following a return to the black (see Figure 1). The generally shaky situation of the banking sector can also be illustrated by the decline of deposits in banks (in relative terms) in 1999 and 2000, as shown in Figure 3. 7 The negative macroeconomic trends and bank losses at the end of the 1990s hit the large banks hard. The state, as the main shareholder, contributed to strengthening ČS and KB’s capital and cleaning up their balance sheets. The cost of the clean-up amounted to about CZK 76 billion for these two banks during the period 1998-2000. These operations temporarily rescued the big banks and preceded their privatisation; strictly speaking, they were a necessary condition for it.
7
It can be suggested that the decline in deposits after 2002 also reflects the negative attitude of depositors. However, this can rather be attributed to a decline in nominal and real interest rates and a correspondingly low incentive to save.
BIS Papers No 28
207
Loans (in CZK bn)
Loans/GDP
In CZK bn
Figure 3 Ratio of client deposits to GDP 0.7 0.68 0.66 0.64 0.62 0.6 0.58 0.56 1994
1995
1996
1997
1998
1999
2000
2001
2002
2003
2004
Source: CNB, CZSO, own computations
2.8
Privatisation of big banks
The privatisation of the big state-owned banks was an ever-present issue during the Czech economic transformation process. It was often discussed by governments, but the decisive steps were repeatedly postponed in the first half of the 1990s, typically due to pressures from smaller parties in the coalition government and to very vocal leftwing opposition on this issue, despite clear interest from potential investors. In addition, the privatisation of the minority or majority equity stakes in large banks via the voucher method in the first half of the 1990s did not bring the desired results in terms of a strengthening of their management and corporate governance. Ownership was untransparent and excessively diluted, and control by the state inefficient. As a consequence, the efficiency, profitability and competitiveness of the big banks were, in line with the general macroeconomic picture, relatively 8 poor and worsening in the second half of the 1990s. Considering the unfavourable developments in the latter half of the last decade, finding a strong strategic investor became an imperative and a precondition for their stabilisation and further growth. The privatisation of banks resumed in 1998. In January, the state’s minority 36% stake in Investiční a Poštovní banka was sold to Nomura International. In June, General Electric Capital Services acquired substantial parts of Agrobanka, then the largest private bank, which had been effectively statemanaged for the previous two years. In 1999, the state’s almost 66% stake in ČSOB was sold to Belgium’s Kredietbank. In 2000, the 52% stake in ČS was sold to Erste Bank Sparkassen, and finally, in 2001 the remaining state stake in KB was sold to Société Générale. By 2001, the privatisation of the banking sector had basically been completed, and further restructuring followed an evolutionary 9 pattern without any active government involvement. The costs related to the privatisation of the big banks are estimated by Havel (2004) at about CZK 100 billion.
8
The engagement of the state-owned banks in very generous lending in the mid-1990s was sometimes labelled “banking socialism”. This term reflected the fact that state-controlled banks responded to politicians’ calls to “support” the economic transformation at the expense of the soundness of their balance sheets.
9
Many insights into the procedures, transparency and fairness of the privatisation of the three big banks have been offered by Havel (2004).
208
BIS Papers No 28
2.9
Bankruptcy of Investiční a Poštovní banka
In June 2000, Investiční a Poštovní banka faced a dramatic run on primary deposits and a serious liquidity crisis. The emergency was resolved by imposing conservatorship on the bank and by a subsequent sale to ČSOB. During 2001 and 2002, six tranches of “black” assets and 10 tranches of “grey” assets were transferred to KoB. The total amount of these assets was about CZK 100 billion. Additional costs running to more than CZK 71 billion were associated with the transfer of off-shore funds and other operations. 2.10
Banking sector recovery
The economic recovery, which started in 1999 and accelerated in 2000, the rescue operations carried out by the state (most notably the capital strengthening and takeover of bad loans by KoB) and the completion of the privatisation of the big banks had profound consequences for the performance of the banking sector. The burden of bad loans persisting throughout the 1990s started to decrease rapidly after 2000. Figure 4 shows the plummeting share of non-performing loans in total loans. Figure 4 Share of non-performing loans in total loans, 1995-2004 In % 30
25
%
20
15
10
5
0 1995
1996
1997
1998
1999
2000
2001
2002
2003
2004
2005H1
Source: CNB
The above figure offers an interesting angle on the banking sector story. Remarkably, the crisis in small banks occurring in 1996-98 left no visible impact on the level of non-performing loans. On the other hand, losses incurred partly by the stabilisation recession temporarily increased the share of non-performing loans in 1999. The low ratio of bad loans in recent years reflects the soundness of the sector at a level unseen throughout the entire transformation period.
3.
Costs of the restructuring process: volume, structure and time patterns
In this section we summarise the costs related to the banking sector restructuring process from the beginning of the 1990s until 2004. 10 It should be noted that the cost computation is strongly influenced by the methodology adopted and that different authors may arrive at different findings (see CNB
10
We draw here from Ministry of Finance and CNB (2005).
BIS Papers No 28
209
(2000) and Ministry of Finance and CNB (2005) for more details). The estimated costs in terms of GDP each year are shown in Figure 5. Figure 5 Transformation costs of the banking sector/GDP In % 12
as a % of GDP (current prices)
10
9.7
8 6 4.2
4 2.8
2.2
2
1.5
1.4
1.6
1.6 0.9
0.2
0 -0.4
-0.4
1994
1995
-1.0
-2 1992
1993
1996
1997
1998
1999
2000
2001
2002
2003
2004
Note: The costs incurred each year are divided by nominal GDP (i.e. at current prices) in that year. Source: Ministry of Finance and CNB (2005), CZSO and own computations
It is useful to discriminate between the different reasons for the transformation costs. Figure 6 shows three kinds of costs associated with the restructuring of the banking sector, namely those inherited from the centrally planned economy, those incurred by the consolidation and stabilisation of banks, and those stemming from pre-privatisation assistance. Figure 6 Structure of the costs of banking sector restructuring, 1992-2004 In CZK bn 100 80
in CZK bn
60 40 20 0 Consolidation and stabilisation of banks Pre-privatisation assistance Related to centrally planned economy
-20 -40 1992
1993
1994
1995
1996
1997
1998
1999
2000
2001
2002
2003
2004
Note: Positive values denote costs, while negative values denote revenues Source: Ministry of Finance and CNB (2005)
210
BIS Papers No 28
The structure and time pattern of the transformation costs are intuitive. In the initial period the costs inherited from the centrally planned economy dominated (reaching about CZK 62 billion over the years), but in 1997-98 the consolidation and stabilisation costs (amounting to about CZK 88 billion) took the lead. With the onset of the privatisation of the big banks, pre-privatisation assistance clearly dominated and persisted until 2003, amounting to approximately CZK 220 billion. 11 The overall costs in money terms were about CZK 370 billion, which is equivalent to 24% of GDP accumulated on annualised basis over the period.
4.
Costs of the banking sector restructuring and the economic transformation: lessons
We have tried to show that the development of the banking sector followed the overall pattern of the economic transformation. In the initial phase, the banking sector inevitably suffered from the socialist legacy. This implied rather unfavourable starting conditions in practically every aspect of its operation. In the first half of the 1990s, the banking sector faced new challenges stemming from a loose legal and institutional framework, inexperienced and underdeveloped banking supervision, privatisation, a lack of competition, political pressures to provide enough financing for the economy, and often fraudulent behaviour by bank owners and managers. This led to numerous bank bankruptcies, widespread distrust and a persisting burden of bad loans. The “stabilisation recession” in the second half of the 1990s also had far-reaching consequences. The banking sector started accumulating sizeable losses, thus exacerbating the overall fragility of macroeconomic performance. Also, the credit contraction weakened the efficiency of CNB monetary policy, which works mainly through the interest rate channel. Only after the privatisation of the remaining three big banks with large state-owned stakes did the restructuring of the banking sector reach completion. We should mention that the transformation costs were borne by a whole range of public sector institutions. These included not only the “transformation institutions” (namely the NPF, KoB and its successor Česká konsolidační agentura, ČI, Česká finanční, KONPO, etc.), but also the government (via the budget) and the CNB. This indicates that the decisions to bear the transformation costs were often taken on an ad hoc and very pragmatic basis without applying any systemic approach or framework. It can even be suggested that decision-makers were repeatedly surprised by the depth of the problems concentrated in the banking sector, thus becoming followers of events rather than active leaders. Simplifying somewhat, we can outline the following tentative lessons: 1.
The very high initial costs related to the socialist legacy were most probably to a large extent unavoidable. The economic transformation started quite soon after the collapse of the centrally planned economy and there were no ready-made blueprints for a smooth regime change. The toll had to be paid.
2.
The subsequent period (after 1992 or so) is more questionable. Exaggerating slightly, we can say that the banking sector partially substituted for (or mimicked) the former system of central redistribution of resources. The relative inefficiency of enterprises was transformed into banking sector losses. This process was fostered by political pressures and facilitated by underperforming banking supervision, a malfunctioning legal framework and underestimation of the risks involved. Initially, these losses were implicit and hidden, but over time they became explicit. The costs were dispersed over numerous agencies and unfortunately there was a tendency to neglect them and postpone remedial solutions. We believe that a large proportion of the costs incurred due to the consolidation and stabilisation of the banking sector could have been avoided and the corresponding risks shifted onto the private sector.
11
The rather high costs in 2002 and 2003 refer, among other things, to the above-mentioned tranches of “black” and “grey” assets, i.e. bad loans and similar assets, transferred from the former Investiční a Poštovní banka to the balance sheets of KoB/Česká konsolidační agentura.
BIS Papers No 28
211
3.
The timing of the privatisation of the big banks was intensively discussed throughout the 1990s. The postponements of these privatisations in the early 1990s were due to purely political motives based on the belief that some control of this crucial sector was advisable in a generally uncertain (= rapidly changing) environment. However, the sector of big stateowned banks extended (at least partially) the previously existing soft budget constraint and did not seem to foster any hardening. Moreover, the government did not prove to be a good owner, which implied operational inefficiency and managerial underperformance. We believe that earlier privatisation of the big banks would have yielded higher revenues (as their market shares were initially very high) and that the transformation costs incurred by the public sector during the stabilisation recession would have been much smaller, as the majority of the potential costs would have been covered by new private owners. 12 This observation is suggested by the substantially improved performance of the banking sector after the completion of the privatisation of the big banks. With the benefit of hindsight, the hesitation regarding privatisation of all state-owned banks sooner rather than later thus seems to have been unjustified. In other words, the postponement turned out to be unnecessarily costly.
5.
Summary
The contrast between the banking sector in the former Czechoslovakia in 1990 and that in the Czech Republic in 2005 is extremely stark. Over the past 15 years, the largely state-owned, undercapitalised and poorly managed banks have been transformed into a foreign-owned, reasonably sound and competitive banking sector which meets the requirements of the post-transformation economy and complies with the standards of membership in the EU. The restructuring of the banking sector proved to be costly over the years of transformation. We believe that the costs related to the consolidation and stabilisation of the sector in the mid-1990s could have been mitigated, and those incurred by postponing the privatisation of the big banks even largely avoided. Unfortunately - or luckily - we cannot repeat the socio-economic experiment of the 1990s to see whether our belief is justified or not. Still, we believe that learning from the Czech lessons might benefit policy-makers in countries where the establishment of a competitive and privatised banking sector is high on the political agenda.
References Czech National Bank (2000, 2001, 2002, 2003, 2004), Banking Supervision. Czech National Bank (2000), Transformation Costs of the Recovery and Consolidation of the Banking Sector, www.cnb.cz. Czech National Bank (2004), Financial Stability Report. Dědek, O. (2001), Bank Consolidation in the Czech Republic. In: The Banking Industry in the Emerging Market Economies: Competition, Consolidation and Systemic Stability, BIS Papers, No. 4, BIS. Hampl, M., and Matoušek, R. (2000), Úvěrová kontrakce v ČR - její příčiny a důsledky, VP č. 19, CNB (in Czech). Havel, J. (2004), Bank privatisation - Critical view of the Czech deal, Politická ekonomie, 2004 č. 1 (in Czech). Ihnát, P., and Procházka, P. (2002), The Financial Sector in the Czech Republic: An Assessment of its Current State of Development and Functioning. In: Financial Sectors in EU Accession Countries, (Ed. Thimann, C.), ECB. Ministry of Finance and Czech National Bank (2005), Analýza transformačních nákladů v letech 19912004, mimeo (in Czech).
12
It should be noted that the pre-privatisation costs were incurred in the advanced stage of transformation, when the “rest of the economy” was basically private.
212
BIS Papers No 28
Issues of Risk-based Supervision in Hong Kong William Ryback
1. This paper summarises the latest efforts of the HKMA to enhance the effectiveness of its risk-based supervisory approach.
Risks and challenges to the supervisory process 2. In an effort to make banking supervision more risk-focused and effective, in 2004 the HKMA conducted a Risk and Challenges Study with a view to identifying the risks and challenges that would have a material impact on banking supervision in the medium term. The Study identified a number of areas 1 where the HKMA believed risks might be rising and where a reprioritisation of supervisory resources and focuses was deemed necessary. 3. In the light of the results of the Study, the HKMA re-organised its Banking Supervision Department by assigning specific responsibilities to individual divisions within the department to manage one or more of the risks identified in the Study. The HKMA believes that such a functional “ownership” structure will improve accountability, help minimise any possible overlaps or gaps in tackling these risk factors and facilitate the accumulation of a strong knowledge base on the identified risks. 4. As far as the institutional supervisory function is concerned, the HKMA has adopted a “clustering approach” whereby institutions with similar risk characteristics are grouped together and supervised by the same supervision division. This arrangement will help to build up the HKMA’s supervisory knowledge base in the longer run, thereby improving the effectiveness and efficiency of its supervisory process. 5. Following this approach, in late 2004 the HKMA re-organised its Banking Supervision Department into five divisions as follows: •
Division for Large and Systemically Significant Institutions With consolidation among local banks and the subsidiarisation of the local operations of major foreign retail banks, the banking sector in Hong Kong has become increasingly polarised in terms of size. Coupled with the fact that the Deposit Protection Scheme (to be launched in 2006) will help reduce the potential contagion arising from the failure of small or medium-sized institutions, the HKMA considers that large banks should be given a higher priority in the allocation of supervisory resources given the broad systemic implications involved. Apart from banks chosen on the basis of sheer size considerations, this division will also supervise institutions whose failure may give rise to significant systemic implications. 2 This division also develops general guidance on best industry practices for risk management based on experience gained from the institutions it supervises. These practices will be used as benchmarking references for other institutions.
1
The key risk areas identified in the Study include technology risks, issues arising from the increasing presence of Hong Kong banks in the Mainland Chinese market and vice versa, increased compliance risks as banks become more involved in selling wealth management products, growing complexity of banking operations, work in relation to the implementation of Basel II and new accounting standards, and a structural shift of the Hong Kong banking sector with smaller local banks becoming more vulnerable to competitive pressure.
2
These include, for example, an institution that issues and manages a widely circulated stored value card for payment of transport service charges, an institution which acts as the agent settlement bank for a major credit card, and an institution which has a significant volume of in-sourced processing of trade financing documentation from other banks.
BIS Papers No 28
213
•
China Division It is anticipated that more Hong Kong banks will establish a business presence in the Mainland market in the next few years. As the financial market and banking regulations in Mainland China evolve, one of the challenges that individual banks will face will be the need to ensure that they have the requisite expertise to analyse properly the business and regulatory risks associated with their business expansion. The HKMA will also need to strengthen its knowledge base about the banking supervisory practices and requirements of Mainland China in order to ensure that the most effective and efficient supervisory process is deployed. The China Division was established to supervise institutions with Mainland Chinese connections and to monitor developments in banking regulations, financial market infrastructure, and economic and financial policies in Mainland China as well as assessing the implications of these developments for the HKMA’s supervisory work. The Division also coordinates with the Mainland authorities on banking supervisory matters.
•
Division for Locally Incorporated Institutions This division is mainly responsible for supervising medium-sized to small local retail banks and other locally incorporated authorised institutions specialising in niche lending businesses, such as car loans, hire-purchases, personal loans and sub-prime lending activities. These institutions are generally more vulnerable to competitive pressure. Grouping them together will help focus our supervisory efforts on common weaknesses and risk factors associated with such institutions. Furthermore, given that smaller banks are generally more susceptible to contagion arising from the failure of another institution of the same kind, this arrangement should facilitate more coherent and effective management of potential banking crises caused by the failure of a small local bank.
•
Division for Overseas Incorporated Banks The scale of operations of overseas incorporated institutions is usually small with limited scope of activities and should therefore have limited systemic implications for the banking sector. Given that the primary responsibility for supervising these institutions rests with the relevant home supervisors, our focus is to ensure an effective exchange of information with these authorities so that any supervisory concerns can be dealt with promptly. To facilitate this, the HKMA has so far entered into Memorandum of Understanding or other formal arrangements with 12 supervisory authorities in 10 countries.
•
Technical Supervision Division The increasing use of and reliance on technology by banks will shift their risk profile increasingly towards operational risks. In addition to IT risks, the ongoing pressure on profitability will also result in more banks seeking to outsource their operations to low cost overseas centres. Such outsourcing, if not managed properly, will increase banks’ operational risks. At the same time, pressure on interest income in recent years has driven banks in Hong Kong to diversify their sources of income to fee-based activities, such as the sale of wealth management products to investors. This gives rise to a need to supervise the business conduct of intermediaries. To improve management of these new activities and risks and to facilitate the accumulation of relevant expertise, the Technical Supervision Division was set up to tackle specialised areas of supervision.
6. The above institutional structure enables the HKMA to tackle various risks and challenges faced by the banking sector in a more coherent and homogeneous manner. With the building-up of expertise in specific challenge areas over time, the HKMA will also be better positioned to sharpen its supervisory focuses on different types or segments of banking institutions, thus moving towards a more genuine risk-based supervisory approach.
Enhanced supervisory contacts with overseas supervisors 7. In addition to introducing institutional changes, the HKMA places great emphasis on the need to strengthen supervisory cooperation with overseas banking supervisors given the increasing
214
BIS Papers No 28
globalisation of banking operations. The impending implementation of Basel II will necessitate more effective supervisory contacts with the home supervisors of foreign institutions operating in Hong Kong. In order to prioritise better the supervisory resources and formulate appropriate supervisory objectives for institutions with international operations, in 2005 the HKMA developed a framework for maintaining supervisory contacts with overseas banking supervisors in a more structured manner. Details of the framework are set out below:
Type of country
Supervisory contact frequency
Forms of contact
Type A country - Total market share of institutions beneficially owned by interests in the country represents over 4.5% of aggregate deposits or over 8% of aggregate assets before provisions
Ongoing
Phone, meetings and correspondence
Type B country - Total market share of institutions beneficially owned by interests in the country represents over 1% but not exceeding 4.5% of aggregate deposits
At least annually
Formal meetings
2-4 year cycle
Informal exchange of views
Type C country - Countries other than Type A and Type B
Enhanced monitoring of “macro” risks 8. The HKMA has also taken steps to strengthen its ability to monitor trends and emerging risks on a system-wide basis. It recently started to prepare a semi-annual Banking Risk Report that adopts a macro prudential perspective regarding the performance of the banking system and monitors key performance and financial stability benchmarks. The report will aid us in identifying key emerging risks in the banking system, such as excessive risk concentration or emerging areas of vulnerability. The results of this assessment provide a “macro” risk assessment perspective and will feed into the planning and prioritisation of the supervisory process. This will help the HKMA to ensure that its supervisory resources are properly allocated to the main areas of risk or vulnerability in the banking system.
BIS Papers No 28
215
Bank Efficiency in the Enlarged European Union 1 Dániel Holló and Márton Nagy 2
1.
Introduction
The banking sectors of the European Union have faced numerous challenges in the past decade. With regard to old EU members, as a result of the Second European Banking Directive and the Single European Passport the speed of deregulation accelerated, and with the elimination or lowering of barriers market-entry costs substantially decreased, favouring competition and the creation of a Unified Banking Market. Economic and monetary union also encouraged the abolition of operational obstacles. The introduction of the euro opened the way for the further deepening of banking sector integration, whereby local banks gradually lost their competitive edge to foreign banks, mainly in terms of financial services. The rapid development of information technology, the appearance of new competitors exploiting opportunities offered by a global capital market and the creation of new markets linked to rapid innovations also promoted the intensification of competition and the accelerated consolidation of the European banking system. Following the collapse of the centrally planned economic regime and the break-up of the mono-bank system in the new EU members, financial market liberalisation as well as economic privatisation laid the foundations of the modern financial institutional system. Considerable foreign capital inflow, market consolidation and the creation of an efficient regulatory framework contributed to the rapid transformation and development of the banking system and the market- based pricing and lending activity of banks. The integration of the banking system into the Single Banking Market commenced in parallel with the transformation of the financial intermediary system. Economic convergence, the harmonisation of regulations and the enlargement of the EU further accelerated the consolidation and integration of the banking systems of the new EU member states. Several factors can generate efficiency differences and change their measure across banking sectors of EU members. On the one hand, discrepancies in operational environment, i.e. country-specific elements and, on the other, different managerial abilities may cause an efficiency gap. National discrepancies in operational environment can derive from macroeconomic differences or dissimilar characteristics of financial infrastructure and institutional system, as well as from other country-specific factors. Managerial ability is defined in terms of adequate resource allocation and beneficial utilisation of technological opportunities. While operational environment exogenously explains efficiency differences, the executive and professional competence of management endogenously contributes to them. Our study focuses on the estimation of the efficiency gap between old and new EU members and the impact of exogenous (out of managerial control) and endogenous (under the control of management) factors upon it. For this purpose we attempt to separate these two types of effects by controlling for home bias. Two types of efficiency indicators are derived: so-called X-efficiency and alternative profit-efficiency. X-efficiency gives a measure of how managers are able to minimise cost and thus maximise profit by input allocation and exploration of technological opportunities alongside given output and input prices. Alternative profit-efficiency is measured by how managers are able to maximise profit if the output price is not given. We empirically confirm that the results produced from the measurement of cost- and profit-efficiency, as well as the conclusions, vary to a major degree depending on whether exogenous factors, i.e. operational characteristics, are controlled or not.
1
The full paper is available on the webpage of Magyar Nemzeti Bank (www.mnb.hu). The authors assume sole responsibility for the remaining errors.
2
Corresponding author. Email:
[email protected].
BIS Papers No 28
217
Our study underlines the importance of accounting for heterogeneity in operational environment. Due to profit-maximisation, only managerial ability in efficiency improvement is of particular relevance from the point of view of financial stability. Due to high profitability led by an insufficient level of competition or other market distortions, management may not pay enough attention to cost rationalisation or cost reduction, i.e. cost-efficiency improvement. 3 Yet this involves risk. Only “conscious” efficiency improvement can permanently contribute to banks’ income generating capability, since in the long term, as a consequence of the Unified European Banking Market, the efficiency differences caused by market distortions will probably disappear. The improvement of banking efficiency may have not only stability- but also welfare-related implications. Due to the “efficiency surplus” an efficiently operating banking sector can charge on average lower credit and higher deposit rates compared to a less efficient banking system. Owing to the important financing role of the banking sector in the economy, a narrowing net interest margin enhances investment activity and stimulates economic growth. Furthermore, it also contributes to an increase in consumer surplus, as lower credit rates entail a decreasing debt service burden and higher deposit rates trigger rising financial wealth. The study is organised as follows: Section 2 overviews the empirical literature on efficiency measurement; Section 3 describes the framework of our empirical investigation as well as the results; finally, Section 4 summarises and concludes.
2.
Overview of bank efficiency studies
The roots of efficiency research originate from the institutional approach of corporate microeconomics. The measurement of efficiency was therefore initially performed in relation to the various industrial sectors of the real economy. In the past 15 to 20 years, the focus has shifted to the financial sector, with an emphasis on researching the efficiency of banks. The research into efficiency serves the purpose of estimating the so-called “efficient frontier” and analysing deviations from such frontier corresponding to the loss of efficiency. The methods are distinguished on the basis of the procedures applied to produce the frontier, and the assumptions made, for example, in relation to the distribution of the inefficiency term. The creation of the “efficient frontier” serves the purpose of distinguishing well performing (efficiently operating) production units from the group of poor performers. In the literature two major concepts are frequently used in generating this frontier: non-parametric and parametric approaches. The non-parametric methods first proposed by Farrell (1957) select efficient production units in order to create the “efficient production frontier”. The procedure was first applied by Charnes et al. (1978), 4 who used linear programming techniques (DEA - Data Envelopment Analysis). Parametric methods are considered to be more sophisticated compared to non-parametric techniques, whereby the estimation of efficiency is based on economic optimalisation, given the underlying assumption of a stochastic optimal frontier. Parametric methods are capable of incorporating both input allocative and technical efficiencies. The two most frequently used parametric techniques are the Stochastic Frontier Approach (SFA) and the Distribution Free Approach (DFA). The SFA was independently developed by Aigner et al. (1977) and Meeusen and van den Broeck (1977). It attempts to decompose the residual of the frontier into inefficiency and noise by making explicit assumptions about the inefficiency component’s distribution. The DFA of Schmidt and Sickles (1984) and Berger (1993) is based on similar logic, though distinguished from the former method by not applying assumptions as to the distribution of the inefficiency component. Most of the publications covering the theme study the banking system of the USA. Relatively few European studies have been published on efficiency, and the analysis of the financial systems of
3
This is suggested by the “Quiet life” hypothesis.
4
DEA is a non-parametric method for calculating relative efficiency scores in a multi input-output production environment. It measures the performance of all decision-making units compared to the generated efficient frontier. Best-practice banks, which construct the DEA frontier, produce given output combinations with the lowest level of inputs or achieve the highest level of output with a given level of inputs, i.e. operate with an optimal input-output combination. Firms which do not operate on the optimal frontier suffer a certain level of efficiency loss.
218
BIS Papers No 28
transition economies from an efficiency point of view has been very limited. 5 Comparative research analysing the efficiency of banking systems in different countries is also very scarce, possibly owing to the difficulty of managing problems arising from different operational environments and their impact on efficiency. The table below provides a brief overview of the literature. 6
Authors
Result1
Methodology USA
Sinan and Register (1989) USA
Stochastic/parametric; SFA
(1983) average X-inefficiency: 23%
Ferrier and Lovell (1990) USA
Stochastic/parametric; SFA
(1984) average X-inefficiency: 26%;
Deterministic/non-parametric; DEA
average technological inefficiency: 21%
Aly et al. (1990) USA
Deterministic/non-parametric; DEA
(1986) average technological inefficiency: 35%
Kaparakis et al. (1994) USA
Stochastic/parametric; SFA
(1986) average X-inefficiency: 12%
Berger (1995) USA
Stochastic/parametric; DFA
(1980-1989) average X-inefficiency: 39%
Berger and Mester (1997) USA
Stochastic/parametric; DFA
(1990-1995) average X-inefficiency: 13%; average profit-inefficiency: 9%
Developed European Countries Berg (1992) NO
Deterministic/non-parametric; DEA
(1984-1990) average technological inefficiency: 44%
Lang and Welzel (1996) DE
Deterministic/non-parametric; DEA
(1989-1992) average technological inefficiency: 43%
Bos and Kool (2001) NL
Stochastic/parametric; SFA
(1992-1998) average X-inefficiency: 26%; average profit-inefficiency: 44%
Koetter (2004) DE
Stochastic/parametric; SFA
(1994-2001) average X-inefficiency: 9-27%
Among old EU member states Allen and Rai (1996) AT, BE, DE, DK, FI, FR, GB, IT, SW
Stochastic/parametric; SFA; DFA
(1988-1992) average X-inefficiency: 20%
Bikker (1999) BE, DE, FR, IT, LU, NL, ES, UK
Stochastic/parametric; SFA
(1989-1999) average X-inefficiency: 53%
Dietsch and Weill (2000) DE, FR, IT
Stochastic/parametric; SFA; DFA
(1993-1997) average X-inefficiency: 16%; average profit-inefficiency: 17%
5
As emphasised by Berger and Humphrey (1997), of the 122 efficiency studies, encompassing 21 countries, only roughly 5% study transition economies.
6
In the table, transition economies in Europe comprise a separate category, irrespective of the geographical location of the country.
BIS Papers No 28
219
Authors
Result1
Methodology Among old EU member states (cont)
Lozano-Vivas et al. (2001) AT, BE, DE, DK, FI, FR, GB, IT, LU, PT
Deterministic/non-parametric; DEA
(1993) average technological inefficiency: 34%
Bikker (2002) AT, BE, DE, DK, FI, FR, GB, GR, IE, IT, LU, NL, PT, ES, SE
Stochastic/parametric; SFA
(1990-1997) average X-inefficiency: 30%
Weil (2004) AT, BE, DE, DK, FI, FR, GB, GR, IT, LU, PT, ES
Stochastic/parametric; SFA; DFA
(1994, 2000) average X-inefficiency: 35%
Transition Economies Tóth (1999) HU
Deterministic/non-parametric; DEA
(1996-1997) average technological inefficiency: 40%
Kasman (2002) TR
Stochastic/parametric; SFA
(1988-1998) average X-inefficiency: 25%
Hasan and Marton (2000) HU
Stochastic/parametric; SFA
(1993-1997) average X-inefficiency: 25%; average profit-inefficiency: 30%
Among Transition Economies Yildirim and Philippatos (2002) BU, CZ, CRO, EE, HU, KAZ, LV, LT, MAC, PL, RO, RUS, UCK, SI, SK
Stochastic/parametric; SFA; DFA
Grigorian and Manole (2002) ARM, BEL, BU, CRO, CZ, EE, HU, KAZ, LV, LT, MO, PL, RO, RUS, SI, SK, UKR
Deterministic/non-parametric; DEA
(1993-2000) average X-inefficiency: 24%; 36%; average profit-inefficiency: 38%; 54% (1995-1998) average technological inefficiency: 47%
Among Transition and Developed Economies Kosak and Zajc (2004) AT, BE, CY, CZ, DE, EE, HU, IT, LT, LV, MT , NL, PL, SI, SK
Stochastic/parametric; SFA
(1996-2003) average X-inefficiency: 16.7%
Tomova (2005) BU, CRO, CZ, EE, FR, HU, PL, PT, RO, ES, SI, SK
Deterministic/non-parametric; DEA
(1993-2002) average technological inefficiency: 55%
Notes: USA (United States of America), EU (European Union), ARM (Armenia), AT (Austria), CRO (Croatia), CY (Cyprus), CZ (Czech Republic), BE (Belgium), BEL (Byelorussia), BU (Bulgaria), DE (Germany), DK (Denmark), EE (Estonia), ES (Spain), FI (Finland), FR (France), GB (Great Britain), GR (Greece), HU (Hungary), IE (Ireland), IT (Italy), KAZ (Kazakhstan), LT (Latvia), LU (Luxemburg), LV (Lithuania), MAC (Macedonia), MO (Moldova), MT (Malta), NL (the Netherlands), NO (Norway), PL (Poland), PT (Portugal) RO (Romania), RUS (Russia), SE (Sweden), SI (Slovenia), SK (Slovakia), TR (Turkey), UKR (Ukraine). 1
The inefficiency is measured on a scale from 0 (or 0%) to 1 (or 100%). Best performing bank has inefficiency score of 0 (or 0%) and efficiency score of 1 (or 100%). DEA: Data Envelopment Analysis; SFA: Stochastic Frontier Approach; DFA: Distribution Free Approach.
3.
Empirical analysis
In the empirical analysis we first compare the operational environment of EU banking systems, then define variables used in the econometric model; after this, we describe the main characteristics of the sample. Finally, we review our empirical results.
220
BIS Papers No 28
3.1
European Union wide comparison of banking systems’ operational environment
The enlargement of the EU substantially increased heterogeneity among member countries’ banking systems. As a consequence of the common economic convergence path and regulatory harmonisation imposed by the “Acquis Communautaire” the integration of the newcomers’ banking systems has strengthened over the last decade. However, in terms of macroeconomic and regulatory environment, depth of financial intermediation and market structure several differences across EU member countries still persist. Since the characteristics of a financial system’s operational environment - often shaped independently of the “conscious” behaviour of management - may have an impact on the results and conclusions of efficiency measurement, an investigation of the main causes of home bias is required. 3.1.1
Macroeconomic environment
The EU member countries have entrenched macroeconomic stability over the last decade. The majority of old member states fulfilled nominal convergence, the Maastricht criteria, and introduced the common currency, the euro, in 1999. In eight of the ten new member countries the transition from a centrally planned to a market-based economic regime and the rapid economic growth accompanying it opened the way for real convergence with the EU and nominal convergence with the five pillars of euro standards (price and exchange rate stability, fiscal balance, low general government debt, convergence of long-term interest rates). However, despite the rapid catching-up process, major economic differences remain, particularly between old and new member states. Regarding the real economic convergence it should be noted that although in the new member countries economic and productivity growth far exceeds that of the old members, the level of development still falls behind. The average level of new members’ development measured with GDP per capita in PPP terms is approximately two thirds that of old ones. Only the Czech Republic, Cyprus, Malta and Slovenia pass this level. Chart 1 Distance of economic development and inflation from the EU-25 average denoted in percentages 2003 %
%
150
900
100
600
50
300
0
0
PPP based GDP per capita (left hand scale)
EU-10
EU-15
SK
EU-25
SI
SE
PL
PT
NL
MT
LV
LU
IT
LT
IE
HU
GB
GR
FI
FR
ES
EE
DE
DK
CZ
-600 CY
-100 BE
-300 AT
-50
Consumer inflation (right hand scale)
Note: EU-15 encompasses old EU members, while EU-10 denotes new EU members. Source: Eurostat.
With respect to the nominal convergence it should be highlighted that, prior to the introduction of the euro, the inflation of old member countries had dropped sharply and reached the level of price stability. Furthermore, over the transition period sound macroeconomic and structural policies succeeded in lowering inflation in the new member countries as well. Thus, at an aggregated level the gap between the average pace of inflation in old and new member states has substantially narrowed. However, the inflationary dispersion between member countries remains virtually unchanged in relative terms. Regarding the old members the dispersion is mainly caused by existing differences in economic
BIS Papers No 28
221
openness and competitiveness. As for the newcomers, the high relative standard deviation of inflation is explained by the fact that only six out of the ten countries (i.e. excepting Cyprus, Hungary, Slovakia and Slovenia) achieved price stability as imposed by the Maastricht criteria as early as 2003. The common monetary policy has decreased the dispersion of interest rates across euro-area countries and led to higher price homogeneity. In relation to long-term interest rates, all new EU member states have fulfilled the convergence criteria, with the exception of Hungary. In the case of short-term interest rates, however, high variability across newcomers can still be observed due to the differences in inflation rates as well as risk premiums influenced by fiscal balance and exchange rate fluctuations. The majority of EU countries comply with the threshold for the budget deficit and public debt ratio. In some larger old member states (Germany, France) and in half of the new member countries (Czech Republic, Hungary, Malta, Poland and Slovakia), however, a deterioration in the fiscal balance can be observed. For the old members the Stability and Growth Pact, and in the case of new members the required introduction of the euro, may curb further fiscal divergence. 3.1.2
Regulatory environment
After the 1980s the EU financial sector underwent considerable changes due to several waves of liberalisation (free flow of capital) and deregulation (establishment, activity and liquidation of credit institutions). Following the European Commission’s White Paper (1986), the Second European Directive (1989) with the two parallel Directives on Solvency Ratios and Own Funds, the introduction of the Single European Licence (1993) and the Financial Service Action Plan (1999), the convergence 7 of regulatory systems was considerably accelerated. Since the new EU members already complied with the most important European directives, the EU enlargement slowed down but did not suspend the continuous harmonisation of financial regulations and the creation of a suitable supervisory architecture. 8 It is essential to highlight that, although accomplishment of the majority of European directives has eased heterogeneity in regulation and standards in recent years, some differences still persist. The stringency of regulation shows significant dispersion among EU countries, reflecting the variety of domestic financial markets, legislations and supervisory practices. 9 In addition, within financial regulation but above the directives, i.e. over the level of minimum standards, notable differences can be observed as well. Mention can be made here of consumer protection schemes, safeguarding of minority shareholders’ interests, corporate governance, stimulation of disclosure, competition and efficiency improvement. 3.1.3
The depth of financial intermediation
Among the major factors linked to the operational environment, the largest differences among EU member states arise in relation to financial intermediation. The average total loans to GDP ratio of new members (36%) is less than one third of the rate of old members (125%).
7
In the future the largest challenges for the EU are linked to the harmonisation of different regulations concerning mortgage lending, fund management, financial advisory services, money laundering and insurance as well as the implementation of Basel II and, in the case of new members, the adoption of the euro.
8
However, several EU countries are yet to fully adopt common guidelines regarding credit cooperations and deposit insurance schemes. In addition, some new member states must proceed with harmonisation with European directives on regulation-related capital adequacy, operation of branches and subsidiaries, and bankruptcy laws.
9
Cervalatti (2003) investigates this issue in detail.
222
BIS Papers No 28
Chart 2 Banks’ lending to the private sector as a percentage of GDP in the member countries 2003 % 200 180 160 140 120 100 80 60 40 20
LT
PL
CZ
SK
EE
LV
EU-10
SL
HU
FI
IT
GR
FR
EU-25
BE
SE
ES
ML
EU-15
CY
AT
UK
DE
PT
DK
IE
NL
0
Note: Luxembourg was not represented in Chart 2 as in this country the private sector loans to GDP ratio is very high, above 500%. Source: ECB: Report on EU Banking Structure (November 2004).
In terms of the level and the development of financial intermediation, new members can be divided into three well definable groups. The GDP-proportionate level of loans provided by the banking system to the private sector in Cyprus and Malta had reached the average rate of old EU member states as early as 2001. The rapid growth of the banks’ economic role in these two countries is attributed to the early wave of privatisation, accelerated financial liberalisation and the stable growth rate of the economy. The second group includes the Czech Republic and Slovakia, where the depth of financial intermediation approximated the minimum level of old member states (60%) as early as 1998 due to intense financing of state-owned enterprises and early capital liberalisation. Nevertheless, private sector loans to GDP was roughly halved by 2003 (30%) due to, firstly, considerable portfolio-cleaning and tightening regulation, and secondly, the strong knock-out effect of the budgetary sector. In the third group can be ranged the Baltic countries (Estonia, Lithuania 10 and Latvia), Poland, Hungary and Slovenia, where financial intermediation has constantly gained depth only since 1999. However, despite the upward trend, the lag of these countries relative to the old members’ average has not diminished measurably. The low depth of financial intermediation witnessed in the majority of new EU members is linked to numerous common factors. The Central-Eastern European countries and the Baltic States suffered from renewed recession and experienced output loss during the transition from socialist to market economy, which weakened loan demand and also supply through the increasing level of nonperforming exposure. In the stabilisation phase following the macroeconomic and bank crises, the privatisation and recapitalisation of banks and the establishment of an adequate and essential regulatory architecture consumed several years. The low depth of financial intermediation may also be explained by the fact that the banking sector is competing on the international corporate financing market, linked to the predominant role of foreign-owned multinational corporations. Furthermore, another feature of banking markets which needs to be addressed is accelerating disintermediation. Banks’ intermediation on the liability side is gradually decreasing, owing to the increasing role of nonbank financial intermediation. Falling bank interest rates and the development of financial culture are resulting in growing proliferation of non-bank forms of savings.
10
The depth of financial intermediation is the lowest in Lithuania, due - over and above the common factors - to numerous bank crises.
BIS Papers No 28
223
Finally it should be stressed that a strong discrepancy in the depth of banking intermediation can also be observed among the old EU members. The private sector loans to GDP ratio is lower in Finland, Greece and France, and higher in the Netherlands, Ireland, Denmark, Portugal and Germany compared to the average. The cross-sectional dispersion of financial depth is probably caused by the varying role assigned to the capital market in financing, the dissimilar stringency of regulation and other country-specific characteristics. 3.1.4
Market concentration
As a result of the consolidation process, the new EU member states have not only succeeded in narrowing the gap between themselves and old member states in economic and regulatory areas and in financial intermediation, but also in relation to market structure. Even so, considerable differences in market concentration still persist across the member states. In the new member states, following the creation of a two-tier banking system the privatisation and recapitalisation of state-owned banks as well as several new entries fostered the break-up of the initial monopolistic market structure. Greater competition and the dominant degree of foreign ownership 11 encouraged the implementation of best practices (advanced risk management, corporate governance techniques and accounting methods) and the transfer of know-how and well educated labour forces enhanced productivity gains and integration. 12 In the second half of the 1990s, mergers and acquisitions as well as numerous bank liquidations suspended the falling concentration of the banking system and stabilised the oligopolistic market structure. Chart 3 The concentration of banking systems in the EU 2003 % 120
100
80
60
40
20
DE
IT
LU
GB
IE
ES
AT
FR
PL
HU
SE
PT
LT
CZ
GR
DK
SI
SK
FI
LV
ML
BE
NL
CY
EE
0
Note: Concentration is defined as the sum of the five largest banks’ market share in terms of total assets. Source: ECB: Report on EU Banking Structure (November 2004).
By comparing the sum of the five largest banks’ market share in terms of total assets, only Poland and Hungary among the newcomers have market concentration as low as that of the old member states’ average owing to the relatively large size of their banking systems. 13 Mainly due to the small market
11
Among the new members the degree of foreign involvement can be considered low (36%) only in the Slovenian banking sector. Among the rest of the new EU members, 50-99% of the banking sector is in foreign hands.
12
The effect on efficiency of the connection between parent banks and subsidiaries can be regarded as a very important feature. This could be a theme for future research.
13
In large countries more banks may be able to reach the adequate scale, while in small markets fewer banks may achieve the optimal scale of production.
224
BIS Papers No 28
size and an inherited distorted market structure, the rest of the new EU member countries have banking sectors characterised by strong concentration (the sum of the five largest banks’ market share spreads between 63% and 100%). The market structure of old EU member states is also undergoing transformation. Contrary to trends in the group of new EU member countries, the average concentration in old member states is at a relatively low level. However, it has constantly edged higher in recent years, in parallel with an increasing number of mergers and acquisitions aimed at boosting market power and/or improving efficiency. Nevertheless, the concentration of the old members’ banking sectors remains relatively low, while dispersion (concentration ranges from 22% to 84%), which is closely related to the significant differences in market size, still exceeds that of the new members.
3.2
Sample and variables
When selecting variables the first difficulty is posed by the definition of costs, input prices and outputs, i.e. the components of bank production. In the related literature two concepts have been adopted: the “intermediation approach” and the “production approach”. The intermediation approach considers banks’ deposits as inputs in the production process. Contrary to the above, the production approach claims that deposits and various bank liabilities are also outputs. 14 In our study following Sealey and Lindley (1977), we employ the intermediation approach. We suppose a multi-output production model. In our model, the firms produce three outputs with three inputs. The outputs are defined as loans, 15 other earning assets and non interest revenues, while the inputs are defined as labour, physical capital and borrowed funds. As data on the number of employees are not available, labour cost for every bank is measured by the ratio of personnel expenses to total assets. 16 The price of physical capital is approximated by the ratio of the difference of non-interest and personnel expenses to fixed assets. The price of borrowed funds of a certain bank is equal to the average of the cost of funds paid by the remaining banks in the same country. Cost of funds corresponds to the ratio of interest expenses to interest-bearing liabilities. 17 The total cost is defined as the sum of interest paid, noninterest expenses, and personnel expenses for every bank. We use pre-tax profit for the estimation of the profit frontier. In addition to the selection of output and input variables, the other major challenge is linked to the selection of the auxiliary variable serving to reduce the heterogeneity arising between countries and banks. The application of a Fourier-flexible functional form can moderate the heterogeneity related to size. 18 For the purpose of further reducing the distorting effect of varying size and other operational bias (macro and regulatory environment, market structure), the use of environmental variables, such as inflation, depth of financial intermediation, market concentration, level of liberalisation and banking reform is also warranted. 19 The first equation (uncontrolled model) only contains the input and output
14
A lesser known, but interesting aspect of the literature is the user cost approach. It is based on the following premise: the net income generating capability of a monetary instrument determines whether it is an input or an output in the production process. According to Hancock (1991) if the financial returns on an asset exceed the opportunity cost of funds, the given instrument is deemed to be a financial output; otherwise, it corresponds to input. The problem with this approach is that interest rates and user costs fluctuate over time. It is possible that an item which is deemed to be an input in a given period may correspond to output in another period.
15
The database does not enable us to separate loans into categories.
16
We assume that unit labour cost is exogenous to the banks’ behaviour. The ratio of personnel expenses and the number of employees does not take the productivity of the labour force into account.
17
We attempt to measure exogenous deposit prices. Koetter (2004) finds that average cost-efficiency is sensitive to endogenous or exogenous specifications for input prices.
18
It is not unambiguous that in all cases the size differences bias the measurement of efficiency. A large bank compared to a small or medium sized firm might be more scale-efficient, and may attract higher qualified management. At the same time, managing a larger firm is a more complex task. The counter-effects may “extinguish” each other.
19
Due to the strong correlation (0.8) between levels of development and depth of financial intermediation PPP based GDP per capita was not used in cost and profit function as a control variable.
BIS Papers No 28
225
variables and trigonometric terms, while the second alternative equation (controlled model) is expanded with selected country-specific variables. 20,21
3.3
Data description
Data are taken from Bankscope 22 and cover 2459 banks from the 25 member states of the EU. Our sample includes commercial, cooperative and saving banks. We attempted to establish our database from unconsolidated data; if this was not possible we collected consolidated data. Banks whose dependent or independent variables were not available were removed from the sample. The period of observations extends from 1999 up to 2003 on account of data quality. The descriptive statistics, attached as an annex, clearly indicate that, according to the number of banks and asset size, the coverage of banking systems in the new and old member states is different. In the old member states large banks are overrepresented and small banks are underrepresented. Our sample contains 20-50% of operating banks in the old EU member states; nevertheless, the coverage of the banking system according to total assets is between 70% and 90%. Sweden and England comprise an exception, enabling coverage of only 40-50% due to insufficient data. Conclusions drawn in relation to these countries should be interpreted with caution. With regard to the new EU member states, the banking systems are well represented with respect to both bank number and balance sheet total.
3.4
Estimation results
23 The SFA is applied. We compute relative efficiency scores from the “controlled” and “uncontrolled” 24 models for every year under investigation, assuming exponential distribution of X- and alternative profit-inefficiency components.
3.4.1
Efficiency scores
We first estimate X-efficiency scores of the individual banks generated by the “uncontrolled” model, then compose the average efficiency for the various member states as well as for the old and new member countries and for the whole EU. Table 1 presents results which indicate that over the investigated period the banking systems of the EU witnessed an average, moderate rise in X-efficiency. Our result confirms the existence of an efficiency gap between the two regions in favour of old members. 25 In the old EU member states, a stagnation in efficiency on a high level can be experienced, while in the new member states there has been a rapid catching-up process from a relatively low level. In the period examined, the efficiency gap between the two regions experienced a sharp fall from 23 percentage points in 1999 to 15 percentage points in 2003. The mean efficiency of the whole EU and of the old and new member states amounted to 85%, 86% and 67% respectively.
20
In the basic equation the number of input and output variables and cross products is 20, the number of trigonometric terms is 18. In the expanded equation a further 5 parameters are estimated (parameters of inflation, depth of financial intermediation, market concentration, level of liberalisation and banking reform).
21
If independently of the operational environment the banks’ main aim is to reach the lowest cost and highest profit function as soon as possible, then in the case of using proper control variables the efficiency scores measure only managerial ability. However, if banks have other strategic aims, such as a short-term profit target, we can only partially capture exogenous effects as we cannot control for the extent of pressure on efficiency improvement explained by operational environment. Overall, in the latter case we can only capture the direct and miss the indirect effects of operational environment on efficiency.
22
Bureu van Dijk (2004).
23
Efficiency scores are between 0 (or 0%) and 1 (or 100%). Bank without inefficiency term has efficiency score of 1 (or 100%).
24
We used the Maximum Likelihood method to solve the parameters.
25
Earlier Kosak and Zajc (2004) supported the existence of an efficiency gap between the group of selected Western and Eastern European countries.
226
BIS Papers No 28
Table 1 also lists the results obtained from an alternative model, in which some “exogenous effects” that can influence costs were controlled. The mean efficiency scores of the enlarged EU and old member states exhibit stability over time. It is noteworthy, however, that in 1999, the old and particularly the new members “started” from a higher efficiency level in comparison to the previous model. The efficiency gap between the old and new member states fell from 10 percentage points in 1999 to 7 percentage points in 2003, in contrast to the previous model. In the investigated period the mean efficiency scores amounted to 89% in the EU as a whole, 90% in the old member states and 82% in the new EU countries. The banking system of the EU has still room for improvement, as it could produce the same level of output with, ceteris paribus, 12.4% lower costs or, equivalently, with the same level of cost it could produce more output. Annual cost surplus for the entire EU corresponds to 0.7% of aggregate GDP. This measure can be also interpreted as welfare loss. Table 1 Average X-efficiency scores among EU regions and the EU 1999-2003
X-efficiency uncontrolled 2001 2002 0.84 0.85 0.85 0.86 0.67 0.69
EU-25 EU-15 EU-10
1999 0.85 0.87 0.64
2000 0.84 0.85 0.65
Efficiency gap
0.23
0.20
0.18
2003 0.86 0.87 0.72
Average 0.85 0.86 0.67
0.17
0.15
0.19
2003 0.90 0.90 0.83
Average 0.89 0.90 0.82
0.07
0.08
EU-25 EU-15 EU-10
1999 0.90 0.91 0.81
2000 0.90 0.91 0.82
controlled 2001 2002 0.88 0.88 0.88 0.88 0.80 0.80
Efficiency gap
0.10
0.08
0.08
0.08
The conclusions drawn from the controlled and uncontrolled model reveal consistency in the sense that narrowing of the X-efficiency gap is observed in both cases. Nevertheless, the size of efficiency gap is smaller in the controlled than in the uncontrolled case. The models of the estimated alternative profit function fully correspond to the cost functions estimated in relation to X-efficiency, with the difference that in this case the dependent variable of our models is pre-tax profit. Table 2 shows that the average profit-efficiency scores of old and new member country groups seem to be very close to each other. Therefore, the efficiency gap is consequently very small in a five year average. An interesting result was produced with regard to the uncontrolled model; the efficiency advantage of old member states was not evident in the period of 1999-2001. New member states appeared slightly more profit-efficient in all years. The profit-efficiency of the EU and sub-regions averaged at around 69-70% in the investigated period. It is interesting to note that, in the controlled case as with the estimation of X-efficiency, a profitefficiency gap in favour of the old member states emerges. Eliminating the home bias is likely to account for the difference between controlled and uncontrolled models. This efficiency gap between the two groups of countries slightly dropped in the period under review and averaged 4 percentage points. The average efficiency level of the EU as a whole amounted to 71% as old and new members totalled at 72% and 68% respectively. The mean score of the enlarged EU indicates an annual 40.8% loss in profit efficiency, which is equivalent to 0.5% of GDP. Comparing the empirical findings of X- and alternative profit-efficiency estimation, it can be stated that the value of rank-order correlation of 0.7 calculated on the results of the controlled model is
BIS Papers No 28
227
considered relatively strong. This means that, taking into account only managerial ability, the majority of X-efficient countries are also more profit-efficient and vice versa. 26 In the uncontrolled case, however, the counter-effects of domestic characteristics weakened rank-order correlation to -0.1. Table 2 Average profit-efficiency scores among EU regions and the EU 1999-2003
EU-25 EU-15 EU-10
1999 0.69 0.69 0.71
Profit-efficiency uncontrolled 2000 2001 2002 0.69 0.68 0.68 0.69 0.68 0.68 0.69 0.69 0.70
Efficiency gap
-0.02
-0.01
-0.01
-0.02
-0.03
-0.02
2003 0.72 0.72 0.70
Average 0.71 0.72 0.68
0.02
0.04
EU-25 EU-15 EU-10
1999 0.73 0.73 0.68
2000 0.72 0.72 0.69
controlled 2001 2002 0.71 0.69 0.71 0.70 0.67 0.67
Efficiency gap
0.05
0.03
0.04
0.03
2003 0.70 0.69 0.73
Average 0.69 0.69 0.70
Charts 4 and 5 give a graphical illustration of the relation between cost- and profit-efficiency. Scatter plots demonstrate the distances in X- and alternative profit-efficiency scores from the “benchmark” 27 states. The countries are sorted into the four quarters of the Cartesian plane. In the upper right part, X- and profit-efficient countries are classified. In the lower left quarter are those states that prove to be inefficient according to both indicators. The other two sections include only X- or only profit-efficient countries. Scatter plots provide evidence in support of our claim that distortion effects are of high importance. The standard deviation of efficiency scores is much lower in the controlled (Chart 5) than in the uncontrolled (Chart 4) case. In general, countries located in the upper right part are characterised by a sustainable financial position and strong income generating capacity. By contrast, the upper and lower left as well as the lower right parts represent unsustainable states from the perspective of banks’ long- term operation. X-inefficient but profit-efficient banking systems, which can be found in the upper left part of the scatter plot, may face two alternatives. By gaining a competitive edge on the X-efficiency and therefore the profit-efficiency side, banks can move to the right. If firms do not implement efficiency improvements, however, banking sectors shift into the lower left quarter as the continuous homogenisation of markets leads to the deterioration of profit-efficiency. With respect to countries lacking X-efficiency and 28 alternative profit-efficiency, a major restructuring of the banking sector is expected in the long term.
26
If we had perfectly controlled for market distortions the rank-order correlation of X- and alternative profit-efficiencies would have approached 1.
27
The construction of the scatter plots in Charts 4 and 5 is the following: we ranked countries in relation to both X-efficiency and alternative profit-efficiency. The “benchmark” country is the one in the middle (13). Those countries’ banking systems that were above this level were considered as efficient, otherwise inefficient. We subtracted the efficiency scores from this “benchmark” value and multiplied them with minus 1. The benchmark countries in the uncontrolled case were: Sweden and Italy; in the controlled case they were: Hungary and Luxemburg.
28
In the new member countries this may be of no relevance because of the presence of subsidiaries.
228
BIS Papers No 28
Chart 4 Cross-country comparison of X- and alternative profit-efficiency in the case of the uncontrolled model Average, 1999-2003
Note: On the horizontal/vertical axis, distances of X-/profit-efficiency from the “benchmark” are portrayed.
X-efficiency improvement allows banks to leave the lower left part of the scatter plot. More X-efficient firms are able to charge lower loan and higher deposit rates and thus produce more output as a function of demand and supply elasticity. Since X-efficiency improvement is accompanied by a profitefficiency gain, banks can jump directly into the upper right from the lower left quarter. Equally X-efficient but, due to market heterogeneity, less profit-efficient banks can be found in the lower right part of the Cartesian plane. In the long run, the effects of market distortions can be reduced or made to disappear, favouring the evaluation of perfect competition. Since, in a perfectly competitive case, firms are operating on the same X- and profit-efficiency level, relative efficiency scores are no longer of any relevance. Analysing Charts 4 and 5, we primarily focus on the new EU members. Chart 4 demonstrates that the majority of new member states are located to the left of the y axis. This means that these countries produce poor efficiency in relation to both indicators, or “just” X-efficiency. Banking systems operate X-inefficiently but profit-efficiently in the Cyprus, Hungary, Malta, Poland, Slovakia and Slovenia. Managerial inefficiencies in terms of cost and profit are found in Czech Republic, Latvia and Lithuania. A substantial restructuring can be seen in Chart 5; the results derive from models controlled in relation to the effects of distorting factors. Several countries which were previously located in the upper left quarter shift to the lower left section. This implies that should no measures be taken to improve X-efficiency in the majority of new member states, they may lose their apparent competitive edge on profit-efficiency as a result of the expected long-term elimination of the distorting factors, i.e. with the strengthening of Common European Banking Market.
BIS Papers No 28
229
Chart 5 Cross-country comparison of X- and alternative profit-efficiency in the case of the controlled model Average, 1999-2003
Note: On the horizontal/vertical axis, distances of X-/profit-efficiency from the “benchmark” are portrayed.
4.
Conclusions
In this paper, under a common best-practice frontier we estimated and ranked X- and alternative profitefficiency scores for banking systems of the 25 EU member states between 1999 and 2003. We focused on investigating the efficiency gap between old and new member states, and analysing the related trends. In the course of producing X-efficiency and alternative profit-efficiency scores we applied Fourier-flexible cost function. Inefficiency components were modelled by the stochastic frontier approach. Our results led us to the conclusion that controls for distorting factors (macroeconomic environment, depth of financial intermediation, market structure, regulatory regime and other country-specific factors) originating from the operational environment or the absence of such controls may modify results. When evaluating banks, we accordingly assign importance to the distinction and assessment of impacts on performance deriving from managerial ability and external environment. Independently of the consideration of home bias our empirical findings provide evidence about the existence of an X-efficiency gap, as well as suggesting that the competitive edge of old EU members in relation to cost-efficiency is decreasing over time. Controls (or lack thereof) for distorting factors particularly for inflation, the level of development, the closely linked depth of financial intermediation and the regulatory architecture - reduce (or increase) the size of the actual gap between the old and new member states. As for estimating alternative profit-efficiency, a gap is also detected between the old and new member states between 1999 and 2003, but only if the impact of home market conditions on profitability is controlled. If factors originating from the operational environment are controlled, significant differences in profit-efficiency between the two regions no longer exist. Our results suggest that, with regard to several new member states, concentrated market structure is likely to allow banks to price the cost of
230
BIS Papers No 28
inefficient operation into interest rates and beyond that to earn oligopolistic rents. In these countries non-competitive pricing may have negative welfare consequences, since deadweight loss and a fall in consumer surplus may prevent an upturn in savings and investment activity, and thereby the achievement of higher economic growth. Looking ahead, it should be highlighted that the unbiased X-efficiency gap may produce an adverse impact on the long-term competitiveness of financial systems in new EU member states. The X-efficiency gap may be narrowed through the higher “internal efficiency reserves” of banks in new EU member states compared to old ones, i.e. from a lower efficiency level, banks in new member countries have larger room for improvement. There is the risk, however, that the absence of competitive pressures may result in a lesser effort on the part of managers to minimise costs. Cost minimising pressure may be further weakened by the fact that banks of less developed countries also have high “external efficiency reserves”, for the gradual development and integration of the economy through the deepening of financial intermediation results in a “natural” efficiency gain. It is also a discouraging factor that the “conscious” improvement of efficiency involves higher expenditures in the short term and produces the desired impact only in the long term. Advantages and disadvantages associated with specific market characteristics in old and new member states are expected to ease as a result of the further integration of financial markets and the financial institutional systems within the EU. Consequently, managerial ability will gain even higher relevance in determining efficiency. Information regarding the bank efficiency in the EU is of high relevance, as it enables policy-makers to understand deficiencies of banking operation and prioritise areas for action. Our findings stress the prime importance of policy response to enhance the efficient operation of banking systems and thereby achieve welfare gains. In the lack of pressure on efficiency improvement the cost of financial intermediation can remain relatively high particularly in the new member states which can be a drag on the evaluation of an flexible and resilient economy.
BIS Papers No 28
231
Appendix 1: Fourier-flexible functional form Our estimate of the Fourier-flexible cost and alternative profit function is as follows: 29 ⎛w ⎞ ⎛w ⎞ ⎛w ⎞ 1 ⎛ π ⎞ ⎛ TC ⎞ 1 ln⎜⎜ ⎟⎟; ln⎜⎜ ⎟⎟ = β0 + ∑ αm ln ym + ∑ βn ln⎜⎜ n ⎟⎟ + ∑∑ αmp ln ym ln y p + ∑∑ βnr ln⎜⎜ n ⎟⎟ ln⎜⎜ r ⎟⎟ + 2 n r m n ⎝ w3 ⎠ ⎝ w3 ⎠ ⎝ w3 ⎠ 2 m p (1) ⎝ w3 ⎠ ⎝ w3 ⎠ ⎛w ⎞ + ∑∑ γnm ln⎜⎜ n ⎟⎟ ln ym + ∑ [δm coszm + θm sinzm ] + ∑∑ δmp cos(zm + zp ) + θmp sin(zm + zp ) + v ± u n m m m p ⎝ w3 ⎠
[
]
where TC corresponds to total cost, π is the pre-tax profit , ym is the mth output (m=1, 2, 3), wn is the nth input price (n=1, 2, 3), w3 is the price of financial input, ε is the residual (p, r equal to 1, 2, 3 based on the number of outputs and inputs). ε =v±u, where ε is the residual, v is the two-sided random noise and u is the non-negative inefficiency component. Indices applied to banks have been omitted for the purpose of simplification. Symmetry and linear homogeneity require the following parameter restrictions: 3
3
3
n =1
r =1
n =1
(2). α mp = α pm , β nr = β rn , ∑ β n = 1, ∑ β nr = 0, ∑ γ nm = 0 For the application of the Fourier-flexible form the scaling of data is also necessary. Normalisation of bank outputs shows the following formula: (3) z m = 0.2π + (1.6π)
29
ln y m − ln y m,min ln y m,max − ln y m,min
The alternative profit function is unique in the sense that its explanatory variables correspond to its cost function; its dependent variable, however, corresponds to profit. Since profit may not be a negative value, it may cause problems in relation to logarithmisation. The problem may be remedied by adding a constant to each profit value, which is at least as high as the highest loss in the sample.
232
BIS Papers No 28
BIS Papers No 28
Appendix 2: Descriptive statistics
Number Total assets
Total assets
Loans
Other earning assets
of banks
Aver. (M.)
Aver. (M.)
Rel. stdev
Aver. (M.)
Rel. stdev
AT
111
460146.1
4145.5
0.3
1993.5
0.3
1843.9
BE
44
845732.8
19221.2
0.2
7780.4
0.2
CY
16
27569.2
1819.9
0.4
934.2
CZ
22
59893.1
2807.4
0.3
1033.5
DE
1080
3267259.2
3025.2
0.2
DK
67
222817.6
3325.6
EE
6
3608.5
ES
108
FI
6
FR
Wage costs
Aver. (M.) Rel. stdev Aver.
Price of fixed capital
Price of int.-b. liabilities
Total costs
Pre-tax profit
Non interest revenues
Rel. stdev
Aver.
Rel. stdev
Aver.
Rel. stdev
Aver. (M.)
Rel. stdev
Aver. (M.)
Rel. stdev
Aver. (M.)
0.3 0.009
0.13
1.338
0.2
0.071
0.3
222.1
0.2
17.0
0.5
128.4
Rel. stdev 0.9
10184.1
0.2 0.008
0.10
1.070
0.0
0.010
0.3
1034.9
0.2
123.6
0.3
574.6
0.0
0.3
807.3
0.5 0.014
0.08
0.854
0.2
0.112
0.3
128.6
0.3
24.2
1.2
61.9
0.6
0.4
1465.6
0.4 0.012
0.09
1.417
0.6
0.180
0.4
238.3
0.5
-1.9
-4.0
104.9
0.0
1492.7
0.2
1420.9
0.3 0.007
0.07
2.810
0.2
0.072
0.2
180.0
0.2
10.4
1.1
45.4
1.1
0.3
1484.4
0.3
1528.7
0.4 0.008
0.10
2.100
0.1
0.064
0.3
156.5
0.2
32.5
0.4
103.0
0.2
605.2
0.4
354.0
0.5
208.2
0.5 0.010
0.11
1.650
0.2
0.133
0.4
42.1
0.3
13.7
1.0
17.0
0.2
1183427.9
10962.2
0.2
5967.2
0.3
3725.9
0.2 0.013
0.09
1.155
0.2
0.101
0.3
611.6
0.2
115.9
0.3
327.3
0.3
200244.6
33374.1
0.3
20333.7
0.4
9428.7
0.3 0.008
0.35
1.230
0.8
0.112
0.3
1537.6
0.3
355.6
0.3
1339.0
0.0
208
3045919.6
14643.8
0.2
5094.0
0.2
8238.1
0.3 0.007
0.07
1.500
0.1
0.041
0.2
960.5
0.2
68.8
0.6
263.6
0.9
GB
50
1975420.2
39508.4
0.3
20213.8
0.4
14869.5
0.4 0.011
0.09
0.936
0.1
0.039
0.3
2097.0
0.3
451.3
0.4
790.2
0.0
GR
16
93594.5
5925.8
0.4
2916.2
0.5
2622.2
0.3 0.015
0.07
0.781
0.1
0.113
0.5
404.0
0.3
90.5
0.7
232.0
0.0
HU
23
29129.8
1268.9
0.3
633.1
0.5
531.4
0.2 0.014
0.09
2.300
0.2
0.135
0.3
131.2
0.3
20.5
0.6
56.6
0.1
IE
21
318523.5
19712.0
0.2
8969.8
0.4
7799.0
0.3 0.010
0.28
0.605
1.0
0.080
0.3
916.8
0.3
137.5
0.5
601.7
0.0
IT
459
1520534.9
3312.7
0.2
1788.9
0.3
1171.4
0.3 0.013
0.02
1.226
0.1
0.059
0.2
206.3
0.2
26.7
0.6
49.7
0.8 0.3
LT
9
3312.1
368.0
0.5
169.1
0.6
122.0
0.5 0.019
0.22
0.608
0.3
0.150
0.5
27.8
0.3
2.7
1.7
19.7
LU
70
423150.7
6045.0
0.2
1384.6
0.3
4453.3
0.2 0.003
0.02
0.897
0.1
0.053
0.2
438.4
0.3
40.6
0.5
118.9
0.0
LV
20
4477.9
224.9
0.5
101.1
0.7
97.8
0.6 0.013
0.23
1.105
0.2
0.135
0.5
16.5
0.4
2.4
2.2
10.0
0.8 0.5
MT
6
8069.2
1360.4
0.2
632.7
0.2
671.2
0.2 0.010
0.04
0.790
0.4
0.167
0.2
72.8
0.2
12.6
0.4
48.3
NL
25
1083013.6
43320.5
0.2
26178.7
0.2
7366.4
0.3 0.012
0.03
1.136
0.2
0.077
0.3
2642.9
0.2
292.1
0.3
1083.0
0.9
PL
34
87862.2
2608.9
0.3
1189.5
0.3
1107.2
0.3 0.019
0.06
0.962
0.1
0.110
0.5
288.4
0.4
33.9
0.8
71.5
0.0
PT
15
156724.6
10448.3
0.3
5908.3
0.4
3002.7
0.2 0.007
0.07
4.138
0.2
0.053
0.2
1077.1
0.3
100.5
0.4
343.4
0.0
SE
12
242021.9
20185.7
0.2
8182.8
0.2
7880.7
0.2 0.007
0.11
2.400
0.3
0.073
0.4
1358.8
0.1
129.8
0.5
403.4
0.1
SI
16
15642.5
982.5
0.3
485.3
0.4
291.5
0.3 0.017
0.18
2.600
0.2
0.139
0.2
83.0
0.3
13.7
0.6
37.1
0.1
SK
15
16960.1
1130.7
0.2
456.7
0.4
582.3
0.4 0.013
0.04
1.500
0.6
0.157
0.5
111.4
0.3
8.9
3.4
42.2
0.0
EU-25
2459
2142075.8
6261.5
0.2
2937.4
0.2
2725.2
0.3
0.0
0.1
2.0
0.2
0.07
0.2
377.8
0.2
42.6
0.8
132.9
0.8
EU-15
2292
2295486.1
6603.8
0.2
3100.4
0.2
2872.9
0.3 0.009
0.1
2.0
0.2
0.07
0.2
394.7
0.2
44.5
0.8
138.6
0.8
EU-10
167
36587.9
1563.2
0.4
699.2
0.4
699.1
0.4 0.015
0.1
1.4
0.3
0.14
0.4
146.1
0.3
15.3
0.6
54.1
0.2
Notes: Category denoted by bold shows the period average of the sum of the banks’ total assets in a given country between 1999 and 2003. Categories denoted by italic show the period average of the cross-sectional average in a given country between 1999 and 2003. Numbers are in EUR, M. is million. Aver. is abbreviation of simple mean and Rel. stdev is abbreviation of standard deviation.
233
References Aigner D., Lovell C. and Schmidt P., 1977, “Formulation and Estimation of Stochastic frontier Production Function Models”, Journal of Econometrics, Vol. 6, pp. 21-37. Allen L. and Rai A., 1996, “Operational Efficiency in Banking: An International Comparison”, Journal of Banking and Finance, Vol. 20, Issue 4., pp. 655-72. Aly H. Y., Grabowski R., Pasurka C. and Ragan N., 1990, “Technical, Scale, and Allocative Efficiencies in U.S. Banking: An Empirical Investigation”, Review of Economics and Statistics, Vol. 72, pp. 211-18. Berg S. A., 1992, “Mergers, Efficiency and Productivity Growth in Banking: The Norwegian Experience 1984-1990”, Norges Bank, Working paper 92/06. Berger A.N., 1993, “Distribution-free estimates of efficiency in the U.S. banking industry and tests of the standard distributional assumptions”, Journal of Productivity Analysis, Vol. 4, pp. 261-92. Berger A. N., 1995, “The Profit-Structure Relationship in Banking-Tests of Market-Power and EfficientStructure Hypotheses”, Journal of Money, Credit and Banking, Vol. 27, No. 2, pp. 404-31. Berger A. N. and Hannan T. H., 1993, “Using Efficiency Measures to Distinguish Among Alternative Explanations of the Structure-Performance Relationship in Banking”, Board of Governors of the Federal Reserve System, Finance and Economics Discussion Series, No. 18. Berger A. N. and Hannan T. H., 1998, “The Efficiency Cost Of Market Power In The Banking Industry: A Test Of The “Quiet Life” And Related Hypotheses”, The Review of Economics and Statistics, Vol. 80, Issue 3, pp. 454-65. Berger A. N. and Humphrey D. B., 1997, “Efficiency of Financial Institutions: International Survey and Directions for Future Research”, Board of Governors of the Federal Reserve System, Finance and Economics Discussion Series, No. 11. Berger A. N. and Mester L. J., 1997, “Inside the Black Box: What Explains Differences in the Efficiencies of Financial Institutions?”, Journal of Banking and Finance, Vol. 21, pp. 895-947. Bikker J. A., 1999, “Efficiency in the European Banking Industry: An Exploratory Analysis to Rank Countries”, Research Series Supervision No. 18, De Nederlandsche Bank. Bikker J. A., 2002, “Efficiency and Cost Differences across Countries in a Unified European Banking Market”, De Nederlandsche Bank, DNB Staff Reports, No. 87. Bos J.W.B. and Kool C.J.M., 2001, “Bank Size, Specialization and Efficiency in the Netherlands: 19921998”, Maastricht University, Research Memoranda, No. 8. Bureu van Dijk, 2004, Bankscope Database. Cervalatti A. M., 2003, “Financial Regulation and Supervision in EU Countries”, University of Bologna. Charnes A., Coopere W. W. and Rhodes E. L., 1978, “Measuring the Efficiency of Decision Making Units”, European Journal of Operations Research, Vol. 2, No. 6, pp. 429-44. Coelli T., 1996, “A Guide to Frontier Version 4.1: A Computer Program for Stochastic Frontier Production and Cost Function Estimation”, CEPA Working Paper 96/07. Dietsch M. and Weill L., 2000, “The Evolution of Cost and Profit Efficiency in European Banking”, in Research in Banking and Finance (Eds: I. Hasan and W. Hunter), Vol. 1, Elsevier. Farrell M. J., 1957, “The Measurement of Productive Efficiency”, Journal of the Royal Statistical Society, Vol. 120, pp. 253-81. Ferrier G. and Lovell C.A.K., 1990, “Measuring Cost Efficiency in Banking: Econometric and Linear Programming Evidence”, Journal of Econometrics, Vol. 46, pp. 229-45 Gallant A. R., 1981, “On the Bias in Flexible Functional Forms and an Essentially Unbiased Form: The Fourier Flexible Form”, Journal of Econometrics, Vol. 15, pp. 211-45. Grigorian D. A. and Manole V., 2002, “Determinants of Commercial Bank Performance in Transition: An Application of Data Envelopment Analysis”, IMF Working Paper No. 146.
234
BIS Papers No 28
Hasan I. and Marton K., 2000, “Development and Efficiency of the Banking Sector in a Transitional Economy: Hungarian Experience”, BOFIT Discussion Papers No. 7. Kaparakis E., Miller S. and Noulas A., 1994, “Short-Run Cost Inefficiency of Commercial Banks: A Flexible Stochastic Frontier Approach”, Journal of Money, Credit and Banking, Vol. 26, pp. 875-93. Kasman A., 2002, “Cost Efficiency, Scale Economies, and Technological Progress in Turkish Banking”, Central Bank Review, No. 1, pp. 1-20. Koetter M., 2004, “The Magnitude of Distortions when Measuring Bank Efficiency with Misspecified Input Prices”, Utrecht School of Economics. Kosak M. and Zajc P., 2004, “The East-West Efficiency Gap in European Banking”, 25th SUERF Colloquium, Madrid. Lang G. and Welzel P., 1996, “Efficiency and Technical Progress in Banking: Empirical Results for a Panel of German Banks”, Journal of Banking and Finance, Vol. 20, pp. 1003-23. Lozano-Vivas A., Pastor J.T. and Hasan I., 2001, “European Bank Performance beyond Country Borders: What Really Matters?”, European Finance Review, Vol. 5, Issue: 1-2, pp. 141-65. Meeusen W. and van den Broeck J., 1977, “Efficiency Estimation from Cobb-Douglas Production Functions with Composed Error”, International Economic Review, Vol. 18, No. 2, pp. 435-44. Móré Cs. and Nagy M., 2003, “Relationship Between Market Structure and Bank Performance: Empirical Evidence for Central and Eastern Europe”, MNB working paper No. 12. Schmidt P. and Sickles R. C., 1984, “Production Frontiers and Panel Data”, Journal of Business and Economic Statistics, Vol. 2, pp. 367-74. Sealey Jr. C. W. and Lindley, J. T., 1977, “Inputs, Outputs and Theory of Production and Cost at Depository Financial Institutions”, Journal of Finance, Vol. 4, pp. 1251-1266. Sinan C. A. and Register C.A., 1989, “Banking Efficiency: Stochastic Cost Frontier Approach”, paper presented at the 19th Annual FMA Meetings, Boston. Tomova M., 2005, “X-efficiency of European Banking - Inequality and Convergence”, Free University of Brussels. Tóth Á., 1999, “Kísérlet a hatékonyság empirikus elemzésére”, MNB working paper series, 1999/2, (available in Hungarian only). Vennet V. R., 2002, “Cost and Profit Efficiency of Financial Conglomerates and Universal Banks in Europe”, Journal of Money, Credit and Banking, Vol. 34, No. 1, pp. 254-82. Weill L., 2004, “The Evolution of Efficiency in European Banking in the 90’s”, 25th SUERF Colloquium, Madrid. Yildirim H. S. and Philippatos G. C., 2002, “Efficiency of Banks: Recent Evidence from the Transition Economies of Europe 1993-2000”, University of Tennessee.
BIS Papers No 28
235
Recent banking developments in India Vittaldas Leeladhar
The Indian banking sector has witnessed wide ranging changes under the influence of the financial sector reforms initiated during the early 1990s. The approach to such reforms in India has been one of gradual and non-disruptive progress through a consultative process. The emphasis has been on deregulation and opening up the banking sector to market forces. The Reserve Bank has been consistently working towards the establishment of an enabling regulatory framework with prompt and effective supervision as well as the development of technological and institutional infrastructure. Persistent efforts have been made towards adoption of international benchmarks as appropriate to Indian conditions. While certain changes in the legal infrastructure are yet to be effected, the developments so far have brought the Indian financial system closer to global standards.
Statutory Pre-emptions In the pre-reforms phase, the Indian banking system operated with a high level of statutory preemptions, in the form of both the Cash Reserve Ratio (CRR) and the Statutory Liquidity Ratio (SLR), reflecting the high level of the country’s fiscal deficit and its high degree of monetisation. Efforts in the recent period have been focused on lowering both the CRR and SLR. The statutory minimum of 25 per cent for the SLR was reached as early as 1997, and while the Reserve Bank continues to pursue its medium-term objective of reducing the CRR to the statutory minimum level of 3.0 per cent, the CRR of the Scheduled Commercial Banks (SCBs) is currently placed at 5.0 per cent of NDTL (net demand and time liabilities). The legislative changes proposed by the Government in the Union Budget, 2005-06 to remove the limits on the SLR and CRR are expected to provide freedom to the Reserve Bank in the conduct of monetary policy and also lend further flexibility to the banking system in the deployment of resources.
Interest Rate Structure Deregulation of interest rates has been one of the key features of financial sector reforms. In recent years, it has improved the competitiveness of the financial environment and strengthened the transmission mechanism of monetary policy. Sequencing of interest rate deregulation has also enabled better price discovery and imparted greater efficiency to the resource allocation process. The process has been gradual and predicated upon the institution of prudential regulation of the banking system, market behaviour, financial opening and, above all, the underlying macroeconomic conditions. Interest rates have now been largely deregulated except in the case of: (i) savings deposit accounts; (ii) non-resident Indian (NRI) deposits; (iii) small loans up to Rs.2 lakh; and (iv) export credit. After the interest rate deregulation, banks became free to determine their own lending interest rates. As advised by the Indian Banks’ Association (a self-regulatory organisation for banks), commercial banks determine their respective BPLRs (benchmark prime lending rates) taking into consideration: (i) actual cost of funds; (ii) operating expenses; and (iii) a minimum margin to cover regulatory requirements of provisioning and capital charge and profit margin. These factors differ from bank to bank and feed into the determination of BPLR and spreads of banks. The BPLRs of public sector banks declined to 10.25-11.25 per cent in March 2005 from 10.25-11.50 per cent in March 2004. With a view to granting operational autonomy to public sector banks, public ownership in these banks was reduced by allowing them to raise capital from the equity market of up to 49 per cent of paid-up capital. Competition is being fostered by permitting new private sector banks, and more liberal entry of branches of foreign banks, joint-venture banks and insurance companies. Recently, a roadmap for the presence of foreign banks in India was released which sets out the process of the gradual opening-up of the banking sector in a transparent manner. Foreign investments in the financial sector in the form
BIS Papers No 28
237
of Foreign Direct Investment (FDI) as well as portfolio investment have been permitted. Furthermore, banks have been allowed to diversify product portfolio and business activities. The share of public sector banks in the banking business is going down, particularly in metropolitan areas. Some diversification of ownership in select public sector banks has helped further the move towards autonomy and thus provided some response to competitive pressures. Transparency and disclosure standards have been enhanced to meet international standards in an ongoing manner.
Prudential Regulation Prudential norms related to risk-weighted capital adequacy requirements, accounting, income recognition, provisioning and exposure were introduced in 1992 and gradually these norms have been brought up to international standards. Other initiatives in the area of strengthening prudential norms include measures to strengthen risk management through recognition of different components of risk, assignment of risk-weights to various asset classes, norms on connected lending and risk concentration, application of the mark-to-market principle for investment portfolios and limits on deployment of funds in sensitive activities. Keeping in view the Reserve Bank’s goal to achieve consistency and harmony with international standards and our approach to adopt these standards at a pace appropriate to our context, it has been decided to migrate to Basel II. Banks are required to maintain a minimum CRAR (capital to risk weighted assets ratio) of 9 per cent on an ongoing basis. The capital requirements are uniformly applied to all banks, including foreign banks operating in India, by way of prudential guidelines on capital adequacy. Commercial banks in India will start implementing Basel II with effect from March 31, 2007. They will initially adopt the Standardised Approach for credit risk and the Basic Indicator Approach for operational risk. After adequate skills have been developed, at both bank and supervisory level, some banks may be allowed to migrate to the Internal Ratings-Based (IRB) Approach. Banks have also been advised to formulate and operationalise the Capital Adequacy Assessment Process (CAAP) as required under Pillar II of the New Framework. Some of the other regulatory initiatives relevant to Basel II that have been implemented by the Reserve Bank are: •
Ensuring that banks have a suitable risk management framework oriented towards their requirements and dictated by the size and complexity of their business, risk philosophy, market perceptions and expected level of capital.
•
Introducing Risk-Based Supervision (RBS) in select banks on a pilot basis.
•
Encouraging banks to formalise their CAAP in alignment with their business plan and performance budgeting system. This, together with the adoption of RBS, should aid in fulfilling the Pillar II requirements under Basel II.
•
Expanding the area of disclosures (Pillar III) so as to achieve greater transparency regarding the financial position and risk profile of banks.
•
Building capacity to ensure the regulator’s ability to identify eligible banks and permit them to adopt IRB/Advanced Measurement approaches.
With a view to ensuring migration to Basel II in a non-disruptive manner, a consultative and participative approach has been adopted for both designing and implementing the New Framework. A Steering Committee comprising senior officials from 14 banks (public, private and foreign) with representation from the Indian Banks’ Association and the Reserve Bank has been constituted. On the basis of recommendations of the Steering Committee, draft guidelines on implementation of the New Capital Adequacy Framework have been issued to banks. In order to assess the impact of Basel II adoption in various jurisdictions and re-calibrate the proposals, the BCBS is currently undertaking the Fifth Quantitative Impact Study (QIS 5). India will be participating in the study, and has selected 11 banks which form a representative sample for this purpose. These banks account for 51.20 per cent of market share in terms of assets. They have been advised to familiarise themselves with the QIS 5 requirements to enable them to participate in the exercise effectively. The Reserve Bank is currently focusing on the issue of recognition of the external rating agencies for use in the Standardised Approach for credit risk.
238
BIS Papers No 28
As a well-established risk management system is a pre-requisite for implementation of advanced approaches under the New Capital Adequacy Framework, banks were required to examine the various options available under the Framework and draw up a roadmap for migration to Basel II. The feedback received from banks suggests that a few may be keen on implementing the advanced approaches. However, not all are fully equipped to do so straightaway and are, therefore, looking to migrate to the advanced approaches at a later date. Basel II provides that banks should be allowed to adopt/migrate to advanced approaches only with the specific approval of the supervisor, after ensuring that they satisfy the minimum requirements specified in the Framework, not only at the time of adoption/migration, but on a continuing basis. Hence, banks desirous of adopting the advanced approaches must perform a stringent assessment of their compliance with the minimum requirements before they shift gears to migrate to these approaches. In this context, current non-availability of acceptable and qualitative historical data relevant to internal credit risk ratings and operational risk losses, along with the related costs involved in building up and maintaining the requisite database, is expected to influence the pace of migration to the advanced approaches available under Basel II.
Exposure Norms The Reserve Bank has prescribed regulatory limits on banks’ exposure to individual and group borrowers to avoid concentration of credit, and has advised banks to fix limits on their exposure to specific industries or sectors (real estate) to ensure better risk management. In addition, banks are also required to observe certain statutory and regulatory limits in respect of their exposures to capital markets.
Asset-Liability Management In view of the growing need for banks to be able to identify, measure, monitor and control risks, appropriate risk management guidelines have been issued from time to time by the Reserve Bank, including guidelines on Asset-Liability Management (ALM). These guidelines are intended to serve as a benchmark for banks to establish an integrated risk management system. However, banks can also develop their own systems compatible with type and size of operations as well as risk perception and put in place a proper system for covering the existing deficiencies and the requisite upgrading. Detailed guidelines on the management of credit risk, market risk, operational risk, etc. have also been issued to banks by the Reserve Bank. The progress made by the banks is monitored on a quarterly basis. With regard to risk management techniques, banks are at different stages of drawing up a comprehensive credit rating system, undertaking a credit risk assessment on a half yearly basis, pricing loans on the basis of risk rating, adopting the Risk-Adjusted Return on Capital (RAROC) framework of pricing, etc. Some banks stipulate a quantitative ceiling on aggregate exposures in specified risk categories, analyse rating-wise distribution of borrowers in various industries, etc. In respect of market risk, almost all banks have an Asset-Liability Management Committee. They have articulated market risk management policies and procedures, and have undertaken studies of behavioural maturity patterns of various components of on-/off-balance sheet items.
NPL Management Banks have been provided with a menu of options for disposal/recovery of NPLs (non-performing loans). Banks resolve/recover their NPLs through compromise/one time settlement, filing of suits, Debt Recovery Tribunals, the Lok Adalat (people’s court) forum, Corporate Debt Restructuring (CDR), sale to securitisation/reconstruction companies and other banks or to non-banking finance companies (NBFCs). The promulgation of the Securitisation and Reconstruction of Financial Assets and Enforcement of Security Interest (SARFAESI) Act, 2002 and its subsequent amendment have strengthened the position of creditors. Another significant measure has been the setting-up of the
BIS Papers No 28
239
Credit Information Bureau for information sharing on defaulters and other borrowers. The role of Credit Information Bureau of India Ltd. (CIBIL) in improving the quality of credit analysis by financial institutions and banks need hardly be overemphasised. With the enactment of the Credit Information Companies (Regulation) Act, 2005, the legal framework has been put in place to facilitate the fullfledged operationalisation of CIBIL and the introduction of other credit bureaus.
Board for Financial Supervision (BFS) An independent Board for Financial Supervision (BFS) under the aegis of the Reserve Bank has been established as the apex supervisory authority for commercial banks, financial institutions, urban banks and NBFCs. Consistent with international practice, the Board’s focus is on offsite and on-site inspections and on banks’ internal control systems. Offsite surveillance has been strengthened through control returns. The role of statutory auditors has been emphasised with increased internal control through strengthening of the internal audit function. Significant progress has been made in implementation of the Core Principles for Effective Banking Supervision. The supervisory rating system under CAMELS has been established, coupled with a move towards risk-based supervision. Consolidated supervision of financial conglomerates has since been introduced with bi-annual discussions with the financial conglomerates. There have also been initiatives aimed at strengthening corporate governance through enhanced due diligence on important shareholders, and fit and proper tests for directors. A scheme of Prompt Corrective Action (PCA) is in place for attending to banks showing steady deterioration in financial health. Three financial indicators, viz. capital to risk-weighted assets ratio (CRAR), net non-performing assets (net NPA) and Return on Assets (RoA) have been identified with specific threshold limits. When the indicators fall below the threshold level (CRAR, RoA) or go above it (net NPAs), the PCA scheme envisages certain structured/discretionary actions to be taken by the regulator. The structured actions in the case of CRAR falling below the trigger point may include, among other things, submission and implementation of a capital restoration plan, restriction on expansion of risk weighted assets, restriction on entering into new lines of business, reducing/skipping dividend payments, and requirement for recapitalisation. The structured actions in the case of RoA falling below the trigger level may include, among other things, restriction on accessing/renewing costly deposits and CDs, a requirement to take steps to increase fee-based income and to contain administrative expenses, not to enter new lines of business, imposition of restrictions on borrowings from the inter bank market, etc. In the case of increasing net NPAs, structured actions will include, among other things, undertaking a special drive to reduce the stock of NPAs and containing the generation of fresh NPAs, reviewing the loan policy of the bank, taking steps to upgrade credit appraisal skills and systems and to strengthen follow-up of advances, including a loan review mechanism for large loans, following up suitfiled/decreed debts effectively, putting in place proper credit risk management policies/processes/procedures/prudential limits, reducing loan concentration, etc. Discretionary action may include restrictions on capital expenditure, expansion in staff, and increase of stake in subsidiaries. The Reserve Bank/Government may take steps to change promoters/ ownership and may even take steps to merge/amalgamate/liquidate the bank or impose a moratorium on it if its position does not improve within an agreed period.
Technological Infrastructure In recent years, the Reserve Bank has endeavoured to improve the efficiency of the financial system by ensuring the presence of a safe, secure and effective payment and settlement system. In the process, apart from performing regulatory and oversight functions the Reserve Bank has also played an important role in promoting the system’s functionality and modernisation on an ongoing basis. The consolidation of the existing payment systems revolves around strengthening computerised cheque clearing, and expanding the reach of Electronic Clearing Services (ECS) and Electronic Funds
240
BIS Papers No 28
Transfer (EFT). The critical elements of the developmental strategy are the opening of new clearing houses, interconnection of clearing houses through the Indian Financial Network (INFINET) and the development of a Real-Time Gross Settlement (RTGS) System, a Centralised Funds Management System (CFMS), a Negotiated Dealing System (NDS) and the Structured Financial Messaging System (SFMS). Similarly, integration of the various payment products with the systems of individual banks has been another thrust area.
An Assessment These reform measures have had a major impact on the overall efficiency and stability of the banking system in India. The dependence of the Indian banking system on volatile liabilities to finance its assets is quite limited, with the funding volatility ratio at -0.17 per cent as compared with a global range of -0.17 to 0.11 per cent. The overall capital adequacy ratio of banks at end-March 2005 was 12.8 per cent as against the regulatory requirement of 9 per cent which itself is higher than the Basel norm of 8 per cent. The capital adequacy ratio was broadly comparable with the global range. There has been a marked improvement in asset quality with the percentage of gross NPAs to gross advances for the banking system declining from 14.4 per cent in 1998 to 5.2 per cent in 2005. Globally, the NPL ratio varies widely from a low of 0.3 per cent to 3.0 per cent in developed economies, to over 10.0 per cent in several Latin American economies. The reform measures have also resulted in an improvement in the profitability of banks. RoA rose from 0.4 per cent in the year 1991-92 to 0.9 per cent in 2004-05. Considering that, globally, RoA was in the range -1.2 to 6.2 per cent for 2004, Indian banks are well placed. The banking sector reforms have also emphasised the need to review manpower resources and rationalise requirements by drawing up a realistic plan so as to reduce operating cost and improve profitability. The cost to income ratio of 0.5 per cent for Indian banks compares favourably with the global range of 0.46 per cent to 0.68 per cent and vis-à-vis 0.48 per cent to 1.16 per cent for the world’s largest banks. In recent years, the Indian economy has been undergoing a phase of high growth coupled with internal and external stability characterised by price stability, fiscal consolidation, overall balance of payments alignment, improvement in the performance of financial institutions and stable financial market conditions and the service sector taking an increasing share, enhanced competitiveness, increased emphasis on infrastructure, improved market microstructure, an enabling legislative environment and significant capital inflows. This has provided the backdrop for a more sustained development of financial markets and reform.
BIS Papers No 28
241
Indonesia’s banking industry: progress to date 1 Dr. Miranda S. Goeltom 2
I.
Introduction
In the years following the crisis of 1998-99, the Indonesian banking industry achieved significant progress until 2004, as highlighted by various indicators such as credit growth, non-performing loans (NPLs), return on assets (ROA), capital adequacy ratio (CAR), and loan to deposit ratio (LDR; Table 1). This progress was mainly due to the improvement in the overall macroeconomic environment as reflected in the declining trend of inflation (from 77% in 1998 to around 5.8% in 2004) and interest rates (from 35% in 1998 to 7.5% in 2004) and a relatively stable exchange rate of around IDR 9,000 per USD. However, soaring world oil prices and natural disasters have begun to affect macroeconomic conditions in Indonesia. The pressure on the rupiah and its pass through effect on domestic prices have heightened inflationary pressures, leading Bank Indonesia (BI) to respond with a gradual increase in interest rates. The recent hike in domestic fuel prices pushed November headline inflation to around 18.9%, while the Bank Indonesia benchmark rate (BI Rate) was raised to 12.75%.
Table 1 Main Banking Indicators Main Indicators
Pre-Crisis
Crisis
Recovery
Dec-96 Dec-97 Dec-98 Dec-99
Dec-00
Dec-01
Dec-02
Dec-03
Dec-04
Mar-05
Jun-05
Sep-05
Total Assets (T Rp)
506.9
715.2
895.5
1,006.7
1,030.5
1,099.7
1,112.2
1,196.2
1,272.3
1,280.6
1,344.6
1,418.6
Deposits (T Rp)
303.2
400.4
625.3
617.6
699.1
797.4
835.8
888.6
963.1
959.3
1,011.0
1,077.5
Loans (T Rp) *
331.3
444.9
545.5
277.3
320.5
358.6
410.3
477.2
595.1
617.8
664.3
715.3
Earning Assets (T Rp)
387.4
500.5
552.3
1,283.3
853.7
1,007.2
1,048.1
1,023.6
1,072.4
1,146.8
1,128.4
1,239.9
(12.5)
1.1
2.9
3.1
4.0
3.2
6.3
6.0
6.1
5.9
82.6
72.4
26.2
33.2
33.0
38.2
43.2
50.0
51.3
53.1
54.2
1.2
1.4
(18.8)
(6.1)
0.9
1.4
1.9
2.5
3.5
3.4
2.9
2.6
6.6
7.1
48.6
32.8
18.8
12.1
8.1
8.2
5.8
5.6
7.9
8.8
3.9
4.2
35.1
7.3
5.8
3.6
2.1
3.0
1.7
1.9
3.7
5.0
11.8
9.2
(15.7)
(8.1)
12.7
20.5
22.5
19.4
19.4
21.7
19.5
19.4
Net Interest Income (T Rp)
-
-
LDR (%)
78.3
ROA (%) NPLs Gross (%) NPLs Net (%) CAR (%)
Credit growth was targeted to reach 22% in 2005, and at the time of writing this is clearly achievable, as the September figure already shows year on year growth of 20.2%. Consumer loans have experienced the fastest growth, followed by working capital loans, while lending for investment is growing relatively slowly. This, in turn, will drive BI to maintain strong vigilance over loan growth. Despite rising uncertainty and risk exposure, banks are predicted to have the capacity to confront risks as they have ample capital cushions. Next, I will concisely shed light on major structural changes in the Indonesian banking sector, the nature of current banking risks, and the importance of monetary and financial stability.
1
Country paper for BIS Deputy Governors’ Meeting, Basel, 8-9 December 2005.
2
Senior Deputy Governor, Bank Indonesia.
BIS Papers No 28
243
II.
Evaluation of major structural changes
1.
Privatization
After completing the recapitalization of ailing major banks in 2000, the government started to privatize them. So far, the sale of the government’s stake in major banks has been successful, with international investors showing significant interest in domestic banks. At the time of writing 15 banks, representing more than 70% of the industry’s total assets, have been privatized. Aside from creating a more competitive banking landscape and raising state revenue, the privatization policy is expected to benefit the domestic banking industry by promoting governance, transfer of technology, and enhanced risk management competencies. Since 2002, the government’s stake in nine domestic private banks has been divested and sold to foreign investors as controlling shareholders. By December 2004, total assets of these nine banks with foreign majority had reached 42% of total industry assets.
2.
Mergers and Consolidation
In accordance with the Indonesian Banking Architecture 3, BI intends to create a sound domestic banking structure capable of meeting public needs and to promote sustainable national economic development. Such a sound banking structure could be attained through enhancing the capital base since it is believed that a stronger capital base will allow banks to assume higher risk taking capacity, improve information system technology and expand business scale as well as lending capacity. As a consequence, in July 2005 BI issued a regulation on minimum capital requirements, which basically requires all commercial banks to have minimum tier 1 capital of IDR 80 billion (equiv. USD 8 million) by end-2007 and IDR 100 billion (equiv. USD 10 million) by end-2010. Within five years, all commercial banks are expected to have minimum capital commensurate with their scope of business and risks. Any banks failing to maintain those minimum statutory levels will be subject to several sanctions; among others, these may include revocation of their licences for foreign exchange operations and closure of branches. To allow monitoring of their progress towards meeting the minimum capital requirement, banks are required to submit a business plan containing strategies for achieving the required capital levels and current state of progress. Increasingly, BI is sending the message to banks that they will have to prepare to merge or consolidate so as to strengthen their capital base. It appears that eventually - and sooner rather than later - BI will need to be more proactive in encouraging banks to merge or consolidate, in particular the small banks that are mostly family-owned and family-run businesses, and whose shareholders tend to be very reluctant in giving up ownership.
3.
Role of Foreign Banks
Foreign banks in Indonesia may operate in the form of either a branch, a subsidiary (either through direct investment or capital market investment), or a representative office. While representative offices do not conduct business activities, branches and subsidiaries play an active role in the domestic banking industry. Since the enactment of the 1998 Banking Act, the maximum limit of foreign parties’ ownership in domestic banks was raised from 51% to 99%. In addition, since 1999 foreign banks have been allowed to open branches in any location throughout Indonesia, while permission was previously limited to a maximum of 10 big cities. However, it is more attractive for foreign parties/banks to acquire shares in existing domestic banks than to establish new branches, which requires them to provide operating funds of at least IDR 3 trillion (equiv. USD 300 million). This preference is evident as indicated by the recent increasing number of banks coming under ownership of foreign parties as the
3
See Section IV.
244
BIS Papers No 28
controlling shareholders. Liberalization has boosted the role of foreign banks in Indonesia; their assets have grown significantly from 7.74% (1996) to 12.75% (2004) of aggregated assets.
III.
Nature of banking risks
The Indonesian banking industry continues to confront increasing risks, due to rising interest rates, the rupiah depreciation, and the oil price hike. The increasing trend in credit risks is reflected by the increase of NPLs to 8.8% (gross) and 5% (net) respectively as of the end of the third quarter of 2005. This is mainly due to the impairment of loan portfolios in two of the largest national banks, as they were forced to re-classify their loan quality, as well as the deterioration of the quality of the restructured loans purchased from IBRA (the Indonesian Bank Restructuring Agency). If we exclude these two banks, the gross and net NPLs decline significantly to 5.3% and 2.6%, respectively. It should be noted here that the NPL ratio of credits drawn in foreign currencies greatly exceeds credits drawn in rupiah. Table 2 NPL level, rupiah vs foreign currency NPLs, foreign currency loans (as a %) Banks 15 Big Banks Medium Small Joint Venture Foreign Branches Total Bank Industry
Rupiah
Foreign Currency
6.8 4.2 3.5 2.3 2.5 5.9
27.6 4.9 13.6 4.9 5.5 19.3
Market risks also remain high and are tending to increase as banks incur losses due to the falling prices of government bonds in their portfolios. Even though the exchange rate fluctuations have levelled off, the BI Rate is predicted to remain high up to the third quarter of 2006 as the Central Bank is trying to bring down inflation expectations to their medium term path of around 8% by the end of 2006. Liquidity risks are tending to increase to moderate levels as the limited deposit guarantee scheme is gradually put in place, replacing the blanket guarantee scheme. The gradual implementation of the limited scheme excludes guarantee coverage of inter bank money market transactions as of 22 September 2005. As mentioned above, rising fuel prices and the weakening rupiah are responsible for pushing inflation to the current elevated levels. BI and the government have taken a number of steps to respond to the situation. BI’s reference rate, the BI Rate, has been increased in a gradual and measurable manner. As a temporary measure, the maximum levels permitted for net open positions have been decreased and reserve requirement levels increased according to banks’ loan deposit ratios. The rise in the BI Rate has been followed by a rise in the insurance interest rates of the deposit insurance scheme, which has immediately been reflected in the deposit rates offered by most banks. Several banks are even providing special bonuses and gifts as additional incentives for depositors. These attempts to maintain depositor levels are increasing the banks’ cost of funds and putting pressure on their profit margins. Consequently, banks have been left with no choice but to raise their credit interest rates, taking them into a “zone” of higher risks. Such a zone is associated with environments where bank spreads and income margins are severely suppressed, while debtors’ ability to repay decreases as their real income becomes severely affected by the soaring inflation.
BIS Papers No 28
245
IV.
The importance of financial stability
The recent crisis has shown that Indonesia’s banking industry and overall financial system stability need to be improved and strengthened. From an institutional point of view, much remains to be done in establishing an efficient market economy. Moreover, we have learned that it is as important to maintain financial stability as it is to maintain monetary stability. Recent major initiatives to promote financial stability include, among others:
1.
Indonesian Banking Architecture (IBA)
The IBA is a comprehensive, basic framework for the Indonesian banking system and sets forth the direction, outline and working structures for the banking industry over the next five to 10 years. In the Architecture, the policy direction for the future development of the banking industry is based on the vision of building a sound, strong and efficient banking system to create financial system stability for the promotion of national economic growth. The IBA consists of six major pillars containing the following objectives: •
To establish a robust structure for the domestic banking system, capable of meeting the needs of the public and promoting sustainable economic development
•
To create an effective system for bank regulation and supervision in line with international standards
•
To build up a strong, highly competitive banking industry, resilient in the face of risks
•
To ensure good corporate governance for internal strengthening of the national banking industry
•
To provide a complete range of infrastructures to support the creation of a healthy banking industry
•
To empower and protect consumers of banking services
2.
Basel II Implementation
Basel II will be implemented in phases; implementation will commence in 2008. All commercial banks will be required to meet capital requirements by initially adopting the simplest approaches. Subsequently, any bank capable of making the necessary system changes and meeting all requirements adequately will be allowed to move towards the more sophisticated approaches upon BI’s approval. It is expected that by 2010 the Basel II framework will be applied in full scope covering all pillars.
3.
Financial Safety Nets
A financial safety net is one of the main pillars of a healthy and efficient banking system, in addition to effective regulation and supervision. In general, comprehensive financial safety nets cover five elements: (i) effective regulation; (ii) effective and independent supervision; (iii) an adequate “lender of last resort”; (iv) an appropriate deposit insurance scheme; and (v) problem bank resolution and adequate crisis settlement. The government and BI have formulated a policy framework for financial safety nets covering the role, liability and coordinating mechanism of each related institution in this area, namely BI, the Ministry of Finance, supervisory authorities, and the Deposit Insurance Company (DIC). The framework elaborates the ‘lender of last resort’ and deposit insurance policies to be adopted in the future. In accordance with the regulations, under normal conditions BI can provide short-term financing facilities for banks undergoing liquidity difficulties due to cash flow disparities. Additionally, it can also provide emergency liquidity assistance (ELA) for banks undergoing financial difficulties that have systemic impact and the potential to cause a crisis in the financial system. The funding for ELA will be provided by the government. BI and the Ministry of Finance have signed a Memorandum of
246
BIS Papers No 28
Understanding regarding the provision of ELA. The regulations concerning ELA provision are currently being formulated by BI and the Ministry of Finance team. Since 22 September 2005, the DIC has been in operation, performing two main functions: (i) acting as insurer of deposits up to a particular amount; and (ii) handling the resolution and closure of failed banks. The deposit insurance scheme will be gradually implemented up till March 2007, when the maximum coverage shall be limited to IDR 100 million (USD 10,000).
4.
Credit Bureau
As a facility for banks to improve their credit quality, a Credit Bureau, a body that will organize and maintain the credit data of banks’ customers, is being developed. So far, the recently established Debtor Information System has been helpful in increasing banks’ exchange of information regarding debtors’ credit standing within the overall banking system. In the future, small and medium-sized enterprises (SMEs) will receive due consideration too. BI will also stimulate the development of rural banks to reach areas which have hitherto not had access to banking services. The linkage programme that has been established with commercial banks will be improved to provide more incentives to commercial banks and rural banks to collaborate. Access to credit for SMEs and the general public will be increased through bond schemes and collaboration with district level government. Fundamental microeconomic weaknesses also exist as corporate governance has generally been poor. The lack of understanding with regard to the importance of transparency has created a business environment that does not promote adherence to good governance. To make matters worse, legal enforcement has been virtually absent or extremely weak at best, with bankruptcy resolutions being greatly insufficient. With corporate governance and other internal controls left ineffective, it is even more important to foster the development of the Credit Bureau as a way of reducing excessive risks due to incomplete and asymmetric information.
5.
Consumer Empowerment
In terms of customer protection, a complaint mechanism is currently being formulated that will accommodate customer criticisms and complaints regarding their banking services. In anticipation of disagreement between banks and their customers in settling disputes, BI plans to form an independent mediatory institution or bank-client ombudsman. Subsequently, the transparency standard of banks in promoting their products to customers will be clearly defined, so that customers can make an informed decision on which bank products are suitable and so that provision of misleading information can be avoided. Customer resources will also be used to encourage banks to conduct periodic customer education.
V.
Concluding remarks
The twin crisis (in the currency and the banking industry) left us with much to learn. Great lessons have been learned on the importance of financial stability in supporting monetary stability and the economy. By putting economic policies in balance to pursue monetary and financial stability, we can expect to improve our ability to detect possible future crises. Market discipline, as one of the main pillars of Basel II, should be embedded in the banking industry as well as the financial industry. As the banking industry becomes more advanced, with product proliferation and increasing sophistication, the role of supervisors should be supported by players in the industry to ensure and protect the public interest. This will require a great degree of transparency from the institutions concerned. To increase supervisory effectiveness, regulators should be able to issue high quality researched-based regulations, thus ensuring smooth implementation. As financial stability requires better coordination and harmonization among related regulatory and supervisory institutions in the country, this issue should be prioritized and continuously strengthened.
BIS Papers No 28
247
Changes in the Israeli banking system Meir Sokoler
I.
Introduction
During the last decade the Israeli economy has undergone a huge structural change - the share of the advanced high sector has grown significantly at the expense of the more traditional sectors. However, this considerable structural change has not yet been matched by a similar change in the Israeli financial structure. Commercial banks continue to dominate the allocation of savings to investment. Yet recently a financial reform bill (the Bachar reform) was passed in the Knesset which will undoubtedly affect Israel’s financial structure, and which will also have profound effects on Israeli banks. The purpose of this paper is to explore the planned effects of the Bachar reform on the local financial scene with emphasis on the reform’s effects on: a) the nature of banking business, b) competition within the banking system as a whole, and c) the stability of the banking system. The plan of the paper is as follows: Section II describes the main features of the Israeli banking system, emphasizing its dominant role in financial intermediation in Israel, its high concentration and the (at least potential) conflict of interest contained within it. Section III examines the major proposals of the Bachar Committee, whose main purpose is to deal with the joint problem of high concentration and conflicts of interest within the banking system. Section IV attempts to evaluate the role that commercial banks will play in the future, following the implementation of the Committee’s proposals. Section V offers a brief conclusion.
II.
The Dominant Role of Commercial Banks in the Israeli Financial System
At present the financial system in Israel is largely dominated by banks and the banking system itself is dominated by the two largest banks (Hapoalim and Leumi). The dominance of these two banks is a result of their control over other financial institutions such as provident funds, mutual funds and underwriters, credit card companies and others. A major result of this financial structure is that at the end of 2004 more than 55% of the Israeli public’s assets were controlled directly (via bank deposits) or indirectly (through accounts with provident and mutual funds) by banks (Table 1). A similar picture emerges with respect to sources of finance. In 2004, about 76% of the sources of finance to the business sector came from bank credit or from credit extended by provident funds that are owned and controlled by banks (Table 2). There is also a high degree of concentration within the banking system. The largest two banks control most of the deposits, credit mutual funds, provident funds and underwriting activities (Table 3). By international standards the Israeli banking system is highly concentrated (Diagram 1), and not very competitive (Diagram 2). The dominance of banks is also evident in secondary market trading (Diagram 3). The high degree of concentration in itself would be an impenetrable barrier to entry were it not combined with structural conflicts of interest which, according to the Bachar Committee’s report, include the following: •
Banks are both (investment) advisers and owners/managers of provident and mutual funds. They have an incentive to advise their customers to invest in financial products of the entities under their control, and have done so on many occasions.
BIS Papers No 28
249
•
Banks are both underwriters and credit providers; they have an incentive to underwrite selected borrowers where the proceeds are used to repay loans.
•
They also have an incentive to channel the funds of the institutions under their control to purchase issues of companies under their control.
•
Banks are both providers of a wide range of commercial banking activities and owners/managers of provident and mutual funds; they have an incentive to structure their activities in this way as these institutions receive the commercial banking services from the parent bank, without considering possible better alternatives. This is a very common practice in Israel.
The above mentioned conflicts of interest are well entrenched despite the vast array of restrictions and regulations (“Chinese walls”) designed to control them. In the words of the State Comptroller, “the Chinese walls set up by the Bank of Israel (BOI) and the Ministry of Finance (MOF) are not strong enough to overcome conflicts of interest and entail regulatory cost”. Some empirical evidence on the results of the pervasive conflicts of interest in the banking system is provided in a study by Bar and Kosanko (2004). They compare the yields on shares recommended by two types of analysts: independent and non-independent - those employed by banks making up a large portion of the latter group. The result presented in Diagram 4 clearly shows how independent analysts outperform the other group.
III.
The Bachar Committee Proposals
•
The combination of a high degree of concentration with far reaching conflicts of interest has created a vicious cycle that perpetuates the status quo. Concentration taken together with an involvement in a wide variety of activities creates structural conflicts of interest; and the exploitation of these conflicts serves to preserve the concentration.
•
Because all attempts to curtail conflicts of interest through Chinese walls have failed, deliberate government intervention in the structure of ownership and the activities of financial intermediaries, including banks, is required in order to break the above mentioned vicious cycle. Three major principles guided the recommendations of the Bachar Committee, which comprised representatives from all of the regulatory and supervisory authorities dealing with Israel’s capital market. 1
The principles are: •
Enhancing competition in the management of the public’s financial assets by developing alternative investment vehicles to those offered by banks, and by decentralizing the management of existing investment vehicles.
•
Enhancing competition in credit provision by developing non-bank credit instruments.
•
Enhancing competition vis-à-vis the household sector by exposing households more to non-bank assets and by adopting measures that would make it easier to switch from one bank to another.
(a)
Separation of Provident and Mutual Funds from Banks - both Ownership and Management
Banks should not be permitted to hold any interest at all, either directly or indirectly, in provident and mutual funds. Neither should banks manage the funds of these institutions (nor their portfolios).
1
The Committee included the Securities Authority, the Antitrust Authority, the BOI, including the Bank Supervision Department, the Ministry of Justice and the Capital Market, and the Insurance and Saving Division of the MOF.
250
BIS Papers No 28
Banks should separate from the ownership-management interests in provident and mutual funds according to the following timetable (Table 4). A different timetable applies to “large” banks and to “medium-sized and small” banks, in order to improve the competitive edge of the small and medium-sized banks. 2
(b)
Limiting Large Banks’ Underwriting Activities
Due to conflicts of interest in the activities of underwriters, especially between their interest in acting on behalf of related debtors and their fiduciary undertakings to the investing public, the proposal is that an underwriter should not be permitted to serve in a price setting capacity in any public offering if it has loaned large sums of money to the issuing company - i.e. if the issuing company’s outstanding debt to the underwriter exceeds NIS 5 million, and comprises more than 10% of the issuing company’s outstanding total financial liabilities. Furthermore, in order to limit underwriters’ ability to reward related entities with “attractive” issues, or alternatively, to limit their ability to sell unsuccessful issues to such entities, the proposal states than an underwriter should not be permitted to sell 5% or more of the value of securities offered in an issue to itself or to all the institutional entities in its group put together. These limitations will considerably restrict the leading role of the largest two banks in underwriting activities.
(c)
Steps to Limit Concentration Among Non-Bank Financial Intermediaries
In order to reduce the risk of serious concentration among non-bank financial intermediaries, the Committee proposes that no acquisition permits be granted if, after the acquisition, the purchaser and its group of affiliated companies will control more than 15% of the market share of long term pension funds and life insurance portfolios savings or more than a 20% share of the mutual fund market. These steps are intended to prevent the migration of concentration from the banking industry to life insurance companies and other branches of the capital market; it will lead to a decentralization of decision making centers and increase the probability of attracting international financial intermediaries. It should be emphasized that the limitations on the size of market shares pertain solely to mergers and acquisitions: they will not apply to an increase in market shares emanating from growth and competition.
(d)
Expanding the Range of Banks in Selling Pension Products
In order to exploit better the use of banks’ consulting and distribution networks, and to afford more convenient access to financial services, the Committee has recommended expanding the range of pension and life insurance products. Until now banks were prohibited from selling these products. The provision of financial advice along with the distribution of these products at bank branches will make the products more easily accessible to large segments of the population and will provide a new source of income for the banks. Once again, the Committee recommends different “market entry conditions” for “large” and “mediumsized and small” banks.
2
“Large banks” are defined as banking corporations belonging to a banking group whose equity exceeds NIS 10 billion (at the time of writing, this comprises the two largest banks).
BIS Papers No 28
251
IV.
The Role of Banks in Israel’s Financial Structure
It is believed that as a result of the reform, and additional complementary steps, particularly those pertaining to supervision and corporate governance, the future Israeli financial structure will be composed of three major pillars: (a)
Classical commercial banking, which will also include financial advice and the distribution of pension and life insurance products.
(b)
Life insurance companies, which will be the main producers of pension and annuity products.
(c)
Investment banking, which will mainly be responsible for helping businesses to raise funds in the capital market.
In addition, it is believed that the reform will contribute greatly to the already deepening secondary markets for FX, bonds, shares and derivatives (Diagram 5). The effects of these changes on the future of the Israeli banking system are of course uncertain, but the following observations can nevertheless be made; First, the growth of non-bank sources of finance relative to bank credit is set to continue (Diagram 6). Second, the high concentration of bank credit is likely to be reduced, affording small and mediumsized businesses greater access to such credit. Third, it is likely that the presence of foreign financial institutions, including foreign banks, will increase. At present, there are two foreign banks in Israel, servicing mostly large corporations and offering private banking services. Fourth, the growth in the secondary markets will increase the risk sharing capacity of the economy as a whole and that of the banking system in particular. Israeli banks are beginning to look for ways to securitize part of their loans portfolio. Fifth, as the business sector is likely to raise more funds through the capital market, banks will turn greater attention to the household sector. Sixth, banks’ role in consulting on and distributing pension and life insurance products is likely to grow considerably. This will require them to develop new skills and greater internal supervision. It should be noted that the law in Israel requires licensing for both financial and pension advisers. Seventh, mark to market accounting practices are likely to become more prevalent, which will increase the discipline imposed on banks by the financial markets.
V.
Conclusion
Following the adoption of the Bachar reform, the financial scenery in Israel is going to change considerably. The dominance of banks in the financial system will be reduced. Banks will not own or manage mutual funds or provident funds. The two largest banks are going to be more restricted in their underwriting activities. On the other hand, banks will be able to engage in activities from which they are presently barred. This includes distributing pension and life insurance products. The proposed reform will also help to further develop both the primary and the secondary capital market. This will enhance securitization activities, which banks can exploit to better allocate and share risk. This, in turn, will improve the functioning of the economy and also be of benefit to the banks themselves.
252
BIS Papers No 28
Table 1 Assets Managed by Banks 2000
2001
2002
2003
2004
NIS billion Deposits in banks
418.8
445.5
463.5
461.7
460.9
Total assets of provident funds managed by banks
147
152.5
146.5
165
179.5
Total assets of mutual funds managed by banks
39.0
56.4
40.6
74.8
86.6
Total assets of the public managed by banks
604.8
654.4
650.6
701.5
727.0
Total assets of the private sector
973.6
1,071.3
1,160.2
1,227.7
1,308.8
62.1
61.1
56.1
57.1
55.5
Share of assets managed by banks in the total assets of the private sector (%)
Table 2 Banks’ Share in Financial Activity, 2000 to 2004 % 2000
2001
2002
2003
2004
Total assets of the financial sector (gross)
78
78
77
75
74
Total credit
62
61
61
59
57
Total credit to the private sector
88
88
86
85
84
Total credit to the business sector
83
83
81
80
76
Share of banks and of provident funds managed by banks (%) in
Table 3 Banking Sector Concentration Banking
Mutual funds
Provident funds
Underwriting
Deposits
Credits
Assets managed
Assets managed
Number of issues
Poalim - 30%
Poalim - 33%
Poalim - 36%
Poalim - 41%
Poalim - 27%
Leumi - 30%
Leumi - 30%
Leumi - 31%
Leumi - 19%
Leumi -24%
IDB - 18%
IDB - 13%
IDB - 13%
IDB - 13%
Clal - 14%
78%
76%
80%
73%
65%
BIS Papers No 28
253
Table 4 Indicators of Quality of Bank Loans Percentages 2000
2001
2002
2003
2004
Problematic loans/total loans
7.0
9.0
10.1
10.6
10.9
Non-performing loans/total loans
1.5
1.7
2.5
2.6
2.6
0.50
0.85
1.31
1.12
0.92
Provision loss rates
Diagram 1 Concentration (H- Index) of Selected Banking Systems, 2003a H-Index 0.4
0.3 0.230
0.2
0.1
Italy
Austria
Germany
US
UK
Spain
France
Greece
New Zealand
Portugal
Canada
Australia
South Africa
Denmark
Sweden
Norway
Belgium
Ireland
Netherlands
Israel
Switzerland
Finland
0.0
a
For Italy, Germany, the US, France, Canada, Australia, South Africa, Norway and Ireland the H-Index is b calculated from data relating to 2002. For Israel the H-Index is calculated from data relating to 2004. Source: Banking supervision authorities of the relevant countries.
254
BIS Papers No 28
Diagram 2 1
Panzar & Rosse Index for measuring contestability of selected banking systems - intenational comparison P-R Index
0.9 0.8 0.68 0.68
0.7 0.56
0.6 0.5 0.4 0.3 0.2
Netherlands
Brazil
South Africa New Zealand
Australia Sweden Luxembourg
Poland Mexico
Belgium United Kingdom Hungary Greece
Peru Argentina Czech Republic
France Hong Kong, China
Canada
Ukraine Total Average Peer Group Average
Portugal Nigeria
Austria Switzerland
Colombia Philippines Chile
Germany Italy
Israel Norway
Croatia
India Russia
Spain
Japan Denmark
0.0
Turkey
0.1
The data source: (1) Claessens & Laeven, “What Drives Bank Competition?: Some International Evidence” (2003). (2) The data of the countries are annual averages for the period 1994-2001. (3) Israel's peer group consists of eight countries that have similar characteristics - size of the economy, size & concentration of the banking systems - Denmark, Greece, Norway, Portugal, Ireland, Finland, South Africa. (4) The data for Israel is annual averages for the period 1997-2003.
Diagram 3 Composition of Turnover: The Five Large Banking Groups, Other Banks, and Non-bank Members of the Stock Exchange, 2004 % 70 Shares and convertibles Bonds Derivatives
60.9
60
57.2 54.1
50 40 32.9
30
31. 8 25. 9
20 9.9
13. 2
14.1
10 0 The five large banking groups
Other banks
Non-bank members of the Stock Exchange
Source: Data of the Tel Aviv Stock Exchange.
BIS Papers No 28
255
Diagram 4 Analysts with Equity Stakes vs. Independent Analysts: Accrued excess return for half a year following the recommendation 0.05 Analysts with equity stakes Independent analysts 0.04
0.03
0.02
0.01
0
–0.01
–0.02 –20 –10
0
10
20
30
40
50
60
70
80
90
100
110
120
130
140
150
Diagram 5 Average Daily Turnover in Israel's Financial Markets, 2000-2005 NIS billion 1,200 Bonds
Dollars ($ million)
Shares
Derivatives
1,000
800
600
400
200
0 2000
256
2001
2002
2003
2004
BIS Papers No 28
Diagram 6 Annual Changes in Credit to the Business Sector, Bank Credit vis-à-vis Credit from other Sources, 2000-2005a percent 50 Rate of change of total credit
Rate of change of bank credit
Rate of change of nonbank credit
40
30
20
10
0 2000
2001
2002
2003
2004
2005
–10 a
BIS Papers No 28
Cumulative changes in credit till June 2005. Rates of changes in credit are in annual terms.
257
Restructuring and reforms in the Korean banking industry Soo-Myung Kim, Ji-Young Kim and Hoon-Tae Ryoo
I.
Introduction
The Korean banking industry has undergone substantial structural reforms since the 1997 financial crisis. A number of banks merged or exited, and foreign banks were permitted to enter the banking industry. Perhaps most significantly, there have been fundamental changes in the behavior of banks; they are now focusing much more on profitability and competitiveness than they did in the past. They are also assuming an increasingly important role as comprehensive asset managers. The structural and managerial reform effort has indeed improved banks’ solvency and profitability. Banks have performed better in nearly every respect and in a relatively short period of time. There has been especially marked improvement in productivity, risk management, and business process innovation. The long-held belief that “banks never fail because the government will bail them out” has nearly faded away completely. People in the financial sector are beginning to consider their occupation separately from their workplace. There has been considerable progress in financial opening and liberalization with an eye toward efficiency. Korea is widely acknowledged to possess qualified human resources in the financial industry. They have a mastery of the latest in information technology in addition to a high level of competence in taking on board changes in global industry trends. It is primarily thanks to these resources that banks were able to stage a remarkable turnaround and revitalize their management so efficiently after the crisis. The financial industry is a high value-added industry with great potential to create jobs and to grow quickly. Now is the time to capitalize on the progress that has been made thanks to the reforms. Banks must continue to improve efficiency and sharpen their competitive edge if they hope to prosper in the fiercely competitive global market.
II.
Restructuring and Reforms in the Banking Industry
1.
Banking Sector Restructuring
As financial liberalization and market opening started in the mid-1980s and accelerated in the 1990s, competition among financial institutions became fiercer, and their risk exposures widened greatly. Amid looming financial risks, the Korean economy entered a period of sluggish economic growth in the mid-1990s due to the erosion of its comparative cost advantage and problems of surplus capacity in many industries. In the midst of such unfavorable environmental shifts, banks should have striven to improve profitability and efficiency. Instead, they sought to expand their market share without consideration for risk management. As a result, a number of banks suddenly found themselves in financial distress, and their situation rapidly worsened with a spate of large corporate bankruptcies, and an ensuing credit crunch in the market. The credit crunch, paradoxically, brought the one result that the banks feared most, i.e. more corporate bankruptcies, thereby further worsening their asset quality. Soon after the onset of the crisis, the Korean financial authorities implemented a prompt corrective action (PCA) system. In this system, the capital adequacy ratio forms the most important indicator of the need for PCA. After an evaluation in June 1998, the authorities decided to close five banks whose Basel capital adequacy ratios had already fallen below 8% at the end of 1997. It was decided that these banks would be acquired by five healthier banks through purchase and assumption (P&A), which allows the selective acquisition of assets and assumption of liabilities. P&A was preferred to liquidation or to merger and acquisition on the grounds that the adverse effects on the related
BIS Papers No 28
259
depositors, borrowers and the government, let alone the acquirers, would be smaller and that the process could be completed in a shorter period of time. A further seven banks that had Basel capital adequacy ratios below 8% but were deemed capable of staging a turnaround were required, once their turnaround plans had been conditionally approved, to file implementation plans for management improvement with the Financial Supervisory Commission (FSC) by July 31, 1998. Items to be included in the plans were steps to strengthen their business through increasing their capital, changes in their management teams, and downsizing. The FSC’s Review Team then went through these plans, modifying and supplementing them before their finalization on September 15, 1998. The seven institutions in question accordingly carried out their rehabilitation plans involving mergers, capital increases by inducement of foreign capital, consolidation with subsidiaries, and partial limitations of their banking business activities. Healthy banks, meanwhile, were strongly encouraged to seek consolidation and develop universal banking services in order to become leaders in the banking sector. The biggest and most significant merger took place in November 2001, when Kookmin Bank and Housing & Commercial Bank merged to create Korea’s largest commercial bank. Because of the strengths and market positions of Kookmin Bank in retail banking and of Housing & Commercial Bank in mortgage lending, the merger of the two banks has generated a new wave of competitive pressures and contributed to further restructuring and consolidation in the banking sector.
Changes in the Number of Banks January 1998-September 2005 No. of banks as of end-1997 (A) Banks Commercial banks Nation-wide banks Local banks Specialized banks
Exits and Mergers (B) Exits
Mergers
No. of banks newly established (C)
No. of banks operating (A-B+C)
33 26
14 12
5 5
9 7
– –
19 14
(16)
(8)
(3)
(5)
–
(8)
(10)
(4)
(2)
(2)
–
(6)
7
2
–
2
–
5
Recapitalization of the financial sector was needed to relieve a paralyzing credit crunch at the beginning of the crisis and to restore the proper functioning of banks in their role as financial intermediaries. Keenly alert to this need, the government injected a huge amount of public funds into financial institutions, totaling 167.6 trillion won (including recycled funds) from November 1997 to July 2005. Of this, some 86.8 trillion won was injected into banks. Funds were injected into troubled financial institutions for the payment of insured deposits and purposes of recapitalization mainly by the Korea Deposit Insurance Corporation, and for the purchase of NPLs (non-performing loans) by the Korean Asset Management Corporation. The public funds were raised mainly by issuing bonds of the Deposit Insurance Fund run by KDIC (81.6 trillion won) and bonds of the Non-Performing Loans Management Fund run by KAMCO (20.5 trillion won), from government fiscal sources (20.2 trillion won), and recycled funds (40.9 trillion won). Bonds of both the Deposit Insurance Fund and the Non-performing Loans Management Fund are guaranteed by the government. To prevent possible side effects like a run-up in interest rates or a crowding-out effect through their issue in the market, the government paid financial institutions for the purchase of NPLs directly with the bonds or participated in the equity of banks by the subscription of these bonds for their recapitalization. In order to mitigate moral hazard, the authorities assisted distressed financial institutions on the condition that the institutions made efforts to reduce costs, recapitalize themselves by inducing foreign investments, and write down the capital of existing shareholders. However, the government has been criticized for supporting nonviable institutions, for injecting excessive liquidity in some cases, and for doing too little to recover funds. Responding to this criticism, in February 2001 it established a Public Fund Oversight Committee to enhance the transparency and efficiency of fund management and expedite the recovery of funds.
260
BIS Papers No 28
Trend of Banking Industry Change 1997.12
1998.6
Commercial
1999.1-6
1999.7-12
2000
2001
2002
2003
Current Woori
Hanvit
BHC
Hanil
Woori BHC
Peace
(Woori) (Kwangju)
Kwangju
(Kyongnam) Kyongnam Chohung
Chohung
Shinhan
Chohung
Chungbuk
BHC Kangwon Shinhan
Shinhan BHC Shinhan
Shinhan BHC
Donghwa
(Shinhan) (Chohung) (Cheju)
Cheju Hana
Hana Hana
Chungchong
Hana
Hana
Boram Seoul Kookmin
Kookmin
Daedong
Kookmin
Longterm Credit Housing
Kookmin
Kookmin
Housing
Dongnam Koram
Citibank 1 Korea
Koram Kyongki First
SC First
Exchange
Exchange
Daegu
Daegu
Chonbuk
Chonbuk
Pusan
Pusan
Agricultural Cooperatives Livestock Cooperatives Fisheries Cooperatives
Agricultural Cooper atives
Agricultural Cooperatives
Fisheries Cooperatives
1
Citibank Korea was established by consolidating the fifteen branches of Citibank in Korea and Koram Bank on November 1, 2004.
BIS Papers No 28
261
Public Funds Raised and Injected November 1997-July 2005 In trillions of won Source Issue of bonds Collected funds Fiscal sources 1
Others Total
Recapitalization
Compensation for losses
Repayment of deposit
42.2
15.2
20.0
4.2
20.5
102.12
7.3
2.5
7.4
6.4
17.4
40.9
13.9
–
–
6.3
–
20.2
0.1
0.2
2.9
0.1
1.1
4.3
63.5
17.8
30.3
17.0
39.0
167.6
1
Borrowing from financial institutions, deposit insurance premium, etc. and Non-Performing Loans Management Fund Bonds (20.5 trillion won).
Purchase of assets
2
Purchase of NPLs
Total
Deposit Insurance Fund Bonds (81.6 trillion won)
The government found itself forced to nationalize several commercial banks in the process of financial restructuring after the financial crisis in 1997. The major objectives of privatization of the state-owned banks have been to promote competitiveness of the banking industry by securing the introduction of management accountability through private ownership and to seamlessly recoup the public funds injected for financial restructuring. Strengthening market discipline by minimizing the scope for government intervention served as another reason. The government, along with Korea Deposit Insurance Corporation (KDIC), has privatized four nationalized banks (Korea First, Cheju, Seoul, and Chohung) since 1999 by selling its equity stakes in them. In December 1999, the government sold a 51% stake in Korea First Bank to Newbridge Capital. In April 2005, the government also sold its entire remaining equity participation to Standard Chartered Bank, which had already bought Newbridge Capital’s stake in Korea First Bank’s equity capital. Cheju Bank and Chohung Bank were acquired by Shinhan Financial Holding Company Group as its subsidiaries in April 2002 and July 2003, respectively. Seoul Bank merged with Hana Bank in November 2002. 2.
Banking Sector Reforms
Strengthening Prudential Regulation The authorities strengthened prudential regulation of banks to improve their soundness and stability, bringing them into line with international best practice. New regulations, once introduced and revised in the banking sector, were promptly applied in other parts of the financial sector with slight modifications to reflect the particular characteristics of each type of financial institution. As a first step, a PCA (prompt corrective action) system was introduced in April 1998. PCAs allow the financial supervisory authorities to automatically issue an order to a particular financial institution whenever management conditions fall below a preset level. This system helps maintain financial soundness and stability and minimizes the social costs arising from financial distress or bankruptcy. Secondly, the criterion for classification of banking assets as substandard was changed from those nonperforming for six months to those non-performing for three months (Sep. 1998). The criterion for classification as precautionary was also changed from those non-performing for three months to those nonperforming for one month (Sep. 1998). And forward-looking criteria (FLC), which are standards for classifying asset soundness based on the future payment capacity of borrowers, were introduced for banks (Dec. 1999). Thirdly, to reduce the risk resulting from large credit exposures to a single entity, the ceiling on credits to a single individual or juridical person, as well as a single large business group, and ceilings on large credits, were lowered for banks (Apr. 1999). In detail, the ceiling on credits to a single individual or juridical person and that on credits to a single business group were brought down from 45% of bank’s equity capital to 20% and 25%, respectively, and the definition of “large credits” to a single individual or juridical person, whose total amount is limited to five times a bank’s equity, was narrowed from 15% of a bank’s equity capital to 10%.
262
BIS Papers No 28
Framework of Prompt Corrective Actions As of the end of September 2005 Enforcement Section
Management improvement
Management improvement
Management improvement
• BIS capital ratio:
• below 6%
• below 2%
• below 3%
• below 1%
• below 50%
• below 0%
• BIS capital ratio: Financial Ratios • solvency margin ratio: below 100% • equity capital ratio: below • below 120% 150%
Triggering requirements Evaluation of management status
Other reasons
Measures
• below 100%
• composite rating: 3rd grade or above
• composite rating: below – • component rating of asset 4th quality or capital adequacy: below 4th • if obviously adjudged to meet the above mentioned requirements, due to serious financial incidents or bad loans
• (same as left-hand column)
• if judged as a distressed financial institution
• if it fails to faithfully implement its management improvement plan
• if deemed either to be unable to or not to be implementing its management improvement plan
• improvement in manpower • closure, consolidation, and organizational or restriction on the establishment of business management offices • cost reduction • reduction of • restrictions on investments organizational size in fixed assets, entries into new business areas, and • restrictions on holding new capital investments risky assets and disposal of assets • disposal of non-performing • divestiture of assets subsidiaries • restriction on dividends • demand for the • arrangement of special replacement of directors loan loss provisions • partial suspension of business
• retirement of all or part of the issued stocks • suspension of duties of top management • mergers or entry into FHCs as subsidiaries • transfer of all or part of business • suspension of business for up to six months (including measures at the requirement stage)
(including measures at the recommendation stage)
BIS Papers No 28
263
Improving Transparency of Financial Institutions’ Management Inadequate disclosure and opaque decision making were often cited as reasons for the Korean financial system’s low credibility. Thus, in April 1998, the FSC introduced new disclosure requirements, including mandatory disclosure of information on the value of NPLs, on credit and risk management systems, and on audit results. Six months later, it established unified disclosure standards for financial institutions, stipulating that balance sheet information should be reported twice annually, and it set stronger penalties for false or dishonest disclosures. A quarterly disclosure system 1 for banks was subsequently introduced in September 1999. In all financial institutions, outside directors, of which there should be at least three, should make up at least half of the total membership of the board of directors (Jan. 2000), and an audit committee must be established (Jan. 2000). A system calling for compliance officers was also introduced (Apr. 2000). In order to strengthen accounting standards, the accounting treatment of financial institutions’ holdings of marketable securities has been changed to a mark-to-market system (Jun. 1998-Mar. 2000). Introduction of Financial Holding Companies Legislative provisions for financial holding companies have been introduced to strengthen financial institutions’ competitiveness through enlargement of their scale and scope of business (Nov. 2000). For enforcement of the Financial Holding Company Act, the FSC/FSS introduced the “Regulation on Supervision of Financial Holding Companies” that sets forth authorization criteria for financial companies seeking to become an FHC or a subsidiary of an FHC (Dec. 2000). Since the introduction of the legislation, Woori Financial Group (Mar. 2001), Shinhan Financial Group (Sep. 2001), and Dongwon Financial Group (May 2003) have been established. Improvement of Financial System and Financial Infrastructure for Restructuring The government revised relevant financial legislation, including the Depositor Protection Act, the Act on the Structural Improvement of the Financial Industry, and the Banking Act, to promote financial restructuring at the end of 1997. In consequence, the KDIC and the KAMCO firmly established their presence in the market, and PCA enforcement was strengthened. In January 1997, the government introduced legislation for a capped partial guarantee system that limited the maximum payment payable to an individual depositor to 20 million won, but in December 1997, the deposit insurance system was changed to a blanket guarantee system to soothe the financial instability caused by the financial crisis. However, with moral hazard emerging on the part of financial institutions and their depositors, the deposit insurance system shifted back from a blanket guarantee system to a capped system in January 2001. Meanwhile, when the partial guarantee system was adopted, the maximum amount of payment to an individual depositor was raised from 20 million to 50 million won. In a bid to provide diverse fund-raising measures for financial institutions and corporations, the government introduced asset backed securities (Sep. 1998), mortgage backed securities (Apr. 1999), and a mutual funds system (Sep. 1998). In addition, to strengthen the transparency and the prudential regulation of financial institutions, reform ownership structure, and improve disclosure and accounting systems, the government revised financial legislation to bring it in line with international standards.
III.
Developments and Changes
1.
Enhanced Asset Quality
One of the changes most apparent within the banking system as a whole is banks’ restructured balance sheets.
1
Detailed matters for disclosures include organization and personnel, finance and net losses/profits, sources and uses of funds, soundness, profitability and productivity indicators, management guidelines, and risk management.
264
BIS Papers No 28
Through the injection of public funds for the purchase of NPLs and the recapitalization of banks, along with their own efforts to reduce NPLs, banks’ soundness has been considerably enhanced. As a result, the NPL ratio of commercial banks declined 11.6 percentage points, from 13.6% at the end of 1999 to 2.0% by the end of 2004. The Basel capital adequacy ratio of commercial banks increased from 7.0% at the end of 1997 to 11.3% by the end of 2004. Trend of NPL1 and BIS Capital Adequacy Ratios of Commercial Banks % 1997
1998
NPL ratio
6.1
7.4
BIS ratio
7.0
8.2
1
1999
2000
2001
2002
2003
2004
13.6
8.8
3.3
2.4
2.7
2.0
10.8
10.5
10.8
10.5
10.4
11.3
NPLs are assets that are classified as substandard or below.
2.
Enhanced Profitability
In conjunction with their enhanced asset quality, the profitability of banks has significantly improved. Commercial banks continued to pile up large deficits after the crisis until 2000 because they suffered from the losses incurred by non-performing loans, but they have shown profits since 2001. Strikingly, commercial banks recorded a total profit of 6.4 trillion won and had an average ROA of 0.9% and ROE of 18.0% in 2004. One of the most crucial elements for the improvement of profitability is that it has been possible to reduce new provisions against bad loans. The build-up of interest bearing assets and non-interest income from fees and commissions also contributed to improving banks’ profitability.
Trend of Profitability of Commercial Banks 1997
1998
1999
2000
2001
2002
2003
2004
Net profit (in trillions of won)
–3.9
–12.5
–6.0
–2.8
3.6
3.4
0.7
6.4
ROA (%)
–0.9
–3.3
–1.3
–0.6
0.8
0.6
0.1
0.9
ROE (%)
–14.2
–52.5
–23.1
–11.9
15.9
11.7
2.0
18.0
3.
Increase in Banks’ Share of the Financial Market
Banks were faster off the mark than non-bank financial institutions in resolving bad assets and capitalization, largely because the intensive financial restructuring was undertaken with a focus primarily on banks rather than on non-bank financial institutions immediately after the outbreak of the financial crisis in 1997. As a result, funds in the financial market flowed into banks owing to the public’s renewed heightened confidence in them. Meanwhile, banks increased household lending actively, focusing on housing finance loans backed by housing collateral, which carry a low credit risk and capital requirement burden. Accordingly, the share of loans made by banks in total loans in the financial market rose from 39.2% at the end of 1997 to 71.7% at the end of 2004, while the share of non-bank financial institutions dropped from 60.8% to 28.3% during the same period.
BIS Papers No 28
265
Trend of Bank and Non-Bank Financial Institution Lending In trillions of won, % 1997
1998
1999
2000
2001
2002
2003
2004
Bank
242.9 (39.2)
233.8 (41.6)
273.0 (49.0)
328.7 (57.0)
366.8 (60.0)
516.8 (69.7)
586.5 (71.8)
609.4 (71.7)
Non-bank1
377.5 (60.8)
328.2 (58.4)
283.9 (51.0)
247.6 (43.0)
244.2 (40.0)
224.3 (30.3)
230.3 (28.2)
240.4 (28.3)
Total
620.4
562.0
556.8
576.2
611.0
741.1
816.8
849.8
The numbers within parentheses represent shares in total loans in the financial market. 1
Merchant banking corporations, mutual savings banks, credit unions, community credit cooperatives, securities finance, life insurance companies, postal savings and insurance, investment trusts, and other depository institutions.
There was an underlying shift from corporate lending toward household credits. As a result, the share of household credits rose from 20.0% at the end of 1997 to 55.0% at the end of 2004. Two factors underlie this shift. One is the development of the capital markets and the increasing availability of direct financing for corporations with good credit. The other is the change in the risk appetite of commercial banks. As banks recognized the importance of credit risk management, they sought to reduce loan concentrations by introducing exposure limits on corporate loans. This led them increasingly to emphasize an expansion of their household credits. Trend of Shares by Sector in Bank Lending1 % 1997
1998
1999
2000
Corporate loans Large companies SMEs
63.8 25.0
63.6 22.9
61.9 19.0
56.5 16.3
38.7
40.6
42.9
Household loans
20.0
18.3
34.3
18.1
3.8
2
Others 1
16.3
Excludes trust account lending.
4.
2
2001
2002
2003
2004
48.9 10.4
45.5 7.6
45.6 5.9
43.5 5.4
40.2
38.4
38.0
39.7
38.2
39.0
49.1
52.9
53.0
55.0
4.6
2.0
1.5
1.3
1.4
Loans to public and other legal entities.
Increased Market Concentration Resulting from Mergers
Market concentration has risen greatly due to mergers between banks, but not to such a degree as to raise concern over the weakness of market competition. CR3 (Concentration Ratio 3) rose from 24.7% at the end of 1997 to 48.6% at the end of 2004, but this is still much lower than the 70% level which is the criterion for prohibition of abuse of market dominance. The Hirschman-Herfindahl index (HHI) was 1,209 at the end of 2004, but this is well below the 1,800 which is the United States Department of Justice’s yardstick for a concentrated market.
Trends in Market Concentration Indexes1 of Banking Market2 1997
1998
CR1 (%)
8.9
9.8
11.8
CR3 (%)
24.7
27.0
569
628
HHI 1
Total asset basis.
266
2
1999
2000
2001
2002
2003
2004
13.1
23.2
22.7
21.1
19.5
33.5
35.6
46.4
46.3
49.5
48.6
755
822
1,158
1,185
1,248
1,209
Commercial banks, industrial banks, and agricultural·fisheries cooperatives.
BIS Papers No 28
Despite the rise in market concentration indexes, market competition has been fiercer in some ways due to struggle for market leadership among nation-wide commercial banks. The government, the BOK, and the supervisory agency have continued to pay close attention to the state of market competition, keeping a close eye on the significant changes in the financial landscape brought about by, for example, the birth of megabanks from mergers between domestic banks, or the acquisition of domestic banks by prominent foreign banks.
5.
Increased Market Share of Foreign-Owned Banks
During the restructuring process, the government pursued a policy of encouraging the entry of foreign banks. All the regulatory obstacles that stood in the way of foreign entry have been eased, and as long as foreign banks are able to prove the soundness of their management and funding resources, they can enter the banking industry. In addition, foreign investors, including financial institutions, saw the Korean banking industry as a very attractive market. Thus, since the financial crisis in 1997, there have been frequent cases of foreign capital participating in the domestic banking industry by outright acquisition or by taking a capital stake. There are a number of positive effects of the entry of foreign banks in the domestic banking industry. Even if domestic economic conditions were to deteriorate substantially (e.g. in case of a financial crisis), there would be little possibility of bank runs on foreign banks with high credibility. Furthermore, the presence of foreign banks would reduce the likelihood of hoarding as depositors would be able to transfer their deposits from ailing domestic banks to the large foreign banks. In addition, even in the downturn phase, foreign banks are able to provide credit to borrowers readily thanks to their ability to raise funds from parent banks. Moreover, foreign banks use advanced risk management skills, which are absorbed by domestic banks. They are also likely to stand ready as counterparts when domestic banks want to enter into risk hedging transactions. At the same time, there are some negative effects from foreign capital participation in the Korean banking industry. Foreign banks have a tendency to avoid lending to borrowers with comparatively high risks, such as small and medium-sized enterprises (SMEs) and start-ups. They also tend to emphasize short-term, performance-oriented management due to their focus on stockholder value.
IV.
Future Tasks
Korean banks’ improved profitability is attributable to the recovery of asset quality and the asset growth achieved through early restructuring initiatives. In view of this, it is still too early to say whether their profitability has become stable. For Korean banks to successfully meet the challenges of the ever-evolving financial environment and acquire global competitiveness, much effort and systemic improvement is still needed.
1.
Risk Management and Risk-Based Supervisory Systems
In the new financial setting, a comprehensive management system must be created for the varying credit, liquidity, and market risks, together with other risks. Gaining the confidence of the markets by preemptive action to cut potential losses to investors and other shareholders through improved risk management skills is not a goal but a necessity. This goes hand in hand with the exercise of effective internal controls. Banks need risk management systems that cater to their particular needs. To make risk management effective, management accountability must be specific and clearly spelled out. At the same time, banks need to set up their compensation systems in line with risk management performance. Moreover, they should cultivate the training of professionals capable of designing object-centric databases for the more sophisticated risk management systems. There must be a constant flow of investment to bring together risk management model analysis, regulatory interpretation, and technological expertise. Despite the wide array of measures that have been taken to improve financial supervision so far, the improvement of the supervisory system is a never-ending task. The supervisory system should be
BIS Papers No 28
267
preemptive and risk-based, should allow for early warning, and should be market-friendly. In other words, financial supervision should start with preemptive risk management of financial institutions and markets using forward-looking criteria. Risks detected in the process of monitoring should be grasped swiftly and decisively, and supervisory resources should be reallocated towards those parts of the financial sector where the greatest risks are found to reside. Financial supervision should proceed, in a market-friendly way, with a series of activities such as early detection, accurate assessment, and optimal control of risks exposed in the markets, and should implement prompt corrective measures decisively to avoid failure. The supervisory agency has set year-end 2007 as the target date for the implementation of the new Basel Capital Framework (Basel II), taking into consideration the potential effects of the new accord on the domestic economy and financial markets, and the progress of domestic banks’ preparations for the implementation. All domestic and foreign banks operating in Korea are to come under the new capital adequacy framework. The selection of the methodologies to be used for calculation of the capital requirement is to be left to each individual bank. The implementation of Basel II is expected to upgrade the level of risk management of domestic banks and thereby promote their sound management and competence, along with their financial stability and economic growth, in the long run. However, there are also some concerns about a potential increase of the capital burden on banks, a contraction of financing for SMEs financing and of the securitization market in response to heightened risk management, increasing pro-cyclicality, etc. Taking these concerns into account, the Korean financial authority will deliberate how to set the national discretion items of Basel II when making the national rules for the new accord. These efforts will help minimize the possible negative impacts of Basel II on the domestic financial market. Korean banks have been striving to upgrade their risk management systems and increase their capital levels, aided by improved profitability in the last few years. All in all, the choice of year-end 2007 is expected to give domestic banks sufficient time to cope with these issues and prepare for the full implementation of the new accord.
2.
Business Diversification and Profitability
Banks came to a clear recognition of the importance of sound management in the course of overcoming the financial crisis. Thus, they have since managed their assets with a focus on stability and profitability. The share of household loans rose remarkably, mainly owing to the great expansion of loans secured by housing collateral, while the share of corporate loans, which carry comparatively higher credit risk, dropped. The share of low-risk bonds, such as treasury bonds and monetary stabilization bonds, in total securities investments also rose. Banks’ behavioral changes in asset management contributed to their enhanced profitability and asset soundness. However, these phenomena also raised concerns that the efficiency of funds allocation to the national economy as a whole could be worsened since banks’ assets now suffer from an over-concentration in a specific sector. Accordingly, the function of banks’ fund distribution to the national economy as a whole needs to be revitalized. It is becoming more important for banks to avoid cut-throat competition in specific asset markets and to generate new lucrative business activities by specializing in business areas of comparative advantage on the basis of their business characteristics. For example, it is helpful for large banks to expand their investment banking and international finance business, while small and medium-sized banks should specialize in relationship banking such as lending to SMEs. In addition, the credit derivatives market needs to be galvanized and brought to a level of sophistication where banks can manage credit risk effectively, in line with the implementation of Basel II at year-end 2007. Strategically, banks need to heighten their profitability by securing appropriate interest rate spreads and performing better in terms of fee-based income. Banks not only should step up their credit review and ex post management to prevent additional bad assets, but also be sure to maintain appropriate interest rate spreads that incorporate borrowers’ credit risks. New financial products and services must be developed to provide convenience to customers while improving profitability. Banks should have a system that identifies and discerns customer needs to provide products and services accordingly. For banks to be competitive in today’s market, in which information revolves around the customer, they must develop specific products and carry out marketing initiatives to create more value through deep data mining and customer analysis.
268
BIS Papers No 28
Re-engineering the Malaysian financial system to promote sustainable growth Abdul Ghani Zamani
Introduction The Malaysian financial landscape has undergone continuous transformation in the last decade, driven by financial liberalisation and consolidation, economic transformation, technological advancements and more discerning consumers. The Asian financial crisis has also played a meaningful role in the process. As a result, the Malaysian financial system has emerged stronger and more diversified and competitive since the Asian financial crisis. The first part of this paper examines the Malaysian experience in restructuring and reorganising the domestic financial system in the aftermath of the Asian financial crisis. In the following section, the paper outlines Malaysia’s approach towards post-crisis development of the financial system, highlighting the main changes that have taken place.
I.
Successful financial restructuring since the Asian financial crisis: the Malaysian experience
The Malaysian economy was flourishing prior to the crisis, with strong broad-based economic growth amidst low and stable inflation. Growth in gross domestic product averaged 8% for eight consecutive years, with low unemployment and high domestic savings. Coupled with a strong fiscal surplus and low foreign indebtedness, Malaysia’s economic fundamentals were relatively strong. The banking sector was also at its strongest position following periods of regulatory enhancements. At the time, Malaysia had already complied with 22 of the 25 Bank for International Settlements Core Principles. These developments attracted the influx of capital flows, prompting the government to introduce measures to prevent further overheating in the economy and address the vulnerabilities that emerged. Despite the strong fundamentals and responses of the government, the country was hit by the crisis through contagion. As conditions in the domestic and regional economies worsened, the government took a bold approach by prohibiting the internationalisation of the ringgit and adopting a fixed exchange rate regime to insulate the economy from external uncertainties and further disruptions, hence enabling the government to pursue its domestic agenda. Strategies were targeted at both near-term recovery of the domestic economy and at addressing structural inefficiencies that had emerged in the banking system. On the banking system front, the approach was holistic. Three national agencies were formed to preserve the stability of the entire system. Pengurusan Danaharta Nasional Berhad (Danaharta), the national asset management company, was established in June 1998 to relieve financial institutions from the distraction of rising non-performing loans, enabling them to refocus on their financial intermediary role. Complementing its role, in July 1998, the Corporate Debt Restructuring Committee (CDRC) was formed to act as a platform for faster and more effective debt resolution between corporate borrowers and their creditors. Danamodal Nasional Berhad (Danamodal) was then established in August 1998 to recapitalise viable banking institutions. In 1999, the government embarked on a strategy that led to the consolidation of a highly fragmented domestic banking system, which comprised 71 institutions prior to the crisis, to 30 domestic banking institutions organised in 10 domestic banking groups by 2002. The early and comprehensive intervention proved to be fruitful with the successful closures of the CDRC and Danamodal in 2002 and 2003 respectively. Danaharta also ceased operations by end2005, thereby closing the final chapter of financial restructuring in Malaysia. All three agencies have achieved their mandates successfully, and the use of public funds was contained at below 5% of gross national product. The key to this success has been the timely, prompt and holistic approach adopted that prevented the adverse situation from worsening further. Good coordination between related parties in pursuing the crisis resolution measures, supported by strong and forward-looking leadership
BIS Papers No 28
269
and dedicated political will, entailed positive results to the benefit of the nation. Faced with a changing operating environment amidst greater competitive pressures, the government then began to focus on medium- and long-term development of the financial system, which led to the production of two important blueprints in 2001, outlining broad strategies for the comprehensive development of the financial sector.
II.
Re-engineering the Malaysian financial system: blueprints for development
The Financial Sector Masterplan (FSMP) sets the medium- and longer-term agenda to build a financial sector that is resilient, efficient and competitive, and responsive to the changing economic requirements. In realising the long-term agenda, emphasis was on putting in place the various critical components of the financial sector. By focusing on capacity building among the domestic financial institutions and on strengthening the regulatory and supervisory framework in the initial stage, Malaysia aims to lay a solid foundation on which financial institutions can strengthen and compete effectively amidst further liberalisation without accumulation of risk factors that may adversely affect financial stability and economic growth. In this context, the FSMP spans over three phases, to provide sufficient time for a gradual, sequenced and comprehensive development of the financial sector over the next 10 years, covering the banking sector, insurance sector, Islamic banking sector, development financial institutions, alternative modes of financing and the Labuan International Offshore Financial Centre. Embedded in the Capital Market Masterplan (CMP) is the comprehensive plan for charting the strategic positioning and future direction of the Malaysian capital market for the next decade in supporting the needs and aspirations for national growth. Six key objectives have been identified and form the basis for the CMP’s main strategic initiatives and specific recommendations: (i) transform the domestic capital market into the preferred fund-raising centre for Malaysian companies; (ii) promote an effective investment management industry and a more conducive environment for investors; (iii) enhance the competitive position and efficiency of market institutions; (iv) develop a strong and competitive environment for intermediation services; (v) ensure a stronger and more facilitative regulatory regime; and(vi) establish Malaysia as an international Islamic capital market centre.
III.
Creating a progressive and dynamic financial system that promotes sustainable growth: Implementation of policy initiatives
This section elaborates on four key strategies that were implemented: (i) enhancing financial sector capability in meeting growing demands of the economy; (ii) strengthening the resilience of the financial system to withstand shocks; (iii) enhancing the capacity and efficiency of domestic financial institutions in an increasingly competitive environment; and (iv) enhancing market discipline through the promotion of consumer activism and protection. The final part of the section describes some of the main strategies and initiatives that have been undertaken in the creation of a robust Islamic financial system.
Enhancing financial sector capability in meeting growing demands of the economy As the economy transitions into the next phase of development, the financial structure has to evolve accordingly to support the transformation. It is in this context that Malaysia aims to create a diversified financial landscape that is capable of sufficiently meeting the financial needs of various sectors within the growing economy. Sufficient diversification in the financial system will improve resource allocation and risk distribution within the economy. As financial institutions become more focused, this will encourage greater specialisation within the financial sector, which will facilitate the innovation and cost-effective prices needed by the economy. In the area of bond market development, significant milestones have been achieved on many fronts, particularly in terms of market infrastructure, legal, regulatory and administrative frameworks, as well as development of capital market intermediaries. In the government securities market, reforms were
270
BIS Papers No 28
introduced to achieve market-related pricing in primary issues and to facilitate secondary trading in government securities through enhancements to the principal dealer system, introduction of the Real Time Electronic Transfer of Funds and Securities System, which facilitates real time delivery against payment for electronic book-entry settlements, and issuance of the Code of Conduct and Market Practices for Scripless Securities Market. In the area of the private debt securities market, the Fully Automated System for Tendering was introduced to improve the efficiency of the tendering system, whilst the Bond Information and Dissemination System was established to provide comprehensive market information on domestic debt securities, thereby facilitating efficient trading and enhancing liquidity in the secondary market. Efforts were also focused on creating a reliable market-based benchmark yield curve, for both conventional and Islamic bond markets. Another development was the introduction of new asset classes following the issuance of ringgit bonds by two multilateral development banks and of residential mortgage-backed securities in 2004. Cumulatively, these reforms have enhanced the breadth and depth of the capital market, which accounted for 81% of GDP at end-2004. The range of capital market intermediaries is set to widen in the near future with the creation of investment banks. To pave the way for an accelerated creation of expertise and specialists, higher foreign ownership (of 49%) in the investment banks will be allowed. Focus was also directed towards strengthening the role of development financial institutions (DFIs) in the economy, with special emphasis on strengthening strategic business focus and risk management practices, and formulating the regulatory and supervisory framework. The enactment of the Development Financial Institutions Act 2002 provides a comprehensive legislative framework for the regulation and supervision of DFIs. Today, a total of seven DFIs have come under the purview of Bank Negara Malaysia (BNM). In addition, a review was conducted on the existing mandates, roles and activities of the DFIs to identify gaps and overlaps in the mandated functions of individual DFIs, with a view to streamlining and rationalising these functions, as well as to determine the synergies among the DFIs in undertaking their activities. An efficient, reliable and secure payment system is crucial to the soundness and stability of the financial system and the smooth functioning of the financial markets. In this regard, various efforts have been directed towards improving the efficiency and safety of payment systems. These include initiatives taken by the Bank to migrate users from paper-based to electronic payments; for example, spearheading the development of an Internet-based payment system (known as the Financial Process Exchange), facilitating the extensive deployment of card acceptance devices at government agencies and merchants, and promoting the use of more convenient delivery channels such as automated teller machines (ATM), the Internet and mobile phones in providing payment services. The integrity of the payment system was heightened, particularly with the introduction of chip-based ATM cards and EMV chip-based credit cards. These initiatives were complemented with awareness programmes on payment system issues and continuous efforts to strengthen the consumer protection framework. Amidst increasing globalisation and in line with global efforts to enhance anti-money laundering and counter-financing of terrorism (AML/CFT) measures, the National Coordination Committee to Counter Money Laundering was set up to formulate AML/CFT measures. As secretariat to the Committee, BNM undertakes the co-ordination function for the implementation of the measures and ensures that national efforts are aligned with regional and international initiatives. Following the enactment of the Anti-Money Laundering Act 2001 (AMLA), BNM has been appointed as the competent authority under the AMLA, with effect from 15 January 2002. The Financial Intelligence Unit (FIU) was established within BNM to carry out the functions of the competent authority under the AMLA. The AMLA covers a wide scope of reporting institutions, both financial and those designated non-financial businesses and professions. The AMLA regulatory net will be extended incrementally to other classes in line with the Financial Action Task Force on Money Laundering’s (FATF) 40 Recommendations. Under the AML/CFT framework, financial institutions are required to submit suspicious transactions reporting (STRs) through an online database, whereby financial intelligence on suspected offenses will be disseminated to the appropriate domestic enforcement agency and shared with foreign counterparts. In addition, a comprehensive AMLA compliance framework has been established, encompassing assessment of reporting institutions’ AML/CFT infrastructure, compliance with own internal policies and procedures, adequacy of the “know-your-customer” policy, monitoring of transactions and record-keeping, and detection and reporting of STRs. In recognition of Malaysia’s effective AML/CFT regime, regional bodies such as the Asia/Pacific Group on Money Laundering (APG) and the Asian Development Bank have requested that BNM provide technical assistance to countries in the region. BNM has also shared its experience in establishing the FIU with the State Bank of Pakistan, and has participated as a financial sector expert in various APG AML/CFT mutual
BIS Papers No 28
271
evaluation exercises for member jurisdictions such as Macau, China, Fiji, the Philippines and Pakistan, and in the joint FATF/APG evaluation on the USA.
Strengthening the resilience of the financial system to withstand shocks Maintenance of financial stability remains a key challenge for regulators. While efforts are geared towards achieving greater efficiency and competitiveness within the financial sector, this has to be balanced with the need for protection and stability. Towards this end, the approach to preserving financial stability has been holistic, encompassing micro and macro surveillance, risk-based supervisory frameworks, prudential standards and risk management principles that are aligned with international practices, and financial safety nets. Within BNM, efforts have been focused at enhancing the capacity and skills of personnel involved in regulatory and supervisory activities. As the level of integration between the financial sector and domestic economy, as well as between financial markets, intensifies, the need for competent and skilled personnel becomes critical to not only enable a more effective identification of emerging vulnerabilities but also to ensure effective policy responses. From the surveillance perspective, development of forward-looking surveillance tools and enhancement of stress test methodology are underway to facilitate surveillance activities. A key challenge in the process is access to timely, accurate and relevant data and information, particularly in view of the structural transformation that has taken place in recent years. The emergence of complex structures and financial conglomerates as well as new products complicates the process further. The regulatory approach has begun to evolve from predominantly “rule-based” towards more “principle-based” regulations, which are adaptive to changing market circumstances and business practices, reduce the regulatory burden and do not inhibit innovation and development. As the strength of individual institutions is often the first line of defence against any crisis, focus is increasingly on the need for banking institutions to adopt and promote strong corporate governance, integrity, internal controls and risk management practices. Greater regulatory scrutiny is also undertaken to ensure that the shareholders, boards of directors and management of banking institutions are “fit and proper” and have the capacity to discharge their responsibilities and accountabilities. In line with the rapid structural and operating changes in the domestic financial system, the supervisory approach has evolved significantly to adapt to the increased complexities and enhance the effectiveness of supervision. Supervisory activities are now premised on a rigorous riskbased framework which provides for a structured and forward-looking approach in assessing banking institutions’ risk profiles and the effectiveness of risk management systems. With this forward-looking methodology, Bank Negara Malaysia is able to allocate resources optimally in supervising the institutions, focusing on key risk areas. The increasingly complex group structures involving financial conglomerates have called for the development of consolidated supervision framework to ensure balance between allowing group synergy and efficiency, and ensuring that the financial conglomerates do not introduce excessive risks to the overall system. The proposed framework emphasises developing prudential guidelines and principles to ensure that the financial holding companies are financially strong and able to lend support to their subsidiaries. The framework focuses on five main areas; group structures, corporate governance, risk management, intra-group exposures and reporting requirements. In coming years, due focus will continue to be placed on aligning prudential regulations to international standards. An example is the International Accounting Standards (IAS 39) which is set to be implemented in Malaysia as a Financial Reporting Standards (FRS 139) for financial institutions. Its implementation is, however, not without its challenges, given the intricacies involved, in which dedicated and experienced personnel are required to ensure a smooth and swift transition. In the context of emerging economies, issues relating to volatility in income statements arising from short-term market fluctuations, lack of data availability and integrity, as well as deep and liquid markets for accurate and reliable valuations, pose great challenges to the regulator and banking institutions. Therefore, the capabilities of regulators, supervisors and external auditors to assess the robustness of financial institutions’ adopted methodologies and controls need to be enhanced to ensure that the use of fair value accounting will be managed, monitored and reported in a sound manner, and to enable effective assessment of financial institutions’ risk management control and systems.
272
BIS Papers No 28
With regard to Basel II, Malaysia has specified two implementation dates: January 2008 for the Standardised Approach and January 2010 for the Internal Ratings Based (IRB) Approaches (for credit risks). Banking institutions implementing the standardised approach in January 2008 (for credit risks) would also be required to adopt the simpler approaches for operational risks, either the Basic Indicator Approach or the Standardised Approach. The implementation approach is based on four underlying implementation principles: (i) gradual enhancement to risk management standards within the industry; (ii) flexible timeframe to accommodate capacity building measures; (iii) the adoption of advanced approaches should not be mandated by BNM; and (iv) development of more effective and rigorous supervisory processes to support the implementation of advanced approaches. Whilst the adoption of advanced approaches under Basel II may take longer in most emerging markets, the emphasis on having robust internal credit rating systems will provide the basis for greater improvement in risk management standards over the long term, particularly in terms of product pricing, portfolio management and new business development, where decisions will have to be made based on riskadjusted returns and capital considerations. This will ultimately promote greater convergence of regulatory and economic capital in the longer term. Malaysia now has a deposit insurance system following the commencement of operations of the Perbadanan Insurans Deposit Malaysia (PIDM), an independent statutory body established to administer the deposit insurance system on 1 September 2005. The system is funded by annual premiums from member institutions, where a flat rate will be imposed for the initial two years of its implementation. Thereafter, a risk differential premium framework will be implemented, consistent with the mandate of PIDM to strengthen incentives for sound risk management of its member institutions.
Enhancing the capacity and efficiency of domestic financial institutions amidst intensifying competition Conscious efforts were directed towards narrowing the performance gap between domestic and foreign financial institutions. The ability of domestic financial institutions to compete effectively on a level playing field with foreign players is a vital prerequisite for ensuring a smooth transition towards greater liberalisation in the financial sector without accumulation of risks that may undermine financial and economic stability. The industry-wide consolidation exercise which was completed in 2002 provided the basic foundation for subsequent capacity building and efficiency improvement initiatives to allow the merged entities to strengthen capacities and benefit from greater group synergies. Measures were implemented to facilitate the rationalisation of common functions within the groups and the offering of various financial services under one common brand through cross-selling. Legislative changes were also instituted to allow the conduct of commercial banking and finance company operations under a single legal entity. Banking institutions were also allowed to outsource non-core functions to third-party service providers subject to certain prudential safeguards, hence freeing up resources for more efficient use. As domestic banking groups have capitalised on the flexibility, new operating models have begun to emerge, with branch set-up reconfigured, leading to the creation of specialised business centres offering specialised and customised products and services to cater to the needs of specific market segments. Technological advancements have also facilitated enhanced delivery channels through increased usage of ATMs and other electronic tellers, as well as communications-based banking such as round-the-clock and more efficient banking services. As risk management and product development capabilities were enhanced amidst greater pricing flexibility, the market has now begun to see the proliferation of specialised and new products such as structured investments, micro-financing and more SME-related financing instruments. In line with efforts to strengthen revenue capacity and promote business differentiation, banking institutions have formed strategic alliances with other types of financial institutions. This has resulted in the growth of bancassurance and asset and wealth management activities. Malaysian banking institutions have also undertaken steps to strengthen their commercial presence in the region either through partnerships or alliances with foreign financial institutions abroad to tap the greater opportunities arising from the growth in intra-regional trade. Currently, the domestic banking groups have presence, in the form of branches, representative offices, subsidiaries or joint ventures, in 19 countries.
BIS Papers No 28
273
The continuously evolving financial landscape requires the availability of highly skilled and agile senior management to drive the strategic direction and position their institutions to maximise the opportunities presented by the changing environment. This is more pronounced in the context of a developing economy where talent and skills are scarce resources. To accelerate the development of intellectual capital and managerial capabilities of senior management in the financial sector, the International Centre for Leadership in Finance (ICLIF) was established in 2003. Focusing on senior management capabilities, the ICLIF complements the technical training programmes undertaken by the Malaysian Banking Institute. Activities conducted by the ICLIF include forums, seminars, training and education programmes with strategic alliances and collaborative arrangements with renowned institutions of higher learning from abroad.
Enhancing market discipline through consumer and shareholder activism and consumer protection Maintaining financial stability and development of the financial sector are shared responsibilities of all stakeholders. To facilitate the role of stakeholders in fulfilling their responsibilities and in making informed decisions, enhancements were instituted to improve the transparency, comparability, relevance and timeliness of information relating to financial institutions’ operations and financial conditions and to strengthen corporate governance standards within the banking institutions. Meanwhile, continuous effort have been placed on educating shareholders about their roles and responsibilities whilst enhancing the effectiveness of the boards of directors and management beyond tactical performance. The other powerful stakeholder that has a key role in fostering development, innovation and market discipline within the financial sector is the consumers. To empower them with greater responsibility, focus was accorded to elevate the level of education and financial literacy through a structured consumer education programme. Launched in 2003, the programme, known as BankingInfo, is aimed at promoting greater financial literacy among the public and enhancing their understanding of the roles and functions of the different segments in the financial system. Initiatives under the programme are undertaken through various channels, including information booklets in multiple languages (recognising the diversity of the population) and an information website which serves not only as a source of information but also facilitates comparison shopping by consumers. Although the empowerment will take some time before realising its full impact, today consumer demands have grown increasingly complex and sophisticated along with growing affluence. BNM has also announced the establishment of the Credit Counselling and Debt Management (CCDM) agency, to be operational in 2006, which marks another milestone towards the development of a comprehensive consumer protection infrastructure. By providing credit counselling and debt management for individuals with difficulties meeting their financial commitments, the agency will also undertake activities to educate consumers on financial and money management. The institutional arrangement would provide prompt and cost-effective means of debt settlement for housing loans, hire purchase, credit card and personal loans through out-of-court procedures based on agreed repayment plans between creditors and debtors. In the long run, the agency will support the domestic-driven growth strategy pursued by the country. While entrusting consumers with the larger role, equal emphasis was placed on ensuring they have access to redress mechanisms to preserve confidence. The Financial Mediation Bureau (FMB) was established in 2005 as a one-stop centre for formal and administrative redress relating to a broad range of retail consumer complaints against financial institutions under BNM’s purview, i.e. banking institutions including Islamic banks, takaful (Islamic insurance) operators, development financial institutions, selected payment system operators, and non-bank issuers of credit and charge cards.
Evolving a robust Islamic financial system In the early years, focus was placed on developing a comprehensive domestic Islamic financial system as a viable alternative to support economic growth. Initiatives were therefore directed towards developing the players and the key structural components in the system, comprising the Islamic banking industry, the takaful industry, and Islamic interbank and capital markets. Emphasis was also placed on building a robust financial infrastructure to support the progressive development of the Islamic financial system, which includes an effective legal and shariah framework, progressive and
274
BIS Papers No 28
dynamic Islamic financial markets, effective and stable payment and settlement systems, and a robust regulatory and supervisory framework. The rapid evolution of the domestic Islamic financial system has set the stage for its global integration. Strategies have now shifted towards developing Malaysia as an international Islamic financial hub that will have a greater role in facilitating international economic and financial flows. In 2004, the landscape for Islamic finance was broadened following issuance of three new Islamic banking licences to foreign Islamic financial institutions. In line with measures to promote foreign participation and the transfer of knowledge and expertise, foreign equity participation of up to 49% has been allowed in Islamic banking subsidiaries and new takaful companies in Malaysia. Initiating efforts were also undertaken in close coordination with the Islamic Development Bank to promote takaful and re-takaful businesses among member countries of the Organisation of the Islamic Conference. A further initiative by Malaysia to develop the international Islamic financial market was through the inaugural primary issuance of a global sovereign Islamic sukuk in 2002, which has broadened the investor base by creating a new asset class for both Islamic and conventional investors. Malaysia is also the host country for the Islamic Financial Services Board (IFSB), established in 2002, which was a milestone achieved in the development of international prudential standards for Islamic finance. One of the key challenges faced in developing the domestic Islamic financial system is having a sufficiently large pool of talent and professional skills to drive innovation in products and services and sustain its competitive strength. In this regard, an industry-owned research and training institute in Islamic banking and finance, the Islamic Banking and Finance Institute Malaysia (IBFIM), was established to spearhead greater collaborative efforts with universities to undertake research in areas that are key for the progressive development of the Islamic financial industry. BNM has also strongly promoted intellectual discourse on Shariah issues to promote rapid growth of Islamic financial products and services. Moving forward, Malaysia and other OIC countries are collaborating with the IDB and the IFSB to formulate a 10-year masterplan to provide a road map for greater convergence towards the common vision among countries in the development of the international Islamic financial system.
IV.
Moving forward: challenges facing BNM amidst greater financial development and integration
Like other emerging economies, Malaysia faces a multitude of challenges in its efforts to achieve a progressive and dynamic financial system. Balancing between financial stability on one side and monetary and economic stability on the other will become more challenging, particularly as the domestic economy becomes more interconnected and integrated with other economies and financial systems. In this environment, the responsibility of maintaining financial stability will become a collective effort extending beyond the national boundary, and require greater collaboration among countries.
References 1.
Bank Negara Malaysia website - Publications (BNM Annual Reports, The Financial Sector Masterplan, The Central Bank and the Financial System in Malaysia - A Decade of Change 1989-1999) http://www.bnm.gov.my/index.php?ch=11.
2.
Securities Commission website - The Capital Market Masterplan http://www.sc.com.my/.
3.
Pengurusan Danaharta Nasional Berhad - Annual Report 2004 http://www.danaharta.com.my/.
BIS Papers No 28
275
The Mexican financial system: reforms and evolution 1995-2005 José J. Sidaoui 1
I.
Background: the banking crisis of 1995
The Mexican banking crisis of 1995 contained many of the same characteristics as other banking crises: a massive expansion of credit in a short period of time, poor bank management, supervisory and regulatory loopholes, and a shock (both domestic and external). The perverse incentives created by a quasi-fixed exchange rate regime contributed to the onset of the crisis. However, the weakness of the financial system and loopholes within the regulatory and supervisory frameworks exacerbated its aftermath. The experience has provided important policy lessons. We divide the different factors that triggered the crisis and were responsible for its severity into the following categories: the macroeconomic environment, the incentives’ structure faced by economic agents, and the legal and regulatory framework.
I.1
The macroeconomic environment
Financial deregulation, the signing of NAFTA at the end of 1992, and the fact that inflation had achieved single digits during 1993 and 1994, 2 induced an impressive sum of capital inflows into the country. While in 1988 there was a net disinvestment of 2.6 percent of GDP, by 1993 Mexico’s capital inflows amounted to around 34 billion dollars, equivalent to 9.3 percent of GDP. About 84 percent of capital inflows entered in the form of portfolio investments, which made inflows more volatile and highly sensitive to macroeconomic variations. In fact, the predetermined exchange rate policy led speculators to foresee “one-sided bets”. Capital inflows produced a real exchange rate misalignment. At the same time, the economy was experiencing a consumption and investment boom in the non-tradables sector. The latter was reflected in an unsustainable current account deficit. Finally, an asset price bubble emerged which, in turn, attracted more short-term capital flows and the vicious cycle continued to feed on itself until it became unsustainable. The situation deteriorated further when the Federal Reserve decided to tighten its monetary policy and Mexico was subject to several political shocks. Domestic capital flight eventually drained the central bank’s foreign reserves completely, forcing the abandonment of the quasi-fixed exchange rate regime at the end of 1994. The collapse of the Mexican peso in December 1994 resulted in a more than 100 percent devaluation of the exchange rate. As a result, inflation skyrocketed from one digit to more than 50 percent, and nominal interest rates reached almost 100 percent. The real economy plunged, real wages collapsed and unemployment increased. GDP fell more than 6 percent during 1995. Firms and households were overwhelmed by the increase in interest rates to levels hovering at around 100 percent, accelerating the rate of debt amortization. The concurrent decline of real income also raised the debt burden. Banks suffered on both sides of their balance sheets. On the asset side, the amount of non-performing loans increased sharply, especially those denominated in foreign exchange. On the liability side, depositors demanded higher interest rates to keep their money in banks. Moreover, many Mexican banks required assistance to honor their foreign currency obligations.
1
Deputy Governor, Banco de México. The opinions expressed in this paper are the author’s and do not necessarily reflect those of the Banco de México.
2
In 1993 and 1994, inflation in Mexico was 9.7 and 6.9 percent, respectively.
BIS Papers No 28
277
I.2
The incentive structure
The crisis was preceded by a period of financial deregulation and abundant liquidity which led to a rapid surge in credit to the private sector. Banks did not take proper consideration of provisioning of credit risks. Domestic banks ended up with riskier loan portfolios, while low-risk firms had access to cheaper dollar financing from foreign banks. The increase in credit risk led to a rise in non-performing loans within the banking system. The unlimited deposit insurance scheme, which protected all banks’ liabilities without any restriction, induced moral hazard and increased the cost of banking resolution. Poor banking supervision, faulty accounting standards, the lack of proper credit controls and the absence of a risk management culture contributed to the severity of the banking crisis. Poor banking skills and conflicts of interest played an important role in the assessment and allocation of bank credit in the years that preceded the crisis. La Porta et al. (2003) analyzed the consequences that related lending had in the crises of 1994. Their conclusions reveal that: (1) related lending accounted for a large proportion of banking business; (2) once the crisis emerged, banks that would eventually go bankrupt tended to increase their holdings in related lending loans; (3) related loans had better terms than unrelated ones; (4) related loans had much higher default rates than unrelated ones; and (5) the worst loans were those given to individuals and firms with the closest links to the individuals who controlled the banks. These conclusions demonstrate that related lending was an important cause of banks’ fragility in 1994. In short, excessive credit expansion, poor bank management and an excessive related lending rate contributed significantly to the severity of the crisis. Interestingly, banks had demonstrated signs of weakness that were not recognized by the authorities in time. The drawbacks of financial authorities are explained in the next section. The lack of appropriate banking rules, combined with weak supervisory practices, prevented financial authorities from detecting the fragility of the banking system before the crisis. For example, prior to 1994, the banks’ accounting policies were not in line with international standards. A clear example was the policy of recording as non-performing loans exclusively the amount of payments due for more than 90 days, rather than the total amount of the outstanding loan. The ratio of past due loans to total loans had increased significantly before the crisis took place. However, this ratio underestimated the true figures due to faulty accounting standards. A related consequence was the lack of proper provisions for loan losses recognized by banks and, hence, the false perception of the existence of strong bank capital that could be used to confront eventualities.
I.3
The legal and regulatory framework
The Mexican banking crisis revealed the frailty not only of regulations, but also of the legal framework. Many loans were written off because of issues directly related to the inefficient judicial and regulatory procedures that involved the recovery of loans from bankrupted companies. The legal framework proved to favor debtors over creditors. Thus, it was not surprising to observe an excessive number of companies filing for bankruptcy, even when they were not in financial distress. Legal disputes were time consuming. In many cases, these processes took many years to be resolved. Moreover, creditors were required to take their claims to judicial instances as voluntary agreements between debtors and creditors were prohibited. Some analysts have suggested that the banking credit stagnation that persisted for several years after the crisis can be partially explained by the weakness of the legal and regulatory frameworks coupled with the lack of proper guarantees for creditors to mitigate their risks. Once the banking crisis erupted, financial authorities confronted significant legal barriers when it came time to intervene and take possession of ailing banks. The legal framework prevents financial authorities from taking actions without giving banks’ shareholders the right to a hearing. Banks’ shareholders could also seek protection from the courts to stop any supervisory measures against their interests. Therefore, the legal framework barred authorities from acting more expediently, and oftentimes forced them to negotiate the friendly takeover of troubled banks with shareholders. The next section describes the different measures taken by the government and Congress during the years that followed the Mexican banking crisis of 1995. An explanation is provided of the different laws and regulations that have been amended, as well as the ones enacted.
278
BIS Papers No 28
II.
The reforms
It should be pointed out that, in banking crises of the same magnitude as the Mexican one, authorities have to react to events as they take place. In other words, there is not much time for planning ahead. Leaving aside debtor programs, the aim of the majority of the reforms was to realign the incentives faced by creditors, debtors, shareholders, bank managers and financial authorities. The most important reforms can be classified as those geared towards: (1) stabilizing the economy; (2) realigning the incentives faced by debtors, creditors and authorities; and (3) strengthening the legal and regulatory framework.
II.1
Stabilizing the economy
A comprehensive macroeconomic stabilization program was implemented after the banking crisis. One of the goals of the program was to stabilize the economy in as quick and orderly a wayas possible. The policies and programs put in place allowed for a significant recovery of economic activity and inflation resumed its downward trend. It is clear that the two pillars for macroeconomic stability have been fiscal and monetary policy. Significant progress has been made in both areas in recent years. Such policies focused on maintaining sound public finances and abating inflation. In this setting, the importance of adopting a floating exchange rate regime must also be highlighted, since it has allowed the nominal exchange rate to adjust much faster to different shocks. This has also reduced the vulnerabilities of the Mexican economy. Fiscal policy The public sector deficit has narrowed considerably, from a double-digit percentage of GDP in the 1980s to an expected figure close to 0.3 percent of GDP in 2005. Including other items that are usually excluded from the traditional fiscal accounts - such as PIDIREGAS, IPAB and FARAC liabilities - this broad definition of the public sector deficit is expected to be below 2.5 percent of GDP in 2005 (Graphs 1 and 2). Graph 1
Graph 2
Fiscal deficit
Public sector total debt1/ and inflation
Percentage of GDP
Percent 17.0
100 90
PSBR
80 70
9.0
Public Sector Debt
60
100
20
0
0 2004
10 2001
40
1998
20
1995
60
1992
30
1989
80
1986
2005*
2002
1999
1996
1993
1990
1987
1984
1981
-3.0
140
40
1983
1.0
160 120
Inflation rate
50 5.0
200 180
Debt + Contingent Liabilities 2/
1980
Percent of GDP
13.0
Economic Deficit
Annual percent
Percentage of GDP
* Estimated by Ministry of Finance in Criterios Generales de Política Económica 2006. 1/
Data corresponds to the definition of broad net economic debt published by the Banco de México, which includes net liabilities from the federal government, institutions and enterprises, development banks and other public sector non-bank 2/ financial intermediaries. Since 1994, the following contingent items were included in the definition of broad net economic debt: IPAB, FARAC, direct PIDIREGAS, debtor support programs and UDIs restructuring programs.
BIS Papers No 28
279
In particular, authorities have pursued the following goals: (1) improving the debt amortization schedule; (2) reducing financial costs; (3) minimizing the vulnerability of public finances to changes in interest rates and to exchange rate fluctuations; (4) relying more on local currency debt; and (5) mitigating any possible unexpected adverse effects of a sudden capital reversal. Appropriate management of public finances and the lower and sustainable levels of public indebtedness have enabled monetary policy to abate inflation. This has contributed to the development of domestic securities markets, allowing for the issuance of long-term fixed interest rate instruments (Table 1). This contrasts significantly with the structure of public debt observed in the late 1990s, when debt instruments were mostly short term or indexed to short-term interest rates or inflation. These factors have allowed the federal government to rely less on external debt markets. Since 2001, the federal government has financed its fiscal deficit totally through the domestic market. In recent years this strategy has been enhanced, and public sector foreign debt has been reduced considerably. In particular, federal government external debt decreased from 19.3 percent of GDP in 1998 to 9.4 percent in 2005. Table 1 First issuance of fixed interest rate bonds
Date
3 years
5 years
10 years
20 years
Jan 2000
May 2000
Jul 2001
Oct 2003
Monetary policy The main goal of the Banco de México’s monetary policy was to regain public confidence and pursue price stability. Hence, the central bank made important efforts to improve its transparency, communication with the public and accountability. Among the most important elements of the Banco de México’s new policy was the publication of: •
The level of foreign reserves.
•
Daily publication of the monetary base.
•
The implementation of monetary policy under transparent measures that are based on a strategy of communicating the monetary authority’s targets, plans and decisions.
•
The systematic assessment of the sources of inflationary pressures to evaluate the future path of inflation.
•
The use of alternative measures of inflation, such as core inflation, to identify the mediumterm trend of inflation. Graph 3 Inflation: observed and target, 1995-2005
Graph 4 91-day Cetes interest rate
Annual percent
Annual percent
60 50
Annual inflation
80
Inflation target
70
Upper bound
42
60
Lower bound
40
50
30 20 10
40
20.5
30
15
12 13 10
20
6.5 4.5
0 Jan-95 Jan-97 Jan-99 Jan-01 Jan-03 Jan-05
280
10 3+/-1
0 Jan-95 Jan-97 Jan-99 Jan-01 Jan-03 Jan-05
BIS Papers No 28
Adoption of a floating exchange rate regime The Exchange Commission decided that from the end of 1994, the exchange rate would be determined freely by the market. A floating regime simplifies monetary policy management because it allows the exchange rate to adjust rapidly to domestic and external shocks, such as changes in international interest rates and in the terms of trade. Such conditions allow the economy to adjust to such shocks more easily. The floating regime makes it unlikely that the exchange rate will move considerably away from levels that are congruent with the country’s fundamental economic conditions. Moreover, it also discourages short-term foreign investments because investors no longer have a promise from the Central Bank to provide dollars if they want to get out of peso securities. The adoption of the floating exchange rate regime has allowed the exchange rate to adjust more rapidly to different shocks. As a result, real shocks are now absorbed by the economy more through nominal exchange rate movements and less through changes in inflation. This has led to a more efficient adjustment mechanism and to a reduction in the exchange rate pass-through to CPI inflation. The fact that the exchange rate may fluctuate in any direction reduces speculation in financial markets and helps to de-link price formation in the economy with high frequency movements in the exchange rate. In this sense, monetary policy has gradually become the nominal anchor of the economy. There is no doubt that the success of Mexico’s floating exchange rate regime has relied heavily on a deep and liquid foreign exchange rate market. Daily trading in the Mexican exchange rate market accounts for an average of 18.1 billion US dollars, both in the swap and spot markets (Graph 5). The gradual improvement in macroeconomic stability has allowed for a significant reduction in the volatility of the peso-dollar exchange rate, similar to that of the main currencies (Graph 6). Graph 5
Graph 6
Peso/US dollar daily average volume traded in the OTC market
Volatility implicit in peso/US dollar options in the OTC market
Billions of US dollars*/
ATM 1 Month
27
40%
24
35%
21
30%
EUR
JPY
MXN
18 15
25%
12
20%
9
15%
6 3 Jan- Jul- Dec- May- Oct- Apr- Aug97 98 99 01 02 04 05
10% 5% Jan- Jan- Jan- Jan- Jan- Jan- Jan- Jan98 99 00 01 02 03 04 05
*/ 20-day moving average.
Development of derivatives markets One of the problems that became evident after the crisis was the lack of financial instruments and markets to allow participants to diversify and cover their risks. A first step towards promoting both, instruments and markets was the modification of the procedures to calculate market-reference interest rates in 1995. Hence, the so-called TIIE substituted the previous rate, known as the TIIP. The Mexican Derivatives Exchange (MexDer) began operations in 1998 as a self regulatory entity. The majority of its operations are linked to TIIE futures contracts.
BIS Papers No 28
281
Increase in derivative instruments traded in exchanges (e.g. the Chicago Mercantile Exchange, MexDer) and OTC markets has favored the development of foreign exchange rate and debt markets, providing commercial banks and investors in general with a wide range of low-cost alternatives to manage their market risks; thus, the development of derivatives markets has completed financial markets and fostered efficient risk allocation through the economy. Development of long-term investors In 1996, pension fund legislation was enacted in order to regulate private savings for retirement. Pension fund managers (Afores) were created to invest money in these funds. These intermediaries are subject to strict regulation concerning their investment regime. Initially, they were only allowed to invest in government securities. Subsequently, Afores were allowed to invest in high-quality corporate and bank bonds as well as in structured securities linked to a securities exchange, but were protected from principal losses. During the same year, banks and brokerage houses were authorized to operate derivatives. More recently, other financial intermediaries, such as mutual and pension funds, were also given permission to operate these instruments. Increased transparency in primary and secondary securities trading In 1997 and 2001, improved auction rules for government securities were established to make the process more simple and transparent, as well as to enhance competition among participants. An electronic system to conduct primary auctions made the bidding process more efficient and enabled the central bank to process and publish the auction’s results faster, thus enabling insurance companies, mutual and pension funds to participate. The time span between the auctioning process and the announcement of results was reduced to 90 minutes. Even though the government has the right to reject bids at the primary auction, it has seldom exercised this right. The last time bid results were rejected was in early 1995 and then again in September 1998, at the height of the Russian crisis. The government announces its issuance program on a quarterly basis. This announcement lists the securities to be auctioned each week during the upcoming quarter, and the minimum amount offered 3 by each type of security. To facilitate accurate price discovery in trading debt securities, regulations were introduced in 1997 to oversee the establishment of voice and electronic inter-dealer brokers. These rules set up a framework for procedural requirements, trading models and safety protocols to ensure that these systems performed as they should. Measures to increase liquidity in secondary markets Price vendors were authorized in 1998, in accordance with international practices and to avoid potential conflicts of interest among financial institutions, which have to mark securities to market. The figure of primary dealer, or market-maker, was introduced in 2000. Its objective is to enhance the liquidity of fixed rate securities in secondary markets by making continuous bid-ask offers in exchange for certain privileges, such as bidding for additional securities at the auction’s average price results once they are known. Liquidity in short-term zero coupon bills (Cetes) and fixed-coupon bonds (Bonos) increased substantially after 2000. In order to promote mortgage credit and a secondary market for these products, banks were allowed to issue “certificados bursatiles bancarios” that contain similar characteristics of banking bonds. These securities can be issued directly by banks or through a trust and can be used in repo and security lending operations. Because it is important that pension funds adopt recent risk management trends and in order to promote a more diversified and secure portfolio, these intermediaries can operate derivatives and invest in foreign securities of up to 20 percent of their total assets. In 2005, repo rules were standardized for banks, broker houses, mutual funds and pension funds. The primary changes were: (1) banks, brokerage houses and pension funds are allowed to do reverse repos with foreign entities; (2) repos with private securities are allowed; (3) Some amendments to
3
Price discovery is the process of establishing a market price at which demand and supply for an item are matched. By bringing buyers and sellers together and making the process transparent, financial markets facilitate price discovery. IMF, 2004, Compilation Guide on Financial Soundness Indicators, IMF, Washington DC, Appendix VII, Glossary.
282
BIS Papers No 28
master agreements were implemented; and (4) financial participants are required to guarantee repo operations between themselves and with their institutional investor counterparties. Table 3 shows how repo operations have had a huge positive trend in recent years. In 2004, the Banco de México, as a financial agent of the federal government, published a new regulation that authorized “boot stripping” in some government securities (fixed rate bonds, “Bonos M” and inflation indexed bonds). This regulation allows coupons to be traded separately from principal as zero coupons.
II.2
The realignment of incentives
During the 1990s, banks encountered a series of perverse incentives that fostered both moral hazard and adverse selection problems. Full protection of depositors, poor information disclosure, the lack of proper credit information systems and underestimated capital requirements kept banks from selfdiscipline and promoted a distorted and poorly assessed allocation of credit and the taking of excessive risk, which eventually led to a loan portfolio deterioration. The onset of the crisis underlined the importance of the creation of proper incentives that promote market discipline and mitigate moral hazard behavior. As a result, both legislative and supervisory authorities promoted a series of reforms and initiatives intended to realign such incentives. Limits to deposit protection insurance Prior to the reform of the deposit insurance program, the government provided full and implicit coverage to all types of bank liabilities. Deposit protection was reduced gradually in terms of both the amount and type of liabilities covered. In January 1999, the Law for the Protection of Bank Savings was enacted by Congress, which created a new governmental organization known as IPAB. 4 This law establishes an explicit deposit insurance scheme 5 and supports programs that seek to provide aid to banking institutions in financial distress. 6 The reform introduced a limited deposit coverage of 400,000 Udis 7 (approximately 130,000 US dollars) per person, per institution. Deposit insurance is compulsory for all banks, with premiums paid in relation to the amount of each bank’s total liabilities. 8 Information disclosure After the crisis, disclosure requirements were increased in order to enhance market discipline. In 2003, the CNBV (the National Banking and Securities Commission) issued a regulation 9 that standardized and regulated the dissemination of banks’ financial information. The new information disclosure requirements focus on changes to banks’ financial statements, derivatives, investments, financial performance ratios, loan portfolio ratings, capital ratios, net worth, VaR measures and internal control systems. Credit bureaus The literature that addresses the benefits of credit information systems, commonly known as credit bureaus, is relatively abundant. Credit bureaus prevent adverse selection problems and moral hazard behaviors that arise as a result of information asymmetries (Pagano et al., 1993). On one hand, creditors with access to historical information on debtors’ behavior can discriminate, diminishing the risk of adverse selection and, thus, pricing their loans at lower rates. This is important for debtors as well, since good debtors would not have to pay rates that incorporate the risks related to bad debtors’
4
IPAB stands for Instituto de Protección al Ahorro Bancario (Bank Savings Protection Institute).
5
Article 6.
6
Article 28.
7
UDIS are inflation indexed units of account.
8
Banks must pay a premium of 4 per thousand on the outstanding amount of protected deposits.
9
“Disposiciones de carácter general aplicables a la información financiera de las instituciones de crédito”, CNBV, June 2003.
BIS Papers No 28
283
behavior. On the other hand, debtors who have failed to honor their debts will have a negative record with the credit bureaus. This will have a dual impact, creating incentives to discipline debtors while at the same time contributing to the mitigation of the moral hazard problem. An additional argument in favor of credit bureaus is that they generate transparency for both creditors and debtors, since debtors can access their credit reports and certify their veracity. In Mexico, there are two public central registries for bank credit. One registry is held by the central bank and is known as SENICREB (National Banking Credit Information Service). Banks and other financial institutions, such as financial factoring companies and leasing companies, report all of their credit exposures to SENICREB on a monthly basis. However, only credits greater than 200,000 pesos are reported on an individual basis, whether the credit is granted to firms or individuals. The information required for each major borrower includes: the debtor’s identification, productive activity, tax identification number (known as RFC), geographical location, business activity, risk rating (from A to E according to the assessment performed by each of the three major ratings agencies), outstanding credit lines, the amount of each outstanding line (broken down by past due loans and performing debt) and, finally, the currency in which the loan was granted. Data received can be redistributed back to the reporting institutions upon request. Reporting institutions do not require authorization from the client to request information contained in SENICREB. The second public central registry for bank credit is managed by the CNBV and is known as R04. This registry receives information on commercial loans from banks and credit unions, although it will soon receive information from other financial institutions as well. The information contained in R04 is extensive and includes: credit line and number, accounting and legal classification, amount outstanding, date of origination and maturity, amortization schedule, currency, interest rate, unpaid accrued interests, refinanced and capitalized interests, restructuring, risk rating based on the CNBV’s methodology and provisions for losses, collateral or guarantees. The information is available to all supervisory authorities. Public credit registries are primarily used for research and statistical purposes by financial authorities, and do not contribute significantly to the selection of debtors by financial institutions. The fact that these registries do not provide credit bureau services has reduced the entry barriers for private credit registries. Two private credit registries have emerged since the banking crisis: Buró de Crédito and Círculo de Crédito. The former began operations in 1996 and compiles information on individuals and firms. The latter began to operate this year and only provides information on individuals. Access to information is restricted to those firms that share their databases with a credit bureau. However, consumers can access their own information free of charge once every year. Both of these companies are subject to the Law Regulating Credit Information Societies, last amended in 2004. The central bank has issued the General Rules for Operations and Activities of Credit Bureaus and Their Users, which provides a regulatory framework for activities carried out by this type of firm. Capital adequacy rules As of 2000, capital adequacy regulation has gradually been made stricter. The most important modification is the obligation for investments in financial subsidiaries and non-financial firms to be deducted from banks’ capital when they represent more than 15 percent of a firms’ equity. Deferred tax assets cannot exceed 20 percent of banks’ Tier 1 capital. Likewise, subordinated debentures or capital instruments cannot exceed 15 percent of Tier 1 capital. Recapitalization: eliminating limits to foreign ownership The new capitalization rules put an end to several facilities that were given to banks after the crisis. Banks’ shareholders were forced to put more resources into their banks. The size of the resources required convinced authorities of the need to relax the remaining restrictions on foreign ownership. Mexican banks were privatized during the early 1990s, but at that time no person was allowed to own more than 10 percent of ordinary shares (banks had to be widely held) and foreign participation was limited to 30 percent in any single commercial bank. In 1992, changes to the regulations allowed more foreign participation. In 1994, under the North American Free Trade Agreement (NAFTA), whollyowned subsidiaries were allowed, but were nonetheless limited to non-systemic banks. Their aggregate share in the banking system was also limited to 8 percent, and a time frame was established to gradually reduce these limits during the following six years.
284
BIS Papers No 28
After the Mexican crisis, the need to recapitalize banks led authorities to ease restrictions; yet foreign majority ownership was not permitted for the three largest banks. In 1999, all foreign ownership restrictions were removed for banks established in countries with which Mexico had free trade agreements. Recently, the Banking Law was amended so that there are now no ownership restrictions whatsoever on either domestic or foreign individuals owning a bank, as long as they have authorization from the Ministry of Finance. In order to get this authorization, they must comply with certain requirements established by law. Accounting standards In 1997, accounting standards were reviewed and amended to bring them in line with international criteria. Among the most important changes were: securities’ classification in accordance with their acquisition purpose, marking to market all trading assets and the introduction of the concept of fair value. Another important amendment requires financial entities to register past due loans, considering both the loan’s capital and interest as non-performing. Previously, financial institutions could register matured installments exclusively as past due loans. Prudential regulation Minimal criteria for credit manuals and for credit files were established, which comprised approval process requirements such as the credit bureau check. Provision requirements were therefore raised, and parametric models to classify and grade the loan portfolio were introduced. Banks can classify their loan portfolio using their internal rating methodologies based on default probabilities, loss severity and collaterals. In addition, lending limits were made considerably stricter, including related lending, which was reduced from a limit equivalent to regulatory capital to 75 percent of Tier 1 capital. The most common approach to dealing with banks’ foreign currency liquidity in emerging markets is to establish minimum liquidity requirements related to the size and term structure of foreign liabilities. Setting minimum requirements has certain advantages for both supervisors, as it is relatively easy to set minimum ratios and supervise compliance, and credit institutions, as it is convenient to comply with fixed parameters. Before the 1995 crisis, Mexico had already introduced liquidity coefficients for foreign currency liabilities. The fixed coefficient approach implemented in Mexico is by no means the best way to address liquidity risk management. However, this regulation is regarded as a necessary first step towards the implementation of an up to date regulatory framework for risk management, and the development and dissemination of modern risk practices in banks. The goal of this regulation is to encourage banks to show prudent behavior in their foreign currency balance sheet, to compel them to maintain adequate liquid assets in foreign currency and to promote long-term financing in foreign currency. According to this regulation, foreign currency liabilities with less than 60 days left to maturity that have no corresponding assets of the same or shorter maturity must be matched entirely by high-quality liquid foreign currency denominated assets. Another regulation establishes that banks’ foreign currency open positions cannot exceed 15 percent of their capital. Corporate governance Corporate governance determines not only how corporate objectives are set, but also how decisions in financial institutions are aligned with the specific interests of shareholders, regulators and other stakeholders. This subject plays an important role in banks and is the subject of particular attention in Mexico, where bank ownership is highly concentrated. Corporate governance reforms in the Banking Law in 2001 had three main objectives: to improve shareholders’ access to relevant information, to define the characteristics and number of independent board members and to create audit committees composed of board members. Furthermore, in order to promote more accountability in the decision-making process of credit institutions, the supervisor requires the signatures of board members and senior management on financial statements. Creation of risk management units In terms of risk management, in order to be allowed to operate derivative instruments, banks have to comply with internationally recognized regulations, such as risk units, which operate under approved
BIS Papers No 28
285
board guidelines and with modern systems that allow operators to constantly check risk exposure limits in real time. Additionally, internal and external audits have to periodically verify banks’ compliance with these requirements.
II.3
Strengthening the legal and regulatory framework
Bankruptcy law and foreclosure procedures As mentioned above, prior to Mexico’s financial crisis, the legal framework did not provide the right incentives for debtors and creditors. Insolvency and foreclosure procedures were long and cumbersome. As a result, many laws were revised and reformed 10 to ensure secured creditors’ interests and foster credit development. The Bankruptcy Law 11 stands out as one of the laws that was subject to major changes. Zúñiga (2005) highlights the main differences between the new law and the previous one by pointing out that one crucial benefit of the bankruptcy law reform was that it established an independent institution called IFECOM 12 in charge of managing bankruptcy claims. This institution must have the proper technical knowledge to deal with different issues involving insolvency disputes and, thus, should respond in a more efficient manner. The setting of strict timelines among different stages of insolvency processes is another major advance. The pace at which insolvency claims are processed is essential to avoid the loss of value of the firm, since factors such as depreciation of assets and less careful management contribute to reduce such value, leading to a minor recovery from creditors. Zúñiga argues that resolution periods will be minimized not only because of the penalties that are established by law if judges do not honor the timelines established, but also thanks to the greater knowledge transfer ensured by this specialized institution. The Law of Credit Instruments and Operations 13 was also amended. The reforms were intended to promote more efficient ways to back loans, complementing the Bankruptcy Law. The Commerce Code was also reformed in order to establish non-judicial procedures to execute guarantees. 14 This procedure allows creditors and debtors to establish an agreement for the execution, and is effective if there is no controversy regarding: (1) the effectiveness of the credit; (2) the amount to be paid; or (3) the delivery of the property given as collateral. To initiate the process, the creditor must request the property. Once the creditor has possession of the property, he can then proceed to execute such collateral. In the event that the collateral cannot be assessed, the judicial procedure will have to be followed. Payment system reform In 2002, the Payment System Law 15 was enacted, in line with the “Core Principles for Systemically Important Payment Systems” issued by the BIS. 16 Its main objectives are to promote efficient payment system operations and minimize systemic risk. This law ensures finality in all systemically important payment systems and gives legal certainty that the collateral submitted to the payment systems cannot be confiscated. In addition, it grants more power to the Banco de México to regulate, supervise, and implement adjustment programs to financial entities that are managing a systemically important payment system.
10
The Law of Commerce and the Law of Credit Institutions were amended on July 13th 2003 and June 13th 2003, respectively.
11
The previous bankruptcy law, known as the “Ley de quiebras y suspensión de pagos” was replaced by the “Ley de concursos mercantiles,” which was published in the Diario Official (the Oficial Federation Newspaper) on May 12, 2000.
12
IFECOM stands for Instituto Federal de Especialistas en Concursos Mercantiles, the Federal Institute of Specialists in Commercial Bankruptcy.
13
Created on August 27, 1932 and last amended on July 13, 2003.
14
This procedure is also known as an execution agreement.
15
Diario Oficial de la Federación, December 12, 2002.
16
Committee on Payment and Settlement Systems, Core Principles for Systemically Important Payment Systems, BIS, 2001.
286
BIS Papers No 28
Other measures intended to promote financial stability are related to the means by which the Banco de México provides credit to ensure the proper operation of payment systems. Currently, central bank credit is concentrated in one payment system and high quality collaterals are required for all participants. Early warning and prompt corrective actions The Banking Law now sets out immediate actions to be undertaken by banks if their capital adequacy falls short of the required minimum capital ratio. Mandatory and discretionary measures are prescribed by supervisors according to different capital levels. For instance, when a bank’s capital ratio falls below 8 percent, the supervisor, among other measures, must order the bank to submit a recapitalization plan and prohibit the payment of dividends. Additionally, the supervisor may restrict the expansion of its riskweighted assets or any other business that may further deteriorate the bank’s capital ratio. If the bank’s capital falls below 7 percent, the bank would automatically need supervisory approval to invest in nonfinancial assets, to open new subsidiaries or to undertake new lines of business. Under this scenario, the supervisor can also appoint new managers, board members or external auditors. Finally, if a bank’s capital ratio falls below 4 percent, the supervisor must inform the Ministry of Finance, the central bank and the Deposit Insurance Agency of the bank’s situation in order for them to coordinate its resolution. At this point, the supervisor may order the bank to comply with any legally available corrective actions.
III.
Evolution of Mexican banks
As a result of the banking crisis of 1995, commercial banks’ balance sheet contracted significantly: total assets 17 as a share of GDP went from a historical high of almost 70 percent in 1994 to 34 percent in mid-2005 (Graph 7). Nonetheless, it has gradually started to recover. The crisis led to an important consolidation of the banking system. Foreign investment in the banking system has also grown considerably in recent years, from below 20 percent in 1997 to more than 80 percent in 2005. A large share of Mexican commercial banks is now part of global financial institutions, helping to improve risk management practices and diversifying part of the domestic risks at a global scale. If measured by total assets as a percentage of GDP, the size of the banking sector has been stable during the last five years. As a percentage of GDP, the Mexican banking system is small even in comparison with other emerging economies. Graph 7 Commercial banks Total assets1/GDP 80 70 60 50
%
40 30 20 10 0
1994 1995 1996 1997 1998 1999 2000 2001 2002 2003 2004 Jun05 1
Including repo operations.
Sources: CNBV; Banco de México.
17
Including repo operations.
BIS Papers No 28
287
Non-bank financial intermediaries have grown faster than banks, and banks’ share in the financial system’s total assets fell from 72 percent in 2000 to 51 percent in 2005. The fastest growing financial intermediaries are pension funds, non-bank banks and mutual funds, and only during and after 2003 did commercial banks total assets start to show positive real rates of growth. A consequence of this is that financing to the private sector has diversified. Financing from commercial banks in 1995 was equivalent to 65 percent of total financing 18 to the private sector; in 2005, this figure decreased to 30 percent. Since the 1995 crisis, financial sector reforms, thoroughly described above, have been gradually implemented. Under this new regulatory framework, and in a stable macroeconomic environment, commercial banks’ performance in Mexico has markedly improved. Especially since 2000, once the consolidation process after the crisis slowed down 19, banks have continuously enhanced their soundness and profitability indicators. The pretax return on shareholders’ funds has grown since 1998, from negative numbers to almost 30 percent in September 2005.
Table 2 Return on equity*
Banking system
2000
2002
2003
2004
IIIQ 2005
6.9%
10.0%
18.7%
22.0%
28.9%
* ROE = Net income/average equity. Source: CNBV.
Graph 8 Regulatory capital Billions of pesos in real terms
16%
Tier 1 Tier 2
250
Deferred Taxes Capital Ratio* (left scale)
200
12%
150 8% 100 4%
04
03
02
01
Sep'05
* Total Capital/Total Risk Weighted Assets
00
99
98
97
96
95
94
93
92
91
0%
50 0
Further, capital adequacy ratios are higher than five years ago and the composition of banks’ regulatory capital has significantly improved. The losses originated during the 1995 crisis severely
18
Total financing includes commercial and development bank credit, financing from abroad, suppliers’ credit, and credit from non-bank financial institutions.
19
The Mexican banking system consolidation process is described in Marcos Yacamán, Competition and Consolidation in the Mexican Banking Industry, BIS, 2001.
288
BIS Papers No 28
affected banks’ capital, which decreased in real terms for the following five years. During these years, the banking system went through a consolidation process that implied a series of mergers and acquisitions which, apart from causing a reduction in its size, set the basis for its recent profitable performance. In the last few years, banks’ solvency has been reinforced. On the one hand, improvements in their financial structure and balance sheets, in particular in their asset quality, together with injection of new capital and retention of increasing profits, has strengthened banks’ economic capital. On the other hand, regulatory limitations have been imposed to the inclusion of deferred taxes and of subordinated debentures in the definition of Tier 1 capital. After 2000, foreign banks’ participation increased, driven by BBVA’s merger with Bancomer, Santander’s purchase of Serfin, Citibank’s acquisition of Banamex and, more recently, the entry of HSBC into the retail banking sector by acquiring Bital. The entry of foreign banks contributed to the recapitalization process of the banking system.
Bank activity and profitability The strong performance of banks’ profitability during the last five years is explained by several factors: (1) strategies implemented by banks to improve net interest income despite facing a contraction of interest rate spreads from 1998 to 2003 - after this period, rising rates of interest and spreads have benefited, especially retail banks; (2) higher income from fees and commissions; (3) improvement of the efficiency index measured as the ratio of operating expenses over income; and (4) decreasing requirements of loan loss provisions due to the improvement in the quality of loans. From 1998 until 2003, interest rate spreads in Mexico declined significantly. During this period, banks managed to sustain or even increase net interest income levels. Banks have improved their financial structure; to be precise, they are no longer financing non-earning assets with interest bearing liabilities. Additionally, the earning assets structure has improved with a growing share of high-yielding loans. At the same time, the cost of funding is much lower nowadays as banks hold a larger share of low cost deposits such as savings and checking accounts.
Credit growth Credit granted to the private sector has recovered. The highest real rate of growth is that of consumer credit, which has been above 35 percent in real terms during the past four years. Next are mortgage loans which picked up more recently. Commercial credit has registered high real rates of growth during last year. Graph 9 Performing loans annual real rates of growth (%)
% 60
Mortgage
50
Consumer
40 30 20 10 0
Business
-10 -20 2000
BIS Papers No 28
2001
2002
2003
2004
Sep-05
289
Overall household debt 20 has been expanding strongly since 2002. About 61 percent of household bank credit is consumer debt, of which roughly half corresponds to credit card loans. The dynamic expansion of household financing has changed the structure of credit granted to the private sector (Graph 10). Graph 10 Credit to the private sector Structure
1998
Mortgage (pesos) 8%
September 2005
Mortgage restructured loans 1/ 18%
Mortgage restructured loans 1/ Consumer 5%
Consumer 29%
6% Mortgage (pesos) 13%
Commercial Business credit 66% 69%
Business credit 52%
Source: CNBV 1/ Restructured after the crisis and indexed to inflation
The new structure of credit to the private sector allowed banks to increase the level of interest income. While commercial credit offers a spread that varies from 1 to 5 percentage points above the inter-bank interest rate, depending on the size of the firm, banks can obtain a spread of 25 percentage points in loans through credit cards and approximately 6 points in mortgage loans, on average (Graph 11). Graph 11 Interest rate spreads Credit interest rate - Inter-bank rate Percentage points 35
14 Credit card (right scale)
30
12
25
10 Mortgage
20
8 6
Small firms
4
15 10
Medium firms Big firms
2
5 0
0 AAA firms
-5
-2 1999
20
2000
2001
2002
2003
2004
2005
Debt with the financial sector; it includes: bank credit (credit card loans, mortgage loans, car financing and personal loans) and credit from non-bank financial intermediaries such as non-bank banks.
290
BIS Papers No 28
The increasing amount of resources aimed to finance the private sector and the high yield of this type of credit have increased interest income and changed its structure, as the importance of interest generated from financing the public sector diminishes. In 1998, 41.3 percent of interest income was generated by financing the private sector, in 2005 this percentage was raised to 56.5 percent. However, the banking system risk exposure to household credit remains low as portfolio quality indicators are at sound levels (Graph 12). Graph 12 Consumer credit trend Billions of pesos
Mortgage loans
mmp
(%)
14
160
12 10
120
8 80
Consumer Loans
mmp
7
250
6 200
5
150
4
6 4
Past due loans/ Total loans
40
2
3 100 50
0
0 DIC 02
DIC 03
DIC 04
Outstanding
2 Past due loans/ Total loans
SEP 05
1 0
0 DIC 02
Past due loans
DIC 03
Outstanding
DIC 04
SEP 05
Past due loans
Low cost deposit base Banks have improved their deposits structure. Low cost deposits represent almost 42 percent of the total deposit base; this figure was 31 percent in 1998. The deposit structure has allowed banks to significantly reduce their total cost of funds. In 1998, total cost of funds was equivalent to 78 percent of the inter-bank rate (TIIE), while in 2005 it was 67 percent of TIIE.
Table 3 Deposit trend 1998 Amount
2005 Structure
Amount
Structure
1998-2004 Real rate of growth
Low cost deposits
530,523
31.6%
874,561
41.8%
64.8%
Money market
435,386
25.9%
228,146
10.9%
–47.6%
78,932
4.7%
136,657
6.5%
73.1%
Repos
298,324
17.8%
678,809
32.5%
127.5%
Foreign currency deposits
337,203
20.1%
173,568
8.3%
–48.5%
1,680,369
100.0%
2,091,741
100.0%
24.5%
Deposits by banks
Total
Sources: CNBV; and Banco de Mëxico.
BIS Papers No 28
291
Higher fees and commissions Although net interest income continues to be the main source of income, fees and commissions have been growing steadily, increasing their contribution in banks’ net income. Commissions and fees are increasing on two different fronts: by widening the scope of bank services with cost and their individual charge, and due to an increase in the volume of transactions.
Graph 19 Net interest income and commissions in terms of total assets 5%
Net interest Margen income Financiero 4%
Gasto de Administración Operating expenses 3%
2%
Fees & commissions Comisiones netas
1%
0% 1998
1999
2000
2001
2002
2003
2004
2005*
* Ene-May anualizado
Improvement of the efficiency index Efficiency measured as the ratio of operating expenses to total income has improved significantly. In 1998, this ratio was 87.7 percent and in September 2005 it decreased to 57.8 percent. Along with an improvement of income, in these years operating expenses decreased. In the reduction of operating expenses the contraction of the employment base plays an crucial role. Between 1998 and 2003, the employment base decreased 24 percent, by 32,700 employees. Consequently, in this same period wages expenses fell 16 percent in real terms. More than a thousand branches closed, thus expenses in rents dropped 42 percent in this period.
Table 4 ROE decomposition ratios Banking system Net operating income/total income (A)
Total income RWA
RWA/assets
ROA
Assets/equity
ROE
Efficiency index
(B)
(C)
(D)=A *B *C
(E)
(F)=D *E
(G)
1998
–18.6%
9.1%
57.3%
–1.0%
14.4
–14.1%
87.7%
1999
–11.0%
10.4%
54.5%
–0.6%
13.7
–8.6%
82.9%
2000
13.9%
10.3%
51.4%
0.7%
13.1
9.6%
74.6%
2001
21.9%
10.5%
47.5%
1.1%
12.7
13.8%
69.2%
2002
17.3%
11.1%
47.0%
0.9%
11.6
10.5%
71.0%
2003
32.7%
10.2%
54.3%
1.8%
10.3
18.7%
69.8%
2004
34.0%
10.7%
56.7%
2.1%
10.7
22.0%
62.5%
42.4%
10.8%
58.1%
2.7%
10.8
28.9%
57.5%
1
2005 1
January-September in annual terms.
Efficiency index = operating expenses/(net interest income + commissions).
292
BIS Papers No 28
Final considerations All the factors mentioned above help explain the increasing levels of banks profitability. Table 4 shows the ROE’s decomposition ratios. These ratios show how an increasing share of total income results in profits (column A), indicating that at present 42 cents of every peso earned turns into profit. Increasing profits are obtained without a rise in income as a proportion of risk weighted assets (column B) and neither of increasing risk weighted assets as a ratio of total assets (column C). The positive trend in ROE indicators could also be due to a reduction of equity levels, which is not the case, as shown in column (E), revealing that leverage indicators have improved. Efficiency measured as the ratio of operating costs to total income advances in line with profitability, showing evidence of improving management.
Bibliography Banco de México, Quarterly Inflation Report, various issues. Carstens, A. and M. J. Schwartz, “Capital Flows and the Financial Crisis in Mexico”, Journal of Asian Economics, Summer 1998, v. 9, iss. 2, pp. 207-26. Cypher, J. M., “Mexico: Financial Fragility or Structural Crisis?”, Journal of Economic Issues, June 1996, v. 30, iss. 2, pp. 451-61. Demirgüc-Kunt, A. and H. Huizinga, “Market Discipline and Financial Safety Net Design”, Policy Research Working Paper, September 1999. Gil-Diaz, F. and A. Carstens, “One Year of Solitude: Some Pilgrim Tales about Mexico’s 1994-1995 Crisis”, American Economic Review, May 1996, v. 86, iss. 2, pp. 164-169. Gil-Díaz, Francisco, “The China Syndrome or the Tequila Crisis”, Center for Research on Economic Development and Policy Reform, Stanford University, working paper No. 77, December, 2000. ——— “The Origin of Mexico’s 1994 Financial Crisis”, Cato Journal, Winter 1998, v. 17, iss. 3, pp. 303-13. Japelli, T. and M. Pagano, “Information sharing, lending and defaults: cross country evidence”, Journal of Banking and Finance p. 2017-2045, 2002. Krainer, J., “The Separation of Banking and Commerce”, Federal Reserve Bank of San Francisco Economic Review, 2000. LaPorta, R., F. Lopez-de-Silanes and G. Zamarripa, “Related Lending”, Quarterly Journal of Economics, February 2003, v. 118, iss. 1, pp. 231-6. Mancera, Miguel “Problems of bank soundness: Mexico’s recent experience”, prepared for the Seminar on Banking Soundness and Monetary Policy in a World of Global Capital Markets, IMF, January 28, 1997. Marcos Yacamán, J., “Competition and Consolidation in the Mexican Banking Industry”, BIS, 2001. ——— “Reflexiones respecto al desarrollo de la intermediación bancaria y el efecto de la nacionalización en el sistema financiero”, El Trimestre Económico, Lecturas 96, Fondo de Cultura Económica, pp. 183-216, 2005. Sidaoui, J. J., “Macroeconomic Aspects of the Management of External Debt and Liquidity: Reflections on the Mexican Experience”, BIS Policy Papers No. 8, September, 2000. ——— “The role of the central bank in developing debt markets in Mexico”, BIS, 2001. ——— “Implications of fiscal issues for central banks: Mexico’s experience”, in Fiscal issues and central banking in emerging economies, BIS Papers No. 20, October, 2003. ——— “Policies for international reserve accumulation under a floating exchange rate regime: the experience of Mexico (1995-2003)”, in Globalization and monetary policy in emerging markets, BIS Papers No. 23, May, 2005a ——— “Central banking intervention under a floating exchange rate regime: ten years of Mexican experience”, in Foreign exchange market intervention in emerging markets: motives, techniques and implications, BIS Papers No. 24, May, 2005b. Ortiz, Guillermo, La reforma financiera y la desincorporación bancaria, México, Fondo de Cultura Económica, 1994.
BIS Papers No 28
293
The Philippine financial system: issues and challenges 1 Diwa C Guinigundo
1.
Introduction
Driven by aggressive economic policy and structural changes in the 1980s and 1990s, the complexity of the Philippine financial system has gradually increased. The sustained thrust of the reform process in the 1990s facilitated the rapid expansion and eventual integration of the local financial system with the rest of the world. The structural reforms that allowed freer entry of foreign capital paved the way for healthy competition and increased efficiency with the introduction of new technology, greater transparency and broader opportunities for growth. Notwithstanding these gains, increased financial integration has also heightened the country’s vulnerability to external shocks and exposure to risks. The 1997 Asian financial crisis exposed the country’s vulnerability to shocks. While a number of policy measures were put in place to address these weaknesses, the emergence of new risk would require constant recalibration of such measures and the evolution of new ones.
2.
The Philippine financial system
Resources continue to increase In the last ten years, the financial sector has benefited from a number of liberalization and deregulation initiatives as globalization has taken root more strongly in the Philippines. As a result, the Philippine financial system’s underlying fundamentals have posted steady progress since 2000. As of November 2005, the total assets of the Philippine banking system amounted to P 4.4 trillion, more than double the amount recorded in 1996 (Table 1). Commercial banks (KBs), which are further subdivided into universal and regular commercial banks, continued to be the dominant players in the industry, accounting for more than 90 percent of the total assets.
Banking system attempts consolidation The ongoing restructuring of the banking system, which involves the consolidation and closure of weak banks, resulted in a reduction in the number of banking institutions from a peak of 1,003 in 1997 to 881 as of end-September 2005 (Table 2). The total number of banks comprised 42 KBs, 84 thrift banks (TBs) and 755 rural banks (RBs). However, the operating network of the banking system increased slightly to 7,653 as of end-September 2005, from 7,624 at end-June 2005, reflecting the increase in rural banks’ branches/agencies. The Bangko Sentral ng Pilipinas (BSP, the central bank) offered a package of incentives to set in motion the consolidation of the banking industry. A moratorium on the establishment of new banking offices/branches was likewise issued to hasten the creation of larger and stronger banks. The increase in minimum capital requirements of banks also provided the impetus for mergers and acquisitions. Banks which are unable to meet capital build-up requirements have the option to merge or consolidate with other institutions.
1
Presented by Deputy Governor Diwa C. Guinigundo, in charge of the Monetary Stability Sector of the Bangko Sentral ng Pilipinas during the BIS Meeting of Deputy Governors from Emerging Market Economies on 8-9 December 2005 in Basel, Switzerland.
BIS Papers No 28
295
Table 1 Total assets of the banking system 1996
1997
1998
1999
2000
2001
2002
2003
2004
Nov 2005
In billions of pesos Banks KBs
1,876.2 2,513.0 2,512.2 2,722.3 3,013.6 3,070.5 3,250.2 3,425.6 3,760.6 3,968.2
TBs
185.1
208.4
216.4
223.5
245.8
259.0
274.7
292.8
317.9
342.4
RBs
48.0
57.6
60.0
61.5
67.4
73.8
83.5
92.4
104.5
115.5
0.21
–
–
–
–
–
–
–
–
–
Specialized government 2 banks Grand total
2,109.5 2,779.0 2,788.6 3,007.3 3,326.8 3,403.3 3,608.4 3,810.8 4,183.0 4,426.1 Growth, in %
KBs TBs RBs Specialized government banks2
39.25 29.17 44.14
–99.71
Grand total
32.49
33.94 12.59 20.00
–0.03 3.84 4.17
8.36 3.28 2.50
10.70 9.98 9.59
1.89 5.37 9.50
5.85 6.06 13.14
5.40 6.59 10.66
9.78 8.57 13.10
4.11 10.34 10.53
31.74
0.35
7.84
10.62
2.30
6.03
5.61
9.77
4.73
1
Consisted only of one specialized government bank. consolidated with commercial banks.
2
Beginning February 1996, specialized government banks were
Source: Bangko Sentral ng Pilipinas.
Table 2 Total number of financial institutions1 1996
1997
1998
1999
2000
2001
2002
2003
2004
Sep 2005
Commercial banks2 Head offices Branches/agencies
3,647 49 3,598
4,078 54 4,024
4,230 53 4,177
4,326 52 4,274
4,250 45 4,205
4,320 44 4,276
4,265 42 4,223
4,296 42 4,254
4,329 42 4,287
4,322 42 4,280
Thrift banks Head offices Branches/agencies
1,171 108 1,063
1,389 117 1,272
1,474 117 1,357
1,478 118 1,360
1,391 112 1,279
1,351 104 1,247
1,278 94 1,184
1277 92 1,185
1,280 87 1,193
1,279 84 1,195
Rural banks Head offices Branches/agencies
1,514 804 710
1,715 832 883
1,942 826 1,116
1,885 806 1,079
1,912 790 1,122
1,914 781 1,133
1,911 776 1,135
1,921 765 1,156
2,003 764 1,239
2,052 755 1,297
Total Head offices Branches/agencies
6,332 961 5,371
7,182 1,003 6,179
7,646 996 6,650
7,689 976 6,713
7,553 947 6,606
7,585 929 6,656
7,454 912 6,542
7,494 899 6,595
7,612 893 6,719
7,653 881 6,772
1
2
Excludes BSP. Includes Land Bank of the Philippines; with Development Bank of the Philippines starting February 1996; and with Al Amanah Islamic Bank of the Philippines starting June 1996 (SRSO Concept). r Revised.
296
BIS Papers No 28
Despite the steady decline in the number of banks, there is still room for further consolidation in the banking system. 2 The mergers and consolidations did not generally involve big banks; only five such mergers involved banks of significant size. One major deterrent to large-scale consolidation is the structure of ownership in the banking system. About 23 percent of total banking assets is owned by 15 families. Another possible reason cited for the slow consolidation process is that only a few banks are publicly listed. In the Philippines, only universal and commercial banks are required to have their stocks offered to the public, and only 10 percent of their required minimum capital must be listed. In terms of foreign participation, there are 14 foreign bank branches with six foreign bank subsidiaries in the Philippines as of the first semester of 2005. The number of foreign banks operating in the Philippines increased from four in 1994 to 20 as of June 2005 with the relaxation of regulations governing the entry and operation of foreign banks. As a result of the liberalization of foreign bank entry, the share of the foreign bank branches and subsidiaries in the total resources of the country’s banking system doubled, from 6.2 percent at end-1995 to 13.8 percent at end-2004.
Deposits and loans continue to grow The banking system’s deposit liabilities expanded by 124.2 percent as of end-July 2005 to P2.849 trillion, compared to the 1996 level of only P1.271 trillion. Savings deposits still comprised more than half of banks’ stable funding base. Deposit mobilization activities of banks include relocation of new branches and installation of automated teller machines in new sites. KB loans outstanding grew by 34.4 percent compared to the 1996 level. The more modest growth in lending compared to the growth in deposits was due in part to the rise in the non-performing loan (NPL) ratio of banks after the Asian financial crisis.
Deposit Liabilities of Banks In billions of pesos 3,000 2,500 2,000 1,500 1,000 500 0
1996
1997
1998
1999
2000
2001
2002
2003
2004
2005
July
2
Espenilla, Nestor A., “Banking Foreign Direct Investments and Consolidation: The Philippine Experience”, presented during the SEACEN-BIS Seminar in July 2004.
BIS Papers No 28
297
Loans Outstanding of Commercial Banks In billions of pesos 1,600 1,400 1,200 1,000 800 600 400 200 0
1996
1997
1998
1999
2000
2001
2002
2003
2004
2005
Sep
Asset quality continues to improve The NPL ratio of the commercial banking system rose from 4.7 percent in 1997, before the crisis. to reach a peak of 17.3 percent in 2001. However, the NPL ratio was back to a single-digit level in June 2005. The decline reflected the steady progress in banks’ disposition of their idle assets since the implementation of the Special Purpose Vehicle (SPV) Act in 2002 and the sustained though modest rise in total loans of banks. Disposal of idle assets in the Philippines was private sector - led while that of other Asian economies was public sector - led with asset management companies funded by the government. The SPV Act offered fiscal incentives such as exemption from documentary stamp tax and capital gains tax. About 17.8 percent of banks’ non-performing assets were disposed of under the SPVA.
KBs: NPL/Total Loans In percent 20 18 16 14 12 10
9.6%
8 6 4
November 2005 = 8.79%
2 0 1996
1997
1998
1999
2000
2001
2002
2003
2004
2005
August
298
BIS Papers No 28
Capital position remains above prescribed norms The banking industry continues to be well capitalized. The capital adequacy ratio (CAR) of banks on a consolidated basis was recorded at 18.1 percent as of March 2005. The ratio exceeds the 8 percent Basel I standard and the 10 percent set by the BSP. 3 Tier 1 capital comprised 99.4 percent of qualifying capital. 4 Compared with those of its counterparts in the region, the country’s CAR remains above those of Malaysia, Thailand, and Korea, which showed CARs above the Basel I standard.
Capital Adequacy Ratio Financial system 30
Indonesia 25
Philippines
20
Thailand 15 10 5
Malaysia
Korea
0 Mar Jun Sep Dec Mar Jun Sep Dec Mar Jun Sep Dec Mar Jun Sep Dec Mar Jun Sep Dec Mar Jun Aug 2000
2001
2002
2003
2004
2005
Source: ARIC Financial Indicators, ADB website. Commercial banks CAR: Malaysia (August ’05); Thailand (August ’05); and Korea (Commercial banks, June ’05).
Loan provisioning affects profitability ratio The industry’s profitability weakened starting 1997, as reflected in the downtrend in both the return on assets and equity. There was some uptick in the profitability ratios in 2003 resulting mainly from the offloading of NPLs by banks. The general decline may be traced partly to increased loan provisioning of banks for their bad loans. The rise in provisioning has affected banks’ profitability in the short term, but this is expected to recover in the long term. Bank earnings recovered in 2001 through 2003, but resumed their downtrend in 2004. The spike in profitability in 2003 resulted from a significant reduction in below-the-line items, particularly extraordinary credits as a commercial bank sold a substantial portion of its non-performing loans.
3
The CAR is a risk-sensitive measure of a bank’s solvency. It relates capital to risk assets weighted according to their relative riskiness. BSP Circular No. 280, dated 29 March 2001, and BSP Circular No. 360, dated 3 December 2002, both as amended, require all banks to maintain a CAR of at least 10 percent on a solo basis (i.e., head office plus branches) and on consolidated basis (i.e., parent bank plus subsidiary financial undertakings but excluding insurance companies) covering credit risk, and for universal and commercial banks, combined credit and market risks.
4
Tier 1 capital refers to core capital, mainly shareholders’ funds, while Tier 2 refers to supplementary capital such as preferred stocks and subordinated debt.
BIS Papers No 28
299
Banking System: Profitability % 2.5
18.0 16.0
2.0
14.0 12.0
1.5
10.0
ROE (LHS) 8.0
ROA (RHS)
1.0
6.0 4.0
0.5
June 2005 ROE = 8.6% ROA = 1.1%
2.0 0.0 1996
1997
1998
1999
2000
2001
2002
2003
2004
0.0 2005
March
3.
Financial stability issues and challenges
The domestic financial system has demonstrated resilience to external and domestic shocks since the 1997 financial crisis. However, some remaining issues need to be addressed to ensure that the financial system will remain stable and can fully exploit growth opportunities.
Improving asset quality The most important task is to clear up the balance sheets of banks. The overhang in the non-performing assets (NPAs) of the banking system has declined in recent years but it still remains high relative to pre-crisis levels. With weak balance sheets, banks have been risk averse, resulting in reduced credit for investments. This renders the system vulnerable to shocks and contagion effects in the event of big bank failures. From 3.5 percent of total loans in 1996, the NPL ratio of the banking system peaked at 17.1 percent in 2001. The rise in borrower default was brought about by the deterioration in corporate performance as many borrowers were caught in a confluence of sharply weaker exchange rates, interest rate spikes, and collapsing property and equity values, combined with the general slowdown in business activity during the period. Many of the NPLs were related to property bubble lending. Philippine banks have a credit culture that tends to be reliant on collateral based lending, and the burst in the property bubble during the crisis gave rise to structural NPLs. The crisis also saw bank lending decline, reflecting both the deterioration in asset quality as well as the slowdown in economic activity. In particular, commercial bank lending deteriorated significantly from a year-on-year growth of 51.9 percent in 1996 to a 14.5 percent contraction in 1998, before showing slight expansion beginning in 1999. The modest lending activity can be traced to both demand and supply factors. On the one hand, demand for credit declined as consumption and investment were sharply reduced because of uncertainty and some over-capacity achieved in pre-crisis years. On the other hand, the weakening of borrowers’ creditworthiness, combined with weakened bank balance sheets, resulted in a more cautious lending stance by banks that made them highly selective in their lending behavior even at higher interest rates. In 2002, improving fundamentals and a more accommodative monetary policy stance saw asset quality begin improving, with the NPL ratio easing slightly to 14.9 percent from the 17.1 percent peak. The passage of a legislative bill (i.e., the Special Purpose Vehicle Act) to aid in the disposal of banks’ bad assets helped sustain the improvement in the NPL ratio in the following years such that, by August 2005, the banking systems’ NPL ratio had fallen to 9.8 percent of total loans.
300
BIS Papers No 28
Managing risk exposures Deregulation, technological progress, financial innovation, changing tastes and demographics, and increasing market competition have all combined to dramatically transform the financial services industry. This is a continuing and dynamic process. As a result, the banking industry has no choice but to reinvent its products and services and the way they are delivered to customers to stay competitive. However, while these developments have opened new doors of opportunities, they have also introduced credit, market, and liquidity risks that need to be properly managed. Over the past decade, increased market volatility has raised the risk of a counterparty’s failure to meet its obligation. In particular, the growth in bank credit card receivables (CCRs), which peaked at 41.2 percent in 2002, has raised some concern. The increased credit risks facing banks prompted the BSP to call for more stringent loan procedures to mitigate the threats this risk poses to financial stability. As a result, the growth of CCRs slowed down significantly from its peak in 2002 to 16.7 percent by 2004. Similarly, banks have been exposed to increasing risks arising from higher volatility of interest rates and other market prices and the increasing use of customized products. Market prices, in particular, can move very rapidly and, on occasion, in unison, so potential loss to market risk exposure can be substantial. Subsequently, while most banks have the highest exposure to credit risk, market risk has become an important secondary risk factor. Therefore, the BSP has implemented a number of measures to mitigate market risk. Basically, banks’ weak risk management practices helped precipitate the wholesale souring of bank asset quality during the Asian crisis.
Developing the domestic capital market Another major BSP goal is the development and deepening of the domestic capital market. The capital market is an integral part of the financial system. For one, a robust domestic capital market complements the banking system in financial intermediation, providing alternative means of financing to ensure the efficient and sustainable funding of large-scale or long-term projects of government institutions and private entities. A developed capital market also ensures the availability of a wider array of financial instruments that help encourage higher levels of savings, which in turn translate into 5 higher levels of investments to support a faster pace of economic growth. Moreover, a strong capital market would provide the banking system greater flexibility in managing and redistributing its risk, particularly through securitization and hedging. Hence, developing the domestic capital market would contribute to the soundness of the country’s financial sector. In turn, a well-functioning financial market supports the effective conduct of monetary policy, which is a major element in the achievement of price stability. For this reason, the BSP, as the sole monetary authority and supervisor of the banking system, has intensified its efforts to help accelerate the development of the Philippine capital market. In its infancy, the Philippine capital market was synonymous with the loan market. The early 1990s, however, witnessed significant developments in the market, including the establishment of an independent central bank under a new charter, the gradual reduction in reserve requirements, the liberalization of foreign bank entry, and the relaxation of bank branching policies. Complementing the liberalization of the financial market were reforms that led to the emergence of the government bond 6 market as a major venue for mobilizing long-term funds. These, combined with the unification of the Makati and Manila stock exchanges into the Philippine Stock Exchange, saw the emergence of other financial intermediaries as channels for capital financing. Debt securities and equity markets became
5
According to comparative data from the ADB, the gross domestic saving rate in the Philippines as of 2003 was only 20.1 percent of GDP, behind Indonesia’s 21.5 percent, and lower than Hong Kong’s 31.6 percent, Thailand’s 33.1 percent, Malaysia’s 42.9 percent, and Singapore’s 46.7 percent.
6
These reform measures included the following: (a) government securities were made eligible as reserves against deposits; (b) the investor base was broadened with the granting of more licenses for primary dealers and the introduction of smalldenominated securities that appeal to retail investors; (c) government securities with longer maturities were introduced from 1991-1996; and (d) the infrastructure of the government securities market was improved with the automation of the auction process and the introduction of the Registry of Scripless Securities (RoSS).
BIS Papers No 28
301
alternative sources of funds. Subsequently, while banks remained one of the dominant players in the capital market, investment houses, stock brokerage firms, money market funds, and other fund management institutions have steadily gained significance. However, while the government securities market flourished (particularly with the national government registering chronic fiscal deficits), the absence of necessary market infrastructure - such as an organized venue for trading securities - has hindered the development of the corporate debt securities market, making private securities a less liquid instrument to hold, and at greater cost to trade. The onset of the regional financial crisis in 1997 further dampened private sector appetite and depressed the corporate debt securities market. Today, the Philippines’ debt securities market remains almost synonymous with the market for government securities, since public debt issues capture over 90 percent of the market for debt instruments. The corporate bond market is virtually non-existent. With the debt securities market mainly a fund-generating market for the government, and the equities market a virtual mirror of conditions from within and outside the system, the traditional loan market remains the market of choice for both providers and users of capital funds. Due to the underdeveloped state of the domestic capital market, the banking system has been bearing a disproportionately large part of the burden of financing economic development as well as fiscal deficits, which has rendered the system highly vulnerable to changes in interest rates
Other issues and challenges There is a need to coordinate the regulation and supervision of the financial system (banking, securities, and insurance). Over time, innovation and globalization have given rise to new business structures and “hybrid” products that no longer fit squarely with the traditionally regulated institutions. This has created significant scope for regulatory arbitrage that has also encouraged conglomerated financial organizations. In other jurisdictions, this has led to the creation of an “integrated regulator”. While discussions aimed at bringing this system about in the Philippines have started, its realization faces considerable legal and political obstacles and is therefore unlikely to be a factor for at least three more years. In the absence of an integrated regulator, there is a need for the major regulators (the BSP, the Securities and Exchange Commission (SEC), the Office of the Insurance Commission (OIC), and the Philippine Deposit Insurance Corporation (PDIC)) to coordinate their policies and procedures more seamlessly and share information in order to effectively discipline financial markets and financial institutions. However, coordination is hampered by differences in institutional capacity among regulators. This can lead to a non-level playing field which can place banks at a competitive disadvantage as they are subject to increasingly more binding supervision by the BSP and, to some extent, by the PDIC. There is a need to increase financial transparency. Lack of transparency has prevented market discipline from working in the most effective manner. Accounting and disclosure practices leave much room for improvement. External auditors appear to have difficulty striking the right balance between their public duty and their business interests. Also, due to poor appraisal standards, asset valuations are unreliable, leading to potentially overstated financial statements. Because of poor information disclosure, the system is also more prone to rumor-driven contagion (intensified by text messaging). However, given the already weakened state of the banking system, improvements in public disclosure have to be carefully managed and calibrated to avoid undue panic.
4.
Financial policy response
Over the years, particularly in the aftermath of the 1997 Asian financial crisis, the BSP has been strengthening the banking system’s ability to respond to the challenges brought about by globalization and the shocks posed by the global economic crisis. In particular, focus is geared towards strengthening the BSP’s prudential regulatory standards and aligning them with international norms to enhance risk management, promote good corporate governance and greater transparency, and reduce moral hazard. At the same time, procedures were adopted to identify and deal with potential problems of solvent and nearly insolvent banks.
302
BIS Papers No 28
Improving asset quality The Philippine government has had limited capability to help the banking system dispose of its NPAs, in contrast to other crisis-affected Asian countries. Out of fiscal necessity, therefore, the strategy was to mobilize private investment to clean up banks’ balance sheets and rehabilitate the banking system. To improve the repayment performance of outstanding borrowers, the BSP sought to maintain a stable inflation and domestic interest rate environment, even before the formal adoption in 2002 of inflation targeting as the framework of monetary policy. Given the emerging macroeconomic environment, from December 2000 to March 2002, the BSP reduced policy rates by 800 basis points to 7.0 percent for overnight reverse repurchase rates (RRP) and 9.25 percent for overnight repurchase rates (RP). Since then, however, the monetary stance was characterized by caution, allowing past interest rate cuts to work their way into the economy while keeping a look-out for prospective threats to price stability. The BSP also set provisioning requirements for banks’ loan portfolio accounts. All institutions are required to maintain an adequate level of allowance for probable losses. These requirements are applied uniformly for all types of loans, whether corporate or government lending. •
General loan loss provision was set up. This is not linked to any individually identified uncollectible accounts required to be set up under existing regulations. The structure is as follows: 5 percent of the unclassified restructured loans; and 1 percent of the unclassified loans other than restructured.
•
Allowance for probable losses for specific loan and other risk assets accounts was also established. This is implemented based on the following schedule:
Loan Classification
Allowance
Unclassified
0%
Loans especially mentioned
5%
Substandard Secured Unsecured Doubtful
6-25% 25% 50%
Loss
100%
With the BSP pushing for the passage of key legislation aimed at providing the legal framework to facilitate the creation of private-led asset management companies to hasten the off-loading of banks’ NPAs, the Philippine Congress enacted Republic Act No. 9182, or the SPV Act of 2002, in January 2003. Republic Act No. 9267, or the Securitization Act, was also signed into law in March 2004. That signaled the authorities’ determination to institutionalize the strengthening of the banking system. The SPV Act of 2002 sets out the legal, regulatory, and taxation framework for banks and other financial institutions to sell non-performing and acquired assets. The law aims to help institutions securitize their assets by granting tax incentives to asset management companies or special purpose vehicles. •
The primary purpose of the SPV Act is to enable Philippine banks to unload their non-performing loans and foreclosed assets to special purpose vehicles (SPVs), in the hope of further strengthening the banking sector.
•
Under the Act, an SPV is required to be a stock corporation with a minimum paid-up capital of P31,250,000.00. The selling bank is permitted to own up to 5 percent of the outstanding capital stock of the SPV. An SPV is allowed to issue Investment Unit Instruments (IUIs) to finance its acquisition of non-performing loans and foreclosed assets. These IUIs are to be registered with the SEC prior to being sold or distributed to permitted investors within the Philippines. To encourage the transfer of the non-performing loans and foreclosed assets to the SPV, certain tax reliefs are granted.
On the other hand, the Securitization Act of 2004, the companion bill to the SPV Act, aims to: (a) improve the legal standing of securitized issues; (b) promote securitization for the development of
BIS Papers No 28
303
the capital market; and (c) pursue the development of the secondary market for asset-backed securities and other related financial instruments. •
Under this securitization law, assets may be sold with recourse to a special purpose entity (SPE), which then issues securities backed up by a pool of similar assets. Several taxes will be granted to encourage financial institutions to transfer housing mortgages to SPEs. While SPEs will still have to pay income taxes like any other corporation, transfers of assets will be exempt from value added and documentary stamp tax. SPEs will also be exempt from the 5 percent gross receipts tax applicable to a bank/financial intermediary and will be given a 50 percent discount on all applicable registration and annotation fees. Property transfers, through dacion en pago 7 will similarly be exempt from the 6 percent tax on capital gains. The revenues foregone from these tax incentives are expected for to be minimal since the government is not presently collecting those taxes from which the SPEs are exempted.
•
Other provisions include: prohibiting the national and local governments from securitizing receivables arising from future expectations of revenues (such as royalties, fees, internal revenue allotments, etc.) at the expense of their successors; and requiring each securitization plan to be prior registered with the Securities and Exchange Commission (SEC).
The implementing rules and regulations (IRR) of the SPV law were approved in March 2003. Significant reductions in banks’ NPLs began to be felt in the latter part of 2004 as bulk sales of bad assets to SPVs were made, although the market remained generally thin due to the deep discounts quoted by investors, making banks reluctant to dispose of these assets. As of 26 June 2005, 343 certificates of eligibility (COEs) 8 have been issued under the SPVA. The amount of NPAs transferred under the said law totaled P96.7 billion, involving various transactions. Of the total peso transactions, P79.1 billion involved a sale to an SPV. The remaining amount involved the sale of real and other properties owned and acquired (ROPOA) to individuals and dacion en pago transactions. The total amount of NPAs transferred under the SPV Act represents 18.6 percent of the P520 billion worth of NPAs as of 30 June 2002. However, the two-year effectivity for the filing and disposal of NPAs under the SPV Act ended in April 2005. To give the banking system more time to dispose of non-performing and repossessed assets at discount, a bill has been filed in the Congress to extend the privileges under the said law by another two years. The unloading of an additional P100 billion worth of NPAs is expected with the extension of the effectivity of the law. Meanwhile, Congress approved and released the IRR of the Securitization Act in May 2005. With the release of the law’s long-awaited IRR, the government expects to harness the bond market’s tremendous potential in generating long-term funds, not only for housing but for other priority development programs. To force asset disposal, the BSP implemented the following measures: (a) asked banks whose NPL ratios have surpassed industry levels to submit measures that are being taken to reduce their NPL levels; and (b) increased the risk weight on NPLs from 100 percent to 125 percent and announced a further increase to 150 percent by 2007 (Circular No. 475, dated 17 November 2005).
Enhancing risk management In the past ten years, the BSP has implemented several major improvements in Philippine banks’ risk management practices. The BSP’s effort to focus on risk management is ultimately intended to give banks greater flexibility to respond to changing opportunities under a more deregulated environment and at a time of rapid technological advances. Traditional bank supervision tended to instruct banks to avoid taking highly risky undertakings. The new approach to supervision favors assessment of the
7
Refers to “payment in kind”, whereby property, whether real or personal, tangible or intangible, is alienated in favor of the creditor.
8
Refers to the certificate issued by the appropriate regulatory authority as to the eligibility of the NPL or ROPOA for purposes of taking advantage of the tax exemptions and privileges, pursuant to the provisions of the SPV Act.
304
BIS Papers No 28
quality of risk management practices, and generally allows banks to take risks so long as they demonstrate their ability to manage and price those risks. In particular, the risk management initiatives have included the following: •
The BSP recognized the greater risk exposure in the system brought about by derivatives activities and the need to mitigate it. Hence, BSP Circular No. 102 was issued in December 1995 prescribing the minimum standards for risk management of derivatives. This was the first BSP regulation that specifically focused on banks’ risk-taking activities and risk management practices.
•
In 1997, in response to the higher risk environment, the BSP started to move from a compliance-focused supervisory approach to the risk-based approach that focused bank supervision on the measurement of banks’ risk exposures and on risk management, instead of mainly concentrating on financial audit and compliance review. The purpose of this change in approach is to adapt to the evolving structure of the banking system and evolving international best practices.
•
9
–
The on-site examination process was reoriented to a more forward-looking and riskbased approach with the adoption of CAMELS (capital adequacy, asset quality, management, earnings, liquidity, and sensitivity to market risks) and the Risk Assessment System (RAS).
–
The BSP developed an Early Warning System (EWS) which uses statistical modeling techniques to enhance its ability to supervise the banking system.
–
In 2001 the BSP adopted the risk-based capital adequacy ratio along the criteria of Basel I, with some modifications to take into account special local conditions and practices.
In March 2001, the BSP adopted the original Basel I framework through Circular No. 280. This circular provided guidelines for the computation of risk-based capital for credit risk. The BSP’s risk-based capital adequacy framework was further enhanced with the issuance of Circular No. 360 in December 2002, which required banks to measure and apply capital charges against their market risk, in addition to their credit risk. The market risks addressed by this regulation are the risks pertaining to interest rate-related instruments and equities in the trading book, and foreign exchange risk throughout the bank. –
On the implementation of the Basel framework, the BSP imposes a minimum capital adequacy ratio (CAR) of 10 percent on domestic and foreign banks. This minimum required ratio of 10 percent was set higher than the Basel I or Basel II recommended ratio of 8 percent to take account of other risks not captured in the current framework, e.g. operational risks. This requirement is applied on both a solo and a consolidated basis. It is also applied uniformly across all types of banks, except that the capital charge for market risk is applied only to universal and commercial banks. Subsidiaries of foreign banks are treated in the same manner as domestic banks. Branches of foreign banks have the same minimum capital adequacy ratio requirement, except that the bases of their qualifying capital are “assigned capital” and “net due to head office, branches and offices abroad” - up to three and four times the “assigned capital” for universal and commercial banks, respectively.
–
The calculation of capital charge for market risk is the same as the 1996 Amendments to Basel I. Banks may, subject to prior BSP approval, use the internal value-at risk 9 (VaR) model approach in lieu of the standardized approach for calculating the capital charge for market risk. The calculation of qualifying capital is also the same as that prescribed in Basel I. It consists of Tier 1 and Tier 2 capital, where total Tier 2 capital should not exceed Tier 1, and lower Tier 2 should not exceed 50 percent of Tier 1.
Refers to a technique which uses the statistical analysis of historical market trends and volatilities to estimate the likelihood that a given portfolio’s losses will exceed a certain amount; measures the worst expected loss over a given time interval under normal market conditions at a given confidence level.
BIS Papers No 28
305
Unsecured subordinated term debt instruments may, depending on terms and conditions, qualify under upper or lower Tier 2 capital. –
The credit risk weights used are as follows: •
0 percent risk weight on cash, claims on or claims guaranteed/collateralized by securities issued by the Philippine National Government/BSP and multilateral development banks, as well as central governments and central banks of other countries with the “highest credit quality”, defined as a rating of AA- and above by recognized credit rating agencies’;
•
20 percent risk weights on checks and other cash items, claims on Philippine/foreign incorporated banks and private enterprises with the “highest credit quality”;
•
50 percent risk weight on loans for housing purposes secured by real estate mortgages (REM) that are not past due;
•
75 percent risk weight on loans to small and medium-sized enterprises and non-performing loans for housing purposes secured by REM;
•
125 percent risk weight on all non-performing loans (except housing loans secured by REM); and
•
100 percent risk weight on all other claims.
–
The BSP, on 13 December 2004, announced its implementation plan for Basel II. The BSP believes that the adoption of Basel II and its three component pillars, i.e., minimum capital requirements, supervisory review process, and market discipline, would compel banks to further strengthen their risk management system and corporate governance if they are to remain competitive and viable. This require, however, a significant upgrading of technical skills on the part of both supervisors and banks. It will also require setting up an infrastructure supportive of the framework, e.g., more credible credit rating agencies, reliable credit information bureaus, etc.
–
As stated in the plan, universal/commercial banks are expected to comply with the standardized approach for credit risk, and the basic indicator or standardized approaches 10 for operational risk by 2007. By 2010, these banks may move to the foundation internal ratings based (IRB) or advanced IRB approaches 11 for credit risk, and advanced measurement approaches for operational risk. TBs and rural/cooperative banks are expected to be subject to an enhanced Basel I-type approach by 2007, except for TBs affiliated with universal banks (UBs)/ KBs, which should use the same approach used by their parent UBs/KBs. The exposure draft for the new risk-based capital adequacy framework was issued on 19 April 2005 for comments by the banks concerned.
•
The BSP required all banks to set up a comprehensive risk management system which should already cover liquidity risk management. Maturity gap analysis is required at every regular examination, but there are no specific limits on maturity gaps. There are also specific rules for particular liabilities like long-term negotiable certificates of deposit, repurchase transactions and total issuances of unsecured subordinated debt. The reserve requirement is a total of 21 percent for demand deposits, NOW accounts, savings deposits, and time deposits. The reserve for long-term negotiable certificates is only 2 percent.
•
Placing limits and creating policies over material areas of exposure is a significant step in managing the combined effect of various market risks. For this reason, the BSP has set
10
Refers to an approach proposed by the Basel Committee to calculate credit risk capital requirements for domestic banking institutions using risk indicators for each of their business lines.
11
Refers to an approach proposed by the Basel Committee to determine the required buffer capital by breaking credit risk into its constituent elements and dealing with each in turn.
306
BIS Papers No 28
several exposure limits for banks, scaled as a proportion of capital or total loan portfolio. These include:
•
–
large exposure limit: 5 percent of qualifying capital;
–
related party credit limit: 100 percent of the book value of capital contributions and 100 percent of unencumbered deposits, but not to exceed the single borrower’s limit (25 percent of unimpaired capital);
–
specific sector (real estate): 20 percent of total loan portfolio; and
–
single borrower’s limit (SBL): 25 percent of unimpaired capital.
In 2004, the BSP issued guidelines to help manage large exposures and credit risk concentrations. In particular, the BSP: –
required the boards and senior management of banks to ensure that adequate systems and controls are in place to identify, measure, and monitor and report large exposures and credit risk concentrations of banks in a timely manner;
–
amended the SBL to achieve more comprehensive coverage on a consolidated basis of bank exposure to related parties;
–
tightened rules governing bank exposure to directors, officers, staff and related interests (DOSRI). The new rules set more binding limits on the grant of loans, credit accommodations, and other guarantees to DOSRI and imposed stiffer sanctions on violators;
–
required universal and commercial banks to develop and implement an internal credit risk rating system, and to develop and maintain an appropriate, systematic and uniformly applied process in determining the amount of reserves for bad debts and doubtful accounts; and
–
implemented a more stringent policy on credit card operation, particularly in the customer application process.
In carefully loosening the regulatory grip on banks’ risk-taking activities in order to give them more elbow room for success, the BSP must necessarily strengthen the responsibility of banks’ boards of directors and senior management to ensure the soundness and stability of their respective banks. The regulators’ role is primarily to evaluate the quality of oversight and management provided by these parties - that is, the quality of corporate governance. Hence, strengthening banks’ corporate governance has been the theme of a number of BSP regulations. •
In June 1997, Circular No. 130 was issued requiring the boards of directors of banks to, among other things, adopt and maintain adequate risk management policies. A few months later, in October 1997, the BSP issued Circular No. 145 requiring banks to develop and implement a compliance system and to appoint/designate a compliance officer to oversee its implementation. In September 2001, the BSP issued Circular No. 296, which implemented the fit and proper standards for directors and officers of banks and non-banks. The same circular also prescribed a mandatory orientation program on corporate governance for banks’ boards of directors. In October 2003, the BSP issued Circular No. 410, which provided the accreditation guidelines for banks’ external auditors.
•
The BSP issued a number of guidelines aimed at further enhancing governance practices in banks. In January 2004, the BSP issued the guidelines for the management of banks’ large exposures (Circular No. 414). In March 2004, the BSP strengthened the DOSRI rules by expanding the definition of related interests (Circular No. 423). In May 2004, the BSP issued Circular No. 429, which is at aimed at further strengthening the banks’ compliance function.
•
In July 2004, the BSP issued the guidelines for the development and implementation of banks’ internal credit risk rating systems (Circular No. 439). The guidelines emphasized the oversight function of the board of directors over these systems. In October 2004, the BSP required boards of directors to, in addition to an audit committee, a corporate governance committee and a risk management committee.
BIS Papers No 28
307
Developing the capital market To help develop the domestic capital market, the BSP implemented or supported the following reform initiatives: 1. Establishment of a private sector-led fixed income exchange (FIE). Begun in 2001, this is intended to help institutionalize a liquidity and price discovery mechanism for secondary trading of fixed-income securities, provide the public with more investment options apart from traditional equities, and open up more avenues for private and public sector issuers to tap low-cost capital. Among other things, the BSP: allowed universal/commercial banks to invest in the FIE; created technical working groups to look into the legal issues surrounding the proposed FIE; and granted the Philippine Depository & Trust Corporation (PDTC) permit to operate as a non-bank financial institution with authority to perform quasi-banking functions, trust and other fiduciary business, and investment management activities. After several years of preparatory work, the first phase of the much awaited FIE, which consisted of a virtual inter-dealer trading platform that offers government securities ranging from one-month to 25-year tenors for secondary trading, was finally launched in end-March 2005. The second phase, which will allow retail investors to transact deals through their brokers, is also set to be launched this year. 2. The institutionalization of third-party custodianship for securities. Independent custodians for securities provide investors better protection from fraudulent acts of multiple securities sales by ensuring that all transactions are backed up by corresponding debt instruments. The custodian system also prevents price manipulation, as custodians record the buying and selling prices of securities. Third-party custodianship further complements the establishment of the FIE by paving the way for the creation of a repo and securities borrowing and lending market. Hence, to institutionalize a system of independent third-party custodians for securities, the BSP mandated the transfer of securities (used for quasi-banking functions) by banks under BSP supervision to BSP-accredited custodians in 2003. Effectively, the regulation requires all buyers of securities to lodge their investments with an independent custodian who will have the sole responsibility in the registration and safekeeping of all debt securities sold, borrowed, purchased, traded, and transacted in the Philippines. BSP requirements for accreditation as a custodian include: a risked-based capital adequacy ratio not lower than 12 percent; a comprehensive risk management system; a CAMELS four rating standard; and adequate technological capability and technical expertise. To date, the Monetary Board has approved the accreditation of six third party custodians: four foreign banks (Standard Chartered Bank, Deutsche Bank, Hong Kong and Shanghai Bank Corporation, and Citibank); one local bank, (Bank of the Philippine Islands); and a non-bank financial intermediary (Philippine Depository and Trust Corporation). 3. Creation of unit investment trust funds (UITFs) to replace common trust funds (CTFs). As an investment product, UITFs will be more competitive as they will no longer be subject to reserve requirements, and will be exempt from the single borrowers’ limit calculations. UITFs are also allowed to be offered in dollar-denominated forms for investors with independent dollar sources. However, UITFs have clearer safeguards that distinguish them from deposit substitutes.The safeguards include requiring assets held by UITFs to be marked to market daily and for them to be under third-party custody to protect investors from fund manager misconduct. Eventually, the BSP expects UITFs to evolve into major institutional players in the domestic capital market. 4. Upgrading of the payment and settlement system into a real time gross settlement system (RTGS) with a view to enhancing the operational efficiency, reliability, speed, and timeliness of payment transactions in the face of the rapidly increasing volume and large value of payment transactions. Initiated in 1998, the project required the BSP to install and manage a computerized facility that is able to process the payment and settlement of large-value fund transfers arising from the following transactions: trading of equities and government securities, money market placements, and foreign exchange market transactions. It is envisioned that with this new facility, the actual transfer of funds between the payer’s bank and the payee’s bank can be made individually within the same day that the instruction is made, provided the payer has sufficient covering balances or credit with the BSP. Thus, it will enable Philippine banks and their clients to settle on a “delivery versus payment” (DvP) or “payment versus payment” (PvP) basis. In mid-July 2001, the Philippine RTGS began to be partially implemented to cover interbank loan transactions and the purchase of government securities under repurchase agreements between and
308
BIS Papers No 28
among banks and the BSP. The Philippine RTGS, named the Philippine Payment System or PhilPass, was formally launched in December 2002. 12 5. Development of domestic rating capacity to meet the growing need for credit rating services by both the financial industry and regulators. In pursuit of this goal, the BSP established minimum eligibility criteria for the recognition/derecognition of domestic credit rating agencies for bank supervisory purposes in 2003. In early 2005, the BSP approved a national rating agency system for the local banking industry that would allow international rating agencies to set up a national rating system for banks that would be applicable only to the Philippines. Subsequently, domestic banks assessed by rating agencies can now be given ratings higher than the sovereign credit rating.
Enforcing prompt corrective action Banks with impending/potential problems are subject to the following: •
Intensive monitoring - problem banks are subject to close monitoring by the Prompt Corrective Action Units (PCAU) in each of the four supervising and examining departments of the BSP’s Supervision and Examination Sector.
•
Early intervention resolution - should early warning indicators 13 show deterioration of a bank’s financial condition, the supervising and examining department-in-charge engages in early intervention initiatives before trouble spots get out of hand. These initiatives include the implementation of prompt and corrective action and the imposition of corresponding sanctions, depending on the severity of non-compliance with BSP-prescribed prudential regulations.
Other prudential reforms/regulations Other prudential regulatory standards have been continually strengthened and aligned with international standards. 1. In response to the increased blurring of distinctions between financial products, the BSP began supervising financial conglomerates on a consolidated fashion in 1998. A common cutoff date for examination of banks and their subsidiaries and affiliates under BSP direct supervision was put into place; the publication of the quarterly consolidated statement of condition (parent bank and its subsidiaries engaged in financial allied activities), side-by-side with the combined statement of conditions (head office and branches), was required; and the application, on a consolidated basis, of prudential limits on the required compliance with the risk-based capital ratio (applied on both a solo and a consolidated basis) and the limit on the net open foreign exchange position (applied only on a consolidated basis) were implemented. 2. In addition, as a step towards harmonizing the regulatory environment governing the financial services industry, the BSP, together with the SEC, the IC, and the PDIC, formed the Financial Sector Forum (FSF) in 2004. The FSF is expected to further enhance coordination arrangements among the concerned agencies, particularly with regard to the following: the harmonization and coordination of supervisory and regulatory methods and policies; reporting and information exchange and dissemination; and consumer protection and education to curb unlawful and unethical business practices.
12
Today, the following transactions are accepted for processing by the PhilPass: (a) interbank loan transactions among banks and non-bank financial intermediaries performing quasi-banking functions; (b) purchase and sale of government securities under outright and repurchase agreements, and between and among banks and non-bank financial intermediaries and the BSP in connection with the latter’s open market operations; (c) settlement of the peso leg of foreign currency transactions and government transactions; (d) high-value customer payment instructions; (e) interbank settlement of ATM transactions; and (f) other payment instructions under DVP and PVP. In the near future, PhilP transactions will include bank settlements for government securities issued by the Bureau of the Treasury (BTr). The system may also be linked to the Philippine Stock Exchange (PSE) to allow the real-time settlement of stock transactions using the delivery versus payment mode.
13
The early warning analysis uses econometric methods to produce a one-year ahead forecast of bank solvency from the financial data regularly submitted by reporting banks as well as from macroeconomic data.
BIS Papers No 28
309
3. The BSP enhanced transparency by requiring banks to disclose the following information in their quarterly published/posted statements of condition: •
amount of non-performing loans and ratio to total loan portfolio;
•
amount of classified loans and other risk assets;
•
general loan loss reserves;
•
specific loan loss reserves;
•
return on equity
•
DOSRI loans/advances and ratio to total loan portfolio; and
•
past due DOSRI loans/advances and ratio to total loan portfolio.
Additional information was also required in periodic reports submitted to the BSP, as well as in published reports and audited financial statements and all relevant financial reports: the staggered recognition of actual loss on sale/transfer of NPAs and/or impairment, if any, on the remeasurement of financial instruments at end of the first fiscal year following the sale/transfer of NPAs. Moreover, banks/FIs which received financial instruments issued by the SPVs as partial or full settlement of the NPAs transferred to the SPVs should disclose in the audited financial statements the method used and the significant assumptions applied in estimating the recoverable amount of the financial instruments, including the timing of the sale, the direct cost to sell, administrative expenses, and reinvestment rate of current market rate. External auditors were likewise required to disclose adverse findings to the BSP, including: those involving fraud or dishonesty, which may jeopardize the interest of depositors and creditors; losses incurred which substantially reduce the capital funds of the bank; and inability of the auditor to confirm that the claims of creditors are still covered by the bank assets. •
To strengthen public confidence in the banking system and further foster financial stability, all peso and foreign currency savings deposit accounts, time deposit accounts, current or demand deposit or checking accounts in a bank are required to be insured with the PDIC. With the amendment of the PDIC’s charter, the allowable insured deposit was raised from P100,000 to P250,000.
In December 2004, the BSP moved to align local financial accounting standards with international standards with the adoption by 2005 of new and revised Philippine Accounting Standards (PAS) issued by the Accounting Standards Council (ASC). 14 The standards are based on the new and revised International Accounting Standards (IAS) issued by the International Accounting Standards Board (IASB). The adoption of the new and revised IAS will help promote fairness, accuracy, and transparency in the financial statements of banks and other supervised institutions. Ultimately, all of these should help strengthen market discipline, encourage sound risk management practices, and stimulate the domestic capital market. The BSP also imposes supervisors’ guidelines, targets, codes of good practice, recommendations, etc., that do not have the full legal status of regulations. However, since these were issued as regulations by the BSP, banks are required to comply. These include regulations pertaining to the following: NPL ratios; returns on assets; returns on equity; loan to deposit ratios; liquidity; and sensitivity to market risk.
14
Among the new standards is IAS 39 on financial instruments, which the BSP adopted in its rules and regulations governing the accounting treatment of investments in debt and equity securities. The BSP regulation provides general guidelines for classifying, recognizing, and measuring investments in debt and equity in accordance with IAS 39. In particular, it requires financial institutions to classify their outstanding investments in debt and equity securities based on their intention for holding or purchasing the securities.
310
BIS Papers No 28
5.
Future direction
Policy directions in the banking sector will focus on two main policy objectives that are geared towards a flexible banking system and a deeper capital market. These objectives are to: •
promote a stronger and more stable financial system; and
•
develop the domestic capital market to improve investments, protect investors, and provide easier access to funds by small and medium-sized businesses, both of which are essential to increasing growth.
On the financial supervision front, the BSP reform measures will be geared towards maintaining a healthy banking system. Initiatives include asset clean-up and capital base build-up through compliance with International Accounting Standards by 2005, and adoption of the Basle II Capital Adequacy Framework by 2007; improvement in the BSP’s supervision technology and capacity through acceleration of the move to risk-based supervision; promotion of corporate governance; and improvement in the prudential regulatory environment at par with international standards and practices. The BSP will also advocate the passage of key legislation that includes extension of the effectivity of the SPV Law and amendments to the BSP Charter. To further develop the domestic capital market, and thereby stimulate domestic savings and provide investment opportunities, the BSP will: continue to support the full implementation of the third-party custodianship system and the operation of the Fixed Income Exchange; facilitate the establishment of more credit rating agencies and support the creation of a centralized credit information bureau; widen opportunities for banks to tap the capital markets and continue trust reform for other managed funds; and support other enabling legislation for capital market development. In particular, the BSP will support calls for the passage of relevant amendments to the Credit Reporting Bill, the Corporate Recovery Act, the Pre-Need Code, and the Corporation Code. In order to intensify the social dimensions of BSP policy, the BSP will also continue to advocate microfinance as the most effective tool for democratizing the access of the public to a portion of the nation’s wealth, for empowering the poor and the economically challenged group of small entrepreneurs, and for scoring a dent on poverty alleviation. The BSP shall also pursue economic and financial literacy programs to reach out to consumers, investors, overseas Filipino workers and their beneficiaries, to help expand their investment options and ensure their economic future.
BIS Papers No 28
311
Changes in the financing structure of the real economy in Poland - challenges for the banking sector Jerzy Pruski 1 Dawid Żochowski 2
Introduction Significant changes have occurred in the Polish banking sector over the last ten years. In the mid-1990s, due to low market entry requirements, many small private commercial banks, which were frequently established by foreign banks seeking to enter the Polish market, operated alongside state banks. A wave of privatisation occurred in the banking sector, which was followed by a period of consolidation and restructuring. These processes, coupled with a simultaneous increase in foreign investor participation, enhanced management quality and banks’ efficiency, primarily with regard to risk management. The changes, which took place in the Polish banking sector in the second half of the 1990s, improved access to loans for corporates and households alike. As a result, lending grew rapidly. The increase was, on average, more pronounced in the household sector than in the corporate one, which brought the composition of bank loans to the private sector closer to what exists in the European Union. This convergence has accelerated over the last five years. The purpose of this paper is to present the phenomena which influenced the evolution of debt structure of the real economy sector in Poland as well as to discuss related future challenges.
1.
Changes in access to loans for the real economy sector and in the loan portfolio structure
1.1
Trends
Over the last decade, household borrowing has grown sixfold. Over the same period, corporate debt has doubled - the growth largely occurred during the first half of the period (cf. Figure 1). The ratio of loans to households to GDP rose from 5.2% in 1996 to 13% in 2004. The ratio of loans to corporates to GDP amounted to 13.2% in 1996, then reached 16.6% in 2000 and decreased to 13.7 % in 2004 (cf. Figure 2). Figure 1 Credit growth 140
billion zloty
120 100 80 60 40 20
Loans to corporates
12.2004
12.2003
12.2002
12.2001
12.2000
12.1999
12.1998
12.1997
12.1996
0
Loans to households
Source: NBP. 1
First Deputy President of the National Bank of Poland.
2
Economist, Financial System Department, National Bank of Poland.
BIS Papers No 28
313
Figure 2
% of GDP
Credit to GDP ratios 18% 16% 14% 12% 10% 8% 6% 4% 2% 0% 1996 1997 1998 1999 2000 2001 2002 2003 2004 Loans to corporates as a percentage of GDP Loans to households as a percentage of GDP Source: GUS and NBP data, own calculations.
These figures provide an overview of the processes which occurred in the Polish banking sector during the last ten years. Initially, banks focused their lending activities on the corporate sector. Due to the economic slowdown in 2001 and 2002, and the restructuring efforts undertaken by businesses, loans to corporates did not grow in subsequent years. Faced with a lack of growth in loans to corporates, banks concentrated on the retail sector, which significantly intensified the competition in the consumer and housing loan segments.
1.2
Waves of growth in lending
Three waves of accelerated growth can be distinguished with regard to the increase in lending to households: •
The first wave (1996-1997) occurred during a period of rapid economic growth. The effects of the reforms undertaken at the beginning of the 1990s began to be felt by households. Conditions in the labour market and, therefore, the financial standing of households improved. The saturation of the market with consumer durables as well as the obsolescence of old equipment led households with growing optimism about prospects to purchase consumer durables on credit en masse. During this time, the rapid increase in household debt was accompanied by an even larger (in terms of volume) increase in corporate debt enterprises were financing their rapidly growing investments.
•
The second wave (1999-2000) followed the period of privatisation and consolidation in the Polish banking sector, and came directly before an economic slowdown. Among other things, automobile loans grew rapidly during this period, and the importance of housing loans also rose. Banks’ cooperation with loan intermediaries gained prominence. No credit information bureau operated as yet, however, and credit scoring systems were still imperfect. This later led to a deterioration in loan portfolio quality. At the end of this growth wave, the nominal increase in household debt exceeded the increase in debt in the corporate sector. The slower growth in corporate debt was the result of the completion of the investment cycle and the economic slowdown.
•
The third wave (2003-present) emerged when inflation stabilised at a low level, and interest rates decreased. Faced with stagnating lending to corporates, banks focused on the retail sector - on the housing loan segment, among other things. Intensified competition led to the extension of the range of loans on offer and terms became more attractive: access to foreign currency loans improved, and loan terms were extended to 30 years. The rise in lending was also influenced by demand-side factors such as the population boom and expectations of property price increases following Poland’s accession to the EU. The increase in demand was first observed in housing loans, followed by consumer loans. Currently, demand is rising for both housing and consumer loans. At the same time, there are reasons to believe that lending to corporates has recently begun to grow after a long period of stagnation.
314
BIS Papers No 28
It can be argued that banks were insufficiently prepared for the first wave of loan growth and to some extent for the second one: no credit information bureaus operated at all, bank customers’ credit histories were relatively short, and advanced credit risk assessment systems were imperfect or nonexistent. Thus, the scope for proper credit risk assessment was limited. The impact of the previous two waves of accelerated growth in loans to households is worth mentioning here. In both cases, the rapid increase in lending caused a deterioration in loan quality. The surge in lending also had an adverse macroeconomic impact. Traditional monetary policy instruments proved ineffective with regard to the first wave of growth in lending, although real interest rates were in excess of 10%, and required reserves amounted to 20%. In these circumstances, the National Bank of Poland (NBP) decided to adopt a novel solution. Six- and nine-month term deposits with higher-than-market interest rates were offered to individuals. This forced banks to offer higher interest rates on deposits. With unchanged lending margins, this meant that they had to raise interest rates on loans, which limited the growth in lending. During the second wave of growth in lending, the increase in internal demand fuelled inflation and the current account deficit (which exceeded 8% of GDP in 1999). This threatened the macroeconomic stability of the country. Since rapid fiscal adjustments were not possible, the burden of stabilising the economy had to be shouldered by monetary policy (cf. shaded areas in Figure 1, Appendix 1). Real interest rates went as high as 15% during this time. The monetary policy decisions made by the NBP after the two first growth waves not only enabled the inflation rate to resume its downward trend, but also limited the adverse consequences of rapid growth in lending for banks. Banks’ earnings deteriorated, but not to an extent which might have endangered the stability of the financial system. At the moment, the current account deficit is not a major issue. The high central budget deficit remains a problem, although certain measures have been taken aiming to curb it. For their part, banks are already using information collected by the Credit Information Bureau and have developed their own credit risk assessment systems, which have been used and perfected for several years now. However, the current growth in loans has led to new challenges for banks as well as new threats to the stability of the financial system. It also poses new dilemmas for the National Bank of Poland. Should the central bank respond to excessively fast growth in lending despite the fact that inflation and the current account deficit are low? Does the fact that Poland adopted a floating exchange rate regime over five years ago have an impact on the effectiveness of traditional monetary policy instruments in limiting lending? In order to find answers to these monetary policy dilemmas, the reasons for the current growth in lending should be examined in more detail.
1.3
Reasons for the current wave of growth in lending
The current wave of loan growth has been caused both by supply- and demand-side factors: Supply-side factors: •
The high rate of increase in loans to households is to some extent the consequence of stagnation in corporate lending. Businesses do not borrow because they have considerable amounts of available funds. The absence of growth in lending to corporates results in banks competing for retail customers because the rise in loans to households allows them to compensate for the relatively lower interest income on loans to corporates.
•
With banks focusing their activities on the household sector, competitive pressure grows. Banks compete for new customers in the household sector by decreasing loan prices (both spreads and fees) and easing credit standards - they offer e.g. low lending margins which exceed market interest rates by 1 percentage point, and remain fixed through the duration of the loan agreement. The trend towards easing loan terms and conditions as well as credit standards by banks has also been indicated by the results of surveys on the loan market condition. The trend towards the easing of lending policies with regard to consumer loans has been noticeable among banks since the research was first conducted, i.e. from December 2003 (with the exception of the third quarter of 2004, i.e. directly after the considerable easing of credit standards). With regard to housing loans, it has been observed since the second quarter of 2004. The tendency towards easing loan terms and conditions as well as credit standards with regard to loans to households has become more pronounced since the end of 2004, especially in the consumer loan segment. At the end of
BIS Papers No 28
315
June 2005, however, banks did not expect further easing of lending policies in the consumer loan segment in the third quarter of 2005.1 3 •
The development of bank loan distribution channels - banks’ cooperation with loan intermediaries and financial consultancy firms as well as the increased importance of active customer acquisition. According to estimates by analysts in the loan intermediation sector, loan intermediaries and financial consultants (who sometimes are part of the banks’ capital groups and sometimes just cooperate with banks with which they have no capital links) are involved in about one quarter of the loans to households recorded on banks’ balance sheets. Easy availability is one of the reasons for the considerable importance of loans extended by intermediaries - loans are offered at the same places where goods purchased on credit are sold.
Demand-side factors: •
Housing market conditions and the expected rise in property prices. The expected increase in the VAT rate on land for property development after May 1, 2004 fuelled demand for housing units and housing loans at the beginning of 2004. This increase in demand was also related to the expected rise in housing prices after Poland’s accession to the EU. Currently, demand for housing is being stimulated by the expected rise in home prices - due to the increase in the VAT rate on newly constructed homes to 22% from January 1, 2008, among other factors.
•
Demographic factors. The entry of the 1970s/1980s population boom generation into the housing market as well as migration from rural areas and small towns to large cities are fuelling demand for homes and home purchase financing.
•
The gradual improvement in households’ financial standing caused primarily by better labour market conditions, and the increased importance of income from work abroad as well as an improvement in farmers’ financial standing due to the introduction of Common Agricultural Policy subsidies have led to an increase in disposable income and an upward adjustment in households’ expectations concerning disposable income. This adjustment was also caused 4 by an improvement in expectations after Poland’s accession to the EU. Due to households’ higher disposable income, more of them attain the creditworthiness required by banks, and therefore the numbers of potential bank customers increase. However, rising disposable income leads to an increase in current consumption. Both factors fuel the growth in lending.
•
The wealth effect linked to the appreciation of the zloty against foreign currencies may also have an impact here. On the one hand, households that took out foreign currency loans at a lower zloty exchange rate pay lower loan instalments now, which makes their disposable income higher than expected. On the other hand, the net value of their assets (the value of the purchased home less the amount of loan to be repaid) also increases. Both factors may fuel current consumption. If exchange rate trends reverse, i.e. the zloty depreciates against foreign currencies, the mechanisms mentioned above will become detrimental to borrowers and potentially banks as well.
•
Low interest rates, which encourage households to increase their debt and purchase goods on credit (this issue will be discussed in more detail in section 2.4).
•
Rapid growth in credit card issuance. This form of payment and financing for consumer purchases is becoming more popular, which accelerates the increase in debt. The easing of credit card criteria and competition between banks eager to win customers are also fundamental causes for this growth.
Surveys on loan market conditions conducted by the NBP indicate that, according to banks, during the recent period (the second and third quarters of 2005), the easing of lending policies was one of the 5 most important factors behind the growing demand for both housing and consumer loans. Therefore,
3
Senior Loan Officer Opinion Survey on Bank Lending Practices and Credit Conditions, NBP, www.nbp.pl, July 2005.
4
The Household Barometer (IRG) and the Consumer Optimism Index (Ipsos) show that the improvement in attitudes in 2004 was mainly caused by a more favourable assessment of Poland’s current and future economic situation.
5
Senior Loan Officer Opinion Survey, NBP, www.nbp.pl, April and July 2005.
316
BIS Papers No 28
the current growth in lending is largely fuelled not only by demand-side but also by supply-side factors. This may have adverse consequences for the future quality of loans to households, since banks may grant loans to persons with increasingly low creditworthiness.
1.4
The importance of interest rate convergence for financial stability
Intensified competition in the banking sector has significantly facilitated access to loans for the real economy sector, particularly for households. This would not have been possible had inflation not stabilised at a low level, however. Low inflation has not only led to a decrease in both nominal and real interest rates, but has also allowed the stabilisation of spreads, which in turn has significantly reduced interest rate risk (cf. Figures 3-6). However, better credit risk assessment capabilities and an improvement in the financial standing of households have brought down the ratio of lending margins (as compared to the market interest rate) to the loan interest rate. Having reduced their lending margins, banks compete by reducing fees and commissions on loan agreements. All these factors have significantly reduced the cost of loans. Extended loan terms as well as easier access to foreign currency loans with lower interest rates have made borrowing more affordable for a larger number of people. It should be stressed, however, that there is still considerable room for reducing the cost of loans and improving access to them, in particular with regard to consumer loans and loans to small and medium-sized enterprises. Figure 3 Average nominal interest rate (zloty loans)
nominal interest rate
30 25 20 15 10 5
1Y loans to corporates
12.2004
12.2003
12.2002
12.2001
12.2000
12.1999
12.1998
12.1997
12.1996
0
Loans to households
Source: NBP.
Figure 4 Average real interest rate (zloty loans)
real interest rate
20 15 10 5 0 12.2004
12.2003
12.2002
12.2001
12.2000
12.1999
12.1998
12.1997
12.1996
-5
1Y loans to corporates (deflated by PPI) Loans to households (deflated by CPI) 1Y loans to corporates (deflated by CPI)
Sources: GUS and NBP data, own calculations.
BIS Papers No 28
317
Figure 5 Loan-deposit spread 14 12 spread
10 8 6 4 2
Corporate sector
12.2004
12.2003
12.2002
12.2001
12.2000
12.1999
12.1998
12.1997
12.1996
0
Household sector
Sources: NBP data, own calculations.
Figure 6
12 10 8 6 4 2 0
1Y loans to corporates
12.2004
12.2003
12.2002
12.2001
12.2000
12.1999
12.1998
12.1997
-2 12.1996
average interest rate loans - WIBOR average interest rate on om loans - WIBOR 3M 3
Spread on average loan
Loans to households
Sources: NBP data, own calculations.
Figure 7 Average interest rate on consumer loans
07.2005
03.2005
11.2004
07.2004
03.2004
11.2003
07.2003
03.2003
11.2002
07.2002
03.2002
20% 18% 16% 14% 12% 10% 8% 6% 4% 2% 0%
Consumer loans (PLN)
Housing loans (PLN)
Loans granted in USD*
Loans granted in EUR*
* The NBP has no data concerning interest rates on loans granted in CHF. Source: NBP data.
318
BIS Papers No 28
The fact that nominal and real interest rates on loans to households are higher than those in the corporate sector (cf. Figures 3 and 4) results from the higher average interest rates on consumer loans other than housing loans (e.g. authorised overdrafts or credit card loans). The cost of loans to households is significantly lower for housing loans and foreign currency loans (cf. Figure 7). In Poland, as in other European countries undergoing systemic transformation, foreign currency loans have come to play an important role (ca. 32% of the loan portfolio at the end of June 2005). The share of foreign currency loans in the portfolio is increasing, particularly with regard to housing loans. Due to the stabilisation in inflation and the concurrent gradual convergence in nominal interest rates, 6 the difference between interest rates on zloty and foreign currency denominated loans has significantly decreased in Poland recently (particularly for housing loans), which has also lead to a rapid growth in zloty loans (cf. Figure 7). In this context, a question arises: can achieving interest rate convergence before joining the euro area be dangerous for financial system stability? There are mechanisms at work here that have both favourable and adverse impacts on financial system stability. On the one hand, low interest rates improve access to loans and contribute to an increase in lending, which, given intense competition for market share, may lead to a deterioration in portfolio quality in the future. Excessively rapid growth in lending also poses a risk of higher inflation and current account imbalance. On the other hand, under fully liberalised capital flows and a floating exchange rate, domestic interest rates on par with foreign ones encourage an increase in domestic currency debt. Until recently, Poles used to borrow extensively in euros and dollars, while currently only loans denominated in Swiss francs really compete with zloty loans. It appears, however, that the risk to financial stability linked to decreasing domestic interest rates is lower than that caused by higher domestic interest rates. The Czech Republic is an example of a country in our region which achieved interest rate convergence much earlier than Poland. The increase in lending there has not been rapid enough to threaten the stability of the banking system.
2.
Alternative sources of funding for the real economy (other than loans) the disintermediation phenomenon
The importance of the capital market and other forms of external financing is increasing, but remains limited. The increased capitalisation of the stock exchange has largely been the result of privatisation (funds obtained in this manner go to the central budget and not to businesses), a rise in the value of listed companies and the fact that shares of major foreign companies have been listed on the stock exchange since 2002. Growing capitalisation has not resulted from an increased importance of the capital market in raising funds by domestic businesses. The size of the market for non-government debt securities, issued by corporates, remains small compared to bank lending to corporates (cf. Table 1). Surveys conducted by the NBP also indicate that bank loans remain the most important source of external corporate financing. To a large extent, enterprises resort to internal financing or accumulate liabilities arising from services and supplies (trade loans). 7 A slightly different picture emerges when the ratio of funds obtained by businesses from new stock and debt security issues is compared to the increase in lending to the corporate sector in subsequent years (cf. Table 2). It should be noted that the higher level of this ratio between 2001 and 2003 was the result of deliberate lending policies implemented by banks (the tightening of lending policies in response to a significant increase in delinquent loans). The dominance of non-bank financing in 2004 (bank lending to this sector decreased at this time) resulted from low demand for loans by corporates and not from a significant rise in funds obtained on the capital market. After a considerable improvement in earnings, enterprises accumulated a large amount of liquid funds (mainly deposits) from 2003 onwards and repaid existing loans rather than drawing new ones. The deleveraging, which happened on a micro scale, caused a nominal decrease in corporate sector debt in 2004.
6
The phenomenon of interest rate convergence discussed here refers to short-term market rates, since a significant majority of zloty loans are floating-rate loans.
7
Wybrane determinanty rozwoju rynku akcji i korporacyjnych instrumentów dłużnych w Polsce. Wyniki badania ankietowego, NBP, www.nbp.pl, 2004, p. 12-13.
BIS Papers No 28
319
Table 1 Stock exchange capitalisation, the non-government debt securities market and lending to corporates In millions of zloty Millions of zloty
Year
Stock exchange capitalisation
1994 1995 1996 1997 1998 1999 2000 2001 2002 2003 2004 2005 *
% of GDP
Nongovernment debt securities issued by enterprises
Loans to corporates
– – – 3,107 6,989 8,488 13,311 15,039 16,072 16,343 17,235 18,218
30,936 38,218 50,592 54,511 69,856 89,552 106,711 119,852 123,561 124,725 126,535 121,540
7,450 11,271 24,000 43,766 72,442 123,411 130,085 103,370 110,565 167,717 291,698 337,601
Stock exchange capitalisation
Nongovernment debt securities issued by enterprises
– 3.4% 5.8% 8.7% 12.3% 18.9% 18.0% 13.6% 14.2% 20.6% 32.9% 36.1%
– – – 0.6% 1.2% 1.3% 1.8% 2.0% 2.1% 2.0% 1.9% 1.9%
Loans to corporates
– 11.6% 12.2% 10.8% 11.9% 13.7% 14.7% 15.8% 15.8% 15.3% 14.3% 13.0%
Sources: WSE, NBP.
Table 2 Funds obtained on the capital market and the increase in the size of the non-government debt securities market versus changes in bank lending to the corporate sector In millions of zloty
Year
Funds obtained on the stock exchange1 (A)
1994 1995 1996 1997 1998 1999 2000 2001 2002 2003 2004
1,657 700 1,391 4,110 3,827 4,856 3,577 2,918 567 1,472 4,919
Increase in the size of the nongovernment debt 2 securities market (B) – – – – 3,882 1,499 4,823 1,728 1,033 270 892
Increase in loans to corporates (C)
(A+B)/C, %
7,281.5 12,374.3 3,918.9 15,345.3 19,695.4 17,159.1 13,141.6 3,708.9 1,163.4 1,810.5 –4,994.8
23% 6% 35% 27% 39% 37% 64% 125% 138% 96% n/d
1
Excluding issues related to privatisation. The data do not include funds which have been withdrawn from the capital market 2 (where stock has been redeemed and the company delisted). Issued by businesses. Figures for 1998-1999 include bank bonds. Sources: Fitch Polska, Polish Securities and Exchange Commission, NBP.
320
BIS Papers No 28
Among the forms of external financing available to corporates, the non-government debt securities market has developed at the fastest rate in recent years (cf. Table 2). It should be stressed, however, that this source of funding is only cost-efficient for large enterprises. In Poland, an issue of bonds by even a medium-sized enterprise could be unsuccessful or prove too expensive. The increased importance of lease agreements in recent years has been largely caused by changes in tax regulations and regulations allowing the leasing of lorries by companies. Due to the impending elimination of VAT deductions, including VAT deductions on passenger vehicle purchases, vehicle leasing became more widespread in 2003 and 2004 (cf. Table 3). Leasing should see further growth, however, since it is still more attractive from a financial standpoint than taking out bank loans. The fact that the European Commission considers expenditures arising from lease agreements to be eligible for subsidies from the European Regional Development Fund may contribute to a rapid increase in the 8 significance of such agreements for corporate financing in Poland. Table 3 Value of leased assets versus lending to the corporate sector In millions of zloty Movables (A)
Property (B)
Total A+B (C)
Loans to corporates (D)
C/D, %
1999
5,863
7,544
13,406
106,711
12.6%
2000
8,937
3,060
11,997
119,852
10.0%
2001
5,128
6,445
11,573
123,561
9.4%
2002
7,281
7,841
15,122
124,725
12.1%
2003
10,456
625
11,081
126,535
8.8%
2004
11,822
1,930
13,751
121,540
11.3%
Sources: Polish Association of Leasing Companies, NBP.
The relative increase in the importance of non-bank forms of corporate financing in recent years has been primarily the result of an absence of growth in lending. In view of the expected increase in loans to corporates, the role of banks in corporate financing should grow again. Despite the fact that no real growth was observed in lending to corporates over the last five years, banks see opportunities for loan growth in this sector, particularly with regard to small and medium-sized enterprises (SMEs). Their offer for SMEs is developing and the survey on the loan market condition indicates that banks are easing loan terms and conditions as well as credit standards in this sector, 9 which may result in a growth in lending to SMEs in the immediate future. Therefore, the disintermediation phenomenon has not emerged in Poland to a degree that might threaten the dominant position of banks with regard to funding the corporate sector in the near future. It should also be noted that banks are shareholders in large leasing companies. In situations where a given leasing company is not owned by a bank, this company will refinance (at least in part) the purchase of leased movables or property using a bank loan. Both types of relationships between banks and leasing companies either encourage lending to leasing companies or at least have a favourable impact on the banks’ consolidated earnings (higher potential profits from holding equity interest in subsidiaries - leasing companies). In the case of the non-government debt securities market, although banks lose potential borrowers, as underwriters they gain income from commissions and fees for preparing and conducting debt issues through which enterprises obtain funding. Although the non-government debt securities market has considerable potential for development, which may
8
Financial System Development Report, National Bank of Poland, www.nbp.pl, 2005.
9
Senior Loan Officer Opinion Survey on Bank Lending Practices and Credit Conditions, NBP, www.nbp.pl, July 2005.
BIS Papers No 28
321
lead to a slowdown in lending to the corporate sector in the future, surveys conducted by the NBP do not indicate that this market could become the main source of corporate financing in future years. 10
3.
Challenges related to changes in bank loan structure
The increase in household sector debt, which has mainly been linked to financing home purchases, poses new challenges for banks as well as new threats to banking sector stability. The post-accession experience of Portugal and Greece indicates that a potentially prolonged period of heightened demand for housing loans should be expected in Poland. Therefore a liquidity shortfall problem may emerge in the coming years, forcing banks to look for other long-term sources of financing housing loans. Currently, banks finance loans mainly through deposits whose maturity is much shorter than that of loans. At the same time, the loan growth rate is faster than that for deposits. Additionally, corporate deposits, which are a less stable source of bank financing than deposits from individuals, have played an important role in financing banking activity in recent years. If the expected economic recovery materialises, funds obtained from corporate savings will become the primary financing source. Only some of those funds will return to the banking sector as deposits. It should also be remembered that intense competition from non-bank financial institutions will be a factor. Households use an increasing proportion of their savings to purchase investment fund participation units or deposit their savings in credit unions. Banking supervision authorities are currently discussing possible solutions to this problem with banks. Banks are considering whether to resort to a greater extent on such methods of financing as bank bond issues or asset securitisation. Limiting the amount of claims on the financial sector (primarily from abroad) may also be a source of asset financing for banks. At the end of 2004, such claims constituted 12.2% of assets. Such measures could have a significant impact on exchange rate movements. The importance of obtaining financing from parent banks may also grow. The example of NyKredit Polska bank, which recently ceased to operate in Poland as an independent bank, and opened a branch office of the Danish parent bank, indicates that this is a possible trend. As a result, the management board of the company intends to offer mortgage loans in Poland that will be refinanced on the Danish mortgage bond market. However, research conducted by the NBP indicates that the liquidity shortfall problem in Poland will not be as acute as in 11 Portugal and Greece. Banks operating in Poland have little experience with long-term products - they have not researched the life cycle of housing loans, among other things. Despite the fact that expertise may be transferred from parent banks, the insufficient understanding of the specific features of housing loans in Polish conditions poses new challenges related to credit risk management. The growing share of property loans in banks’ loan portfolios makes them more exposed to collateral risk. In particular, the exposure of the banking sector to the risk stemming from price movements in the real estate market is increasing. At the moment, however, the increase in prices is not considered excessive. 12 On the other hand, banks are increasingly exposed to the risk of deterioration in the quality of mortgages used as collateral. For example, the amendments introduced to the Civil Code in the last year require that substitute housing be provided to occupants upon eviction, which significantly limits the possibility of enforcing claims against mortgages. 13 The growing share of foreign currency debt increases banks’ exposure to indirect foreign exchange risk through their customers’ open foreign exchange positions. Research conducted by the NBP in 2003 concerning the impact of the exchange rate on the quality of foreign currency loans indicated that this relationship was statistically significant. 14 In 2003, the zloty depreciated by more than 20%
10
Wybrane determinanty rozwoju rynku akcji i korporacyjnych instrumentów dłużnych w Polsce. Wyniki badania ankietowego, NBP, www.nbp.pl, 2004, p. 33-36.
11
Michał Broza-Brzezina, Lending Booms in Europe's Periphery: South-Western Lessons for Central-Eastern Members, paper presented at the DAMS science seminar on February 1, 2005 r (mimeo).
12
Financial Stability Report - 2004, National Bank of Poland, www.nbp.pl, 2005, p. 45-48.
13
Pursuant to the Civil Code, this obligation rests on the municipality and on the debtor, and finally on the creditor.
14
Financial Stability Report - 2003, National Bank of Poland, www.nbp.pl, 2004, p. 120-130.
322
BIS Papers No 28
against foreign currencies and there was a danger that this might jeopardise the repayment of foreign currency loans taken out when the domestic currency was stronger. Banking supervision authorities stressed the importance of foreign exchange risk at that time and now it is taken into account when granting foreign currency loans, e.g. by stipulating stricter requirements concerning the borrower’s acceptable income compared to zloty loans. The National Bank of Poland has recently developed a new tool for assessing loan market conditions. Quarterly surveys, which have been conducted by the NBP since the end of 2003, make it possible to obtain a full picture of changes in loan market conditions with regard to both the supply and demand sides, and provide sufficiently early warning of adverse trends. Market participants as well as banking supervision authorities are increasingly interested in the results of the survey. The survey signalled the recovery in lending to corporates at an early stage, so its future findings may prove useful in forecasting movements in lending. 15 It also predicted the EU accession effect - an above-average increase in demand for loans and an extraordinary easing of lending policies in the second quarter of 2004. The latest edition of the survey has enabled the identification of a new trend in the Polish loan market: the easing of credit standards and loan terms and conditions, which has continued for a long time despite the steadily rising demand for loans, has caused a situation where the demand for loans is amplified by the banks’ decisions with regard to lending policies. In the latest edition of the survey, banks indicated that in terms of the household sector, easing loan terms and conditions as well as credit standards was the main reason for the growing demand for housing and consumer loans. 16 Thus according to the banks, their lending policies are currently the most important factor generating demand for consumer loans. Since the NBP is aware of this, it may respond to any adverse trends early enough to mitigate the threat to banking sector stability should the financial standing of banks’ customers deteriorate. The growth in lending may pose a problem given interest rate convergence. The ability of the central bank to influence long-term interest rates is limited due to the expected convergence in long-term interest rates. Should the proportion of foreign currency loans in bank assets rise, which would lower the efficacy of interest rates as monetary policy instruments, the central bank might respond by using supervision tools.
Bibliography 1.
Michał Broza-Brzezina, Lending Booms in Europe's Periphery: South-Western Lessons for Central-Eastern Members, paper presented at the DAMS science seminar on February 1, 2005 r (mimeo).
2.
Financial Stability Report - 2003, National Bank of Poland, www.nbp.pl, 2004, p. 120-130.
3.
Financial Stability Report - 2004, National Bank of Poland, www.nbp.pl, 2005, p. 45-48.
4.
Senior Loan Officer Opinion Survey on Bank Lending Practices and Credit Conditions, NBP, www.nbp.pl, April 2005.
5.
Senior Loan Officer Opinion Survey on Bank Lending Practices and Credit Conditions, NBP, www.nbp.pl, July 2005.
6.
Wybrane determinanty rozwoju rynku akcji i korporacyjnych instrumentów dłużnych w Polsce. Wyniki badania ankietowego, NBP, www.nbp.pl, 2004.
15
The available time series, which currently consists of only eight samples, does not enable the construction of reliable forecasting models.
16
Senior Loan Officer Opinion Survey on Bank Lending Practices and Credit Conditions, NBP, www.nbp.pl, July 2005.
BIS Papers No 28
323
324
Chart 1 Bank claims on the real economy sector Y/y, millions of zloty 30,000
yr on yr growth - millions of zloty
25,000 20,000 15,000 10,000 5,000 0 -5,000 -10,000
Source: NBP.
BIS Papers No 28
Source: NBP.
Housing loans
months Other loans
06-2005
03-2005
12-2004
09-2004
06-2004
03-2004
12-2003
09-2003
06-2003
03-2003
12-2002
09-2002
06-2002
03-2002
12-2001
09-2001
06-2001
03-2001
12-2000
09-2000
06-2000
03-2000
12-1999
09-1999
06-1999
03-1999
12-1998
09-1998
06-1998
03-1998
12-1997
yryrononyryrgrowth - millions zloty growth - millionofzloty
BIS Papers No 28
Chart 2
Bank claims on households Y/y, millions of zloty
25,000 25 000
20,000 20 000
15,000 15 000
10,000 10 000
55,000 000
0
325
Banking sector issues in Saudi Arabia Abdulrahman Al-Hamidy 1
I.
Banks and Aggregate Credit: What Is New?
1.
Aggregate Claims of Banks
During the decade from 1 January 1995 to 31 December 2004, banks’ claims on the private sector (including loans and securities) increased by 177%, from SAR 113 billion to SAR 313 billion. In the same period, banks’ claims on the public sector increased by 129%, from SAR 77 billion to SAR 176 billion. Consequently, claims on the public sector declined from 40.5% of total claims to 36%, while the private sector’s share of claims has increased from 59.5% to 64%.
2.
Claims on the Private Sector
In the private sector, bank credit increased from SAR 107 billion in 1995 to SAR 303 billion in 2004. Investment in private securities remained stable and insignificant as it grew from SAR 6.1 billion to SAR 10.9 billion during the same period. Within the loans, advances and overdraft segment, the greatest increase occurred in the area of loans to consumers and for credit cards. These were less than SAR 5 billion in 1995, and by 31 December 2004 they reached SAR 119 billion, an increase of 24 times. In the same period, credit card loans, which amounted to approximately SAR 2 billion in 1995 (40% of consumer loans) only increased to SAR 3.3 billion by 2004. Their relative percentage declined from 40% to about 3% of total consumer loans. As of end-2004, 3% of total consumer loans were for credit cards, 7% were for real estate financing, 24% for cars and equipment and 66% for miscellaneous purposes. The trend for growth in consumer loans has continued strongly in 2005, and by the end of June total consumer loans were SAR 152.7 billion, of which outstanding credit card loans were SAR 3.5 billion (2.3%), real estate financing was SAR 10.9 billion (7.1%), car and equipment loans were SAR 29.1 (19.1%) and miscellaneous loans were 109.1 (71.5%). The miscellaneous loans include loans taken for durable consumer goods, education, travel and shares trading.
3.
Reasons for Growth in Consumer Loans
The underlying reasons for this rapid growth in consumer loans are as follows: 1.
A youthful and rapidly growing population that wishes to finance automobiles, education, vacations, housing, shares trading, etc.
2.
The ability of Saudi banks to secure an assignment of salary for consumer loans. This collateral has been designed through the creation of an interbank payment system that permits the transfer of customer salaries from employers to any bank account in the Kingdom. Thus, banks can secure their loans by a tripartite agreement between the employer, the employee and the bank which gives the bank a first right on the customer salary. This has been the key catalyst for the rapid development of consumer finance.
3.
The establishment of the Saudi Credit Bureau, which provides banks with up to date information on customers’ creditworthiness.
4.
Banks have also introduced new types of consumer loans for margin trading (secured by shares) and loans secured by real estate.
1
Deputy Governor for Technical Affairs, Saudi Arabian Monetary Agency.
BIS Papers No 28
327
4.
Private Sector Claims by Economic Activity
The table below shows the major areas of growth in bank credit, by economic activity.
Table 1 Bank Credit by Economic Activity January 1995 Agriculture and Fishing
December 2004
Increase
% Increase
2.7
3.8
1.1
41
12.9
26.6
13.7
106
Mining
0.8
1.3
0.5
62
Electricity and Water
2.6
3.3
0.7
27
Building and Construction
14.1
23.1
9.0
64
Commerce
28.3
62.8
34.5
122
Transport and Communication
6.2
13.4
7.2
116
Finance
8.4
33.8
25.4
302
Service
3.8
12.3
8.5
223
27.3
122.8
95.5
349
107.1
303.1
196.0
183
Manufacturing and Processing
Miscellaneous Total
It is evident from the above that the greatest increase (349%) was in the miscellaneous category, which was 40.5% of total private sector credit, of which a substantial portion was represented by consumer loans (73%). As already noted above, this economic activity was the area of fastest growth. Another area of rapid growth (30%) was the finance sector, which, apart from the banks, now includes insurance companies, mutual funds, leasing companies and other finance sector related entities. Finance sector activities also include those related to share trading. While the service sector also showed a sharp increase of 223% in the decade, its overall volume was relatively small (about 3.5% of total credit). Other economic sectors, such as commerce, transport and communications, and manufacturing and processing, doubled in the decade, but their relative size in the overall credit extension declined. There was little growth in the agriculture and fishing sector due to the cutback in government subsidies. Also, the electricity, water and utilities sector declined due to a mature utilities infrastructure which did not require major new investments.
5.
Extension of Credit to the Public Sector
During the period 1995-2004, claims on the public sector increased from SAR 77 billion to SAR 176 billion, an increase of 129%. The following table provides some details on the components of this increase.
Table 2 Bank Claims on the Public Sector (1995-2004) 1995
2004
Total
77
176
99
193
Loans and Advances
27
29
2
7.5
Treasury Bills
11
0.3
Government Bonds
39
146
328
Increase
(10.73) 107
% Increase
(97) 274
BIS Papers No 28
The Table 2 indicates that the volume of loans to public sector enterprise did not increase by much in the last decade. This could be largely attributed to the strong fiscal position of the government, which has been able to finance many of the government sector projects from its own resources.
6.
Changes in Banks’ Holdings of Government Securities
In terms of government securities, the popularity of treasury bills declined considerably due to the introduction of the Saudi Riyal Interbank Express System introduced in 1996. Also, there is greater flexibility in the government bonds market, where SAMA has permitted banks to repo up to 75% of their holdings. Nevertheless, government bonds were popular as an investment vehicle and increased by 274% in the decade. Their popularity can be attributed to strong yields, help in maintaining liquidity, ability to repo and the development of a secondary market. While the growth in total government securities was about 193% over the decade, their relative share in overall credit declined by about 5%. This is because in the last 3 years, the government’s fiscal situation improved significantly due to a rise in oil prices and non-oil revenue, and there was a decline in the government offering of securities in the market. Part of the government surplus was targeted towards repayment of government debt, which is almost all in form of government securities.
7.
Banks’ Sources of Funds
During the decade 1995-2004, bank deposits increased from SAR 188 billion to SAR 422 billion, an increase of SAR 234 billion (125%), while capital and reserves increased by 109%. The table below indicates the changes:
1995
2004
Increase
% Increase
Demand
81
203
122
151
Time and Saving
51
136
85
167
Other Quasi-Monetary
56
83
27
48
188
422
234
125
Foreign Liabilities
39
46
7
18
Capital and Reserves
33
69
36
109
Other Liabilities
72
118
46
64
332
655
323
86
Total Deposits
Total
8.
Changes in Deposit Structure
In terms of funding sources, by end-2004, the relative share of demand deposits to total deposits increased to 48% (1994 - 43%) and the share of time and savings deposits also increased to 32% (1994 - 27%). There was a decline in other quasi-monetary deposits, which dropped from 30% to 20% as a percentage of total deposits. The major reasons for these changes include: •
Greater demand for Islamic (non-interest) banking services. Consequently, demand deposits showed rapid growth, increasing by 151% the decade.
•
Time and savings deposits also increased, particularly as businesses and public sector entities use such deposits to generate income for their enterprise.
•
A decline came about in foreign currency deposits, which indicates that Saudi banks have ample liquidity and are relying less on regional and international markets to raise liquidity. There has been a noticeable decline in foreign currency interbank activities.
•
Only the outstanding remittance balances in the other deposits increased by over 200%, but they remained a small percentage (less than 2%) of total deposits.
BIS Papers No 28
329
9.
Changes in Share Capital and Reserves
Apart from deposits as a source of funding, Saudi banks increased their capital and reserves by 109% during the decade. Total capital and reserves increased from SAR 33 billion to SAR 69 billion. This was done by means of new flotations of shares as well as retention of profits.
10.
Long-Term Funding
A recent but growing trend which started in 2004 and is becoming increasingly popular for Saudi banks is to raise long-term funds in the international markets. These take the form of syndicated loans, Eurobonds and notes. In the past two years, almost half a dozen substantial transactions of this type have been carried out, and others are in progress. This trend will have an increasing impact on banks’ activities in future years and will enable them to grow their operations.
II.
An Evaluation of Major Structural Changes: Increased Role of Foreign Banks
1.
Evolution of the Banking System and Foreign Banks’ Participation
Foreign banks’ presence in Saudi Arabia can be traced back to 1926, when the Netherlands Trading Company, later to become Algemene Bank Nederland (ABN) began operations. It enjoyed a virtual monopoly until the late 1940s. In 1947, Banque Indo Chine opened a branch, followed by the Arab Bank Limited (1949), the British Bank of the Middle East (1950) and the National Bank of Pakistan (1950). In October 1952, the Saudi Arabian Monetary Agency (SAMA) was established by the Saudi government with primary responsibility for monetary stability. Following SAMA’s creation, the government followed an open and liberal policy and permitted the opening of new foreign bank branches, including Banque de Caire, Banque du Liban et d’Outremer and First National City Bank of New York. This first wave of foreign banks linked Saudi Arabia firmly with the global financial markets and encouraged a competitive domestic environment. During this period, three domestic banks were also licensed. The National Commercial Bank was licensed in 1953, Riyad Bank started operations in 1957 and Al-Watany Bank in January 1958.
2.
Conversion of Foreign Bank Branches to Joint Stock Companies
By 1975, 10 international banks with 29 branches were present in the Kingdom. These institutions operated as branches of their parent companies but, in 1976, a decision was taken by the Saudi government that these should become incorporated as local banks with majority Saudi shareholdings. The major reason for this important policy decision was that with the boom in oil revenues in the mid-1970s, the Saudi economy expanded and grew very rapidly. This led to sharp rise in demand for banking products and services which the existing banks found difficult to cope with. The government quickly recognized the need for larger and more sophisticated banks. It also observed that capital invested in the banking sector was insufficient and inhibited banks from investing in branch networks, implementing new technology and training human resources. While the government encouraged all foreign banks to invest more capital, it realized their constraints and also noted that many local investors were ready to make large capital investments for developing the banking system. Consequently, in 1976 the Council of Ministers (the final legislative authority) offered foreign banks operating in the Kingdom a chance to form joint venture banks with Saudi shareholders. This decision required foreign banks to convert their branch operations to Saudi joint stock companies in which they could retain up to a 40% shareholding. In subsequent years, all foreign banks accepted these proposals and formed joint ventures as there were a number of incentives offered, including the following: •
330
The new joint venture banks were accorded full national treatment at par with fully owned Saudi banks. They were permitted to rapidly expand their branch networks and to access all the benefits and privileges available to local banks.
BIS Papers No 28
•
The foreign partners were offered and encouraged to take on Technical Management Agreements for the operation of joint venture banks. Thus, they exercised considerable management influence over the banks’ affairs and continued to provide human, technical and other expertise and resources.
•
All joint venture banks were given a tax-free holiday period of five years from the dates of their conversion. These tax-free periods were subsequently extended for an additional five years.
•
The creation of joint stock Saudi banks whose shares were held by a large number of investors also contributed to the development of the Saudi shares market as bank shares quickly became popular among investors. This further contributed to the increase in value of investments owned by foreign shareholders.
•
The conversion of foreign bank branches into joint venture banks also had prudential implications as the move permitted all banks to substantially increase their capital base. This helped banks to stay liquid and creditworthy despite the subsequent domestic and international economic turbulences they faced in the 1980s and 1990s.
Following these changes, during the period from 1982 to 2000, no new foreign or domestic banks except one were granted a license, as the government believed that the country was adequately served by the existing branch network. During the 1990s, the banking system made large investments in the payment systems infrastructure and in technology-based customer products and services. These include automated teller machines, point of sales terminals, telephone and internet banking, electronic share trading, etc. Consequently, while the banking system expanded greatly in size and scope of its activities, there was only limited expansion in the banks’ branch network. Nevertheless, the Saudi banking system currently has a presence of more than a dozen foreign bank shareholders from many parts of the world. Their shareholdings range from less than 1% to 40% of a bank’s total capital. In addition, there are international banks with full branch operations.
3.
Recent Policy Developments for Participation of Foreign Banks
The Saudi Arabian financial system has always been open to foreign presence. The government has encouraged this policy to promote trade, investment and economic relations, and to attract expertise and technology. It already has considerable foreign investor presence as eight of the eleven banks have substantial foreign ownership. Many of the foreign partners in Saudi joint venture banks have technical management agreements. In past five years, Saudi Arabia has licensed a number of GCC (Gulf Cooperation Council) banking institutions, as a result of a decision of the GCC Summit to permit reciprocal opening of their banking markets. In this connection, Gulf International Bank of Bahrain was granted a license in September 2000 to open a branch in Saudi Arabia. This was followed by the grant of branch licenses to the Emirates Bank International, the National Bank of Kuwait, the National Bank of Bahrain and Bank Muscat. Two of these banks are already operational, while the other three are planning to commence operations over the next 12 months. The government has also decided to allow major international banks from different parts of the world to obtain banking licenses. To this end, branch banking licenses have been granted to three major international banks: BNP Paribas, Deutsche Bank and JPMorgan Chase. These banks are now in the process of opening their branches. More recently, in August 2005, Saudi Arabia granted branch licenses to two regional banks: National Bank of Pakistan and State Bank of India, which are expected to become operational in 2006. It should be noted that with the opening of the branches of these new foreign banks by end-2006, the number of licensed banks in the Kingdom will have doubled since 2000. The entrance of these institutions into the Saudi banking market should enhance competition, support the transfer of technology, improve financial services in all sectors and create employment opportunities. This is part of the Saudi government’s vision for a dynamic financial sector which will also benefit from the participation of non-bank investment and brokerage companies under the recent Capital Market Law, and the participation of insurance companies under the new Cooperative Insurance Law.
BIS Papers No 28
331
III.
Preventing Banking System Crisis: Capital Regulations and Supervisory Oversight
1.
Introduction
The genesis of a modern banking system in Saudi Arabia has its roots in the creation in October 1952 of the Saudi Arabian Monetary Agency (SAMA) with primary responsibility for monetary policy. In 1956, SAMA was granted a new charter with added responsibilities for banking supervision. The charter granted SAMA a great deal of independence and authority.
2.
Growing Pains
The first banking problems faced by Saudi Arabia took place in 1960. Riyad Bank and Al-Watany Bank, which had commenced operations in 1957 and 1959 respectively, faced serious liquidity problems arising from mismanagement and improper loans by board members in both banks. By 1960, Al-Watany Bank was technically insolvent and was unable to settle the claims of local depositors. SAMA liquidated the bank to organize a merger with Riyad Bank, and with the government’s approval, SAMA, on behalf of the government, acquired 38% of the shares of the new Riyad Bank. These events tested the government’s resolve to defend the stability of the nascent banking system. The government not only took action, requiring a merger, but also came in strongly as a shareholder to prevent a bank failure. This sent a clear signal that Saudi authorities wanted to maintain and fully support a strong, stable and credible banking system. Notwithstanding the government’s ownership stake, Riyad Bank continued to operate as a private sector institution with no major intervention from the authorities.
3.
Strengthening of the Regulatory Framework
These banking difficulties led to a new Banking Control Law in 1966, which gave SAMA broad supervisory powers to license and regulate all banks. Banks were required to meet stringent capital adequacy, liquidity, lending ratio and reserve requirements. A system of on- and off-site prudential supervision was introduced, and SAMA strengthened its supervisory capabilities. The law also supported the concept of a universal banking model, which permitted banks to provide a broad range of financial services, including banking investments, securities, etc. Consequently, banks became the primary licensed financial institutions and expanded rapidly, covering the entire country.
4.
Trials and Tribulations
The 1980s were a tumultuous and testing period for Saudi banks and the banking system. In line with the tremendous increase in government revenues in 1979-1981 and subsequent slow-down in 19821986, the Kingdom’s commercial banks saw rapid expansion followed by a difficult period of adjustment, deterioration in asset quality and retrenchment. As oil prices tumbled from an all-time high in 1981 and continued to decline during the next five years, there was significant pressure on the quality of bank assets, which deteriorated with the economic slowdown. Credit to the private sector, which had increased over 500% during the period 1976-1981, only grew at a rate of less than 4% per year over the next five years. The banks suffered from non-performing loans, which increased to over 20% of all loans by 1986. Banks’ profits suffered significantly, and loan loss provisions for doubtful accounts for the banking system had risen to over 12% of total loans.
5.
Causes of the Banking Problems
The causes of the problems faced by Saudi banks arose mainly from the macroeconomic imbalances which were created by a steep rise in government revenues in 1979-1981, followed by a precipitous decline in oil revenues. Government revenues, which had risen to SAR 333 billion by 1981, started a rapid decline and dropped to just over SAR 74 billion by 1987. The rapid growth in bank assets and liquidity in late 1970s and early 1980s had given rise to a sharp increase in demand for private sector credit. Some banks expanded too rapidly, and did not have adequate credit assessment and monitoring procedures. They also lacked required technical expertise, faced a shortage of qualified human resources and had inadequate technology. Consequently, when the steep decline in the economy occurred, many companies and businesses suffered from a lack of liquidity and faced a
332
BIS Papers No 28
credit crunch. The construction and contracting sectors that had boomed earlier faced the biggest setback, and many projects were affected. Banks had difficulties recovering their loans, and the collateral in many cases proved to be difficult to realize.
6.
The Government’s Response
During this period, SAMA, in concert with the Minister of Finance, took a number of steps to ensure the stability of the financial system and to help the banks to overcome the prolonged economic downturn. These included the following; 1.
Banks were required by SAMA to seek its approval prior to announcing their dividends. The Banking Control Law requires all banks to build their statutory reserves equal to their share capital. SAMA further encouraged Saudi banks to build additional reserves to strengthen their capital base.
2.
Most foreign shareholders in Saudi banks enjoyed a tax holiday for the first five years of their ownership. To encourage retention of profits, the tax holiday was extended in most cases by another five years, after which a deferred tax scheme was permitted.
3.
In 1986, SAMA obtained a ruling from the Tax Department that permitted the tax deduction of loan loss provisions on an accrual basis. This encouraged banks to increase their loan loss provisions for doubtful accounts.
4.
To encourage Saudi banks to increase their interbank dealings and to support the development of a riyal interbank market, a tax ruling was obtained which exempted foreign banks from withholding taxes when carrying out interbank transactions with Saudi Banks.
5.
SAMA recognized the need to encourage banks to take strong steps to improve their risk management and control procedures. Consequently, it took major initiatives in the area of corporate governance, requiring banks to develop internal audit departments and implement internal controls.
7.
Major Supervisory Initiatives of the 1990s
Following the difficulties of the 1980s, in the next decade SAMA embarked on a policy of modernizing its supervisory system. The first objective of these policies was to create a suitable infrastructure that required sound corporate governance of banks; a second objective was to introduce international supervisory standards and best practices. In this regard, SAMA issued a range of supervisory requirements, including internal control guidelines for banks, SAMA accounting standards (these were subsequently replaced by IFRS in 1992), fraud prevention guidelines, anti-money laundering guidelines, operational risk guidelines, establishment of the role of audit committees, and external auditors, etc. All of these guidelines were aimed at inculcating a culture of sound corporate management and enhancement of internal controls. In tandem, SAMA introduced a number of supervisory standards emanating from the Basel Committee. These included the 1988 Basel Capital Adequacy Accord (1992), the large exposure standard (1994) and a number of other Basel circulars dealing with liquidity, interest rate risk, credit risk, market risk, etc. In the 1990s SAMA also implemented an electronic (prudential) returns management system, which provides it with important and significant prudential information for use in on- and off-site supervisory functions. Also, following the pronouncement of Basel Core Principles in 1997, SAMA continued to review and evaluate its supervisory practices to ensure that these not only met but exceeded international standards. It is noteworthy that in 1990s the quality of management in the banking sector had improved significantly due to the bad experiences of the 1980s. Consequently, despite the Russian crisis, the bond market crisis, and the Southeast Asian banking crisis in the 1990s, there was no major impact on the performance of Saudi banks. Also, the banking system coped well with the volatilities of the prices in the oil market; no bank was threatened in this period and no government support was required.
BIS Papers No 28
333
8.
Capital Adequacy in the Saudi Banking System
In line with international trends, in 1992 SAMA implemented the risk-weighted Basel Capital Adequacy Accord, and established a minimum risk-weighted capital standard of 8%. Also, SAMA encouraged Saudi banks to raise their capital bases, and during the period 1988-1993, 7 of 12 banks increased their capital through new share flotations. As a result, the capital base of the banking system doubled, from SAR 15 billion to SAR 30 billion. It is worth noting that the average risk-based capital of the Saudi banking system in the 1990s hovered around the 20% level, while individual bank averages were between 12-30%. It is also notable that the banks’ capital was almost entirely, composed of Tier 1 items. In this connection, SAMA has decided that Saudi banks will implement the Basel II Capital Adequacy Standard during the period 2008-2010. Banks are free to choose any Basel II approach for credit and operational risk. Work is currently underway to plan for the implementation of all three pillars of Basel II during this time frame.
9.
Supervisory Initiatives in the New Decade
In the decade starting in 2001, the trend towards further enhancement of the supervisory system has continued. SAMA has developed and implemented a range of financial policies and supervisory standards to ensure that the banking system maintains its reputation, safety and soundness. Some of the major supervisory policies introduced since 2001 include the following. •
A new anti-money laundering law.
•
New regulations for prevention of money laundering and for combating terrorist financing.
•
Implementation of a risk-based supervisory system to support on- and off-site supervision.
•
Implementation of Market Risk Amendments to the 1988 Basel Capital Accord (now part of the Basel II Capital Accord).
•
Implementation of supervisory rules for consumer loans and margin trading.
•
A host of other Basel circulars, including those on credit and operational risks.
10.
External Assessment of Financial Policies and Supervision
These financial policies and supervisory practices have gone a long way to strengthen the Saudi financial system. In addition, since 2003 SAMA’s supervisory practices and financial policies have been assessed by three independent outside expert institutions. These include: •
External rating agencies: S&P and Fitch carried out extensive work on the financial system for their sovereign rating work in 2003. SAMA scored well in their assessment of the strength of the financial sector and its supervision.
•
A Financial Sector Assessment Program (FSAP) was done by an IMF/World Bank team in 2004. The results of this FSAP were comforting, in that Saudi Arabia’s financial policies and supervisory practices stood up to this objective evaluation. The assessment against Basel Core Principles indicated that SAMA supervision was fully or mostly compliant with 21 of 25 Core Principles. Also as a part of the FSAP, a stress test was carried out under three different scenarios of interest rate, credit risk and liquidity shocks. This stress test confirmed the resilience of the banking system as no Saudi bank would fail under a 300% stress scenario for these individual shocks or even a combined shock.
•
Also in 2004, a Financial Action Task Force study was carried out to assess Saudi Arabia against the 48 recommendations issued by FATF. The results of this study were very satisfactory as Saudi Arabia fully or mostly met 47½ of the 48 FATF recommendations.
11.
The Way Forward
The sustained long-term growth and development of the Saudi banking system has been supported by a strong and comprehensive system of banking supervision. Since the 1960s, SAMA has enjoyed broad regulatory powers in licensing banks, approving their activities and taking prompt corrective action when required. SAMA has powers to promulgate rules, regulations and guidelines to banks in
334
BIS Papers No 28
all areas, including capital adequacy, liquidity, lending limits, credit and market risk, etc. Also, it has powers to conduct both on- and off-site supervision. SAMA acts as the regulator of the insurance market and has a dual role of providing central payment and settlement services and for the oversight of these systems. Over the years, SAMA has used its broad supervisory powers effectively to ensure that the Saudi banking system continues to enjoy a high reputation for soundness and stability in the international financial markets. Looking ahead, systemic stability continues to be the primary goal of Saudi authorities in general, and SAMA in particular, for the banking system.
BIS Papers No 28
335
Fostering a sound and progressive financial sector The Monetary Authority of Singapore
1.
Introduction
The Government and the Monetary Authority of Singapore set up a Financial Sector Review Group (FSRG) in 1997. MAS’ regulatory approach, centred on high admission and prudential standards as well as rigorous enforcement, had produced a strong and well capitalised banking system. But rapid technological advances and consolidation sweeping the global financial industry presented new challenges and risks. This necessitated a fundamental rethink of its approach to supervising and developing the financial sector. To help the FSRG in its work, a few private sector committees were commissioned to study specific issues like banking competitiveness, banking disclosure, corporate finance and the stock exchange, and consultants engaged to undertake financial sector and IT strategy studies. The review resulted in a new approach to supervising and developing the financial sector. There were three main thrusts.
Liberalising the financial sector First, MAS liberalised the financial sector to promote competition and enterprise. Greater participation by strong foreign financial institutions would speed up the transfer of new technology, management expertise and financial innovation to Singapore. The stockbroking industry was deregulated and protective barriers in banking and insurance were lowered. These financial reforms were undertaken through a steady series of incremental changes rather than in a “big bang”. MAS was mindful of the need to manage these reforms in an orderly manner so as to allow time for its regulators, financial institutions and investors to develop new expectations of one another, and understand the new way things worked.
Reviewing the regulatory and supervisory framework Second, MAS shifted its emphasis from “one-size-fits-all” regulation to risk-based supervision, so that it could focus more attention on issues of systemic risk, and calibrate supervisory intensity to the risk profiles of financial institutions. While maintaining the high standards of sound financial management that have become associated with Singapore, it recognised the need for a more conducive regulatory environment, including providing financial institutions the leeway to respond to the increasingly sophisticated needs of their clients. MAS strengthened disclosure and market discipline, to enable investors to better judge and take risks for themselves. It pushed for higher standards of corporate governance in the financial sector, to cultivate a stronger self-regulating corporate culture, better risk management and internal controls, and greater transparency. It also moved to greater transparency and clarity in its regulations and built a closer partnership with the industry.
Taking a more strategic and proactive approach to development Third, MAS adopted a more strategic and proactive approach to developing the financial sector. Besides being the central bank and supervising the financial sector, MAS is also responsible for development of the sector. The breadth of its coverage gives it a good vantage point from which to gather industry views on promising growth areas and help bring value-adding activities and key global financial institutions to anchor in Singapore.
BIS Papers No 28
337
The Asian crisis that was engulfing the region confirmed the importance of MAS’ long-standing fundamentals but also highlighted lessons and potential risks. Due to the strong foundation laid earlier, Singapore’s financial system was relatively unscathed. This gave MAS the flexibility to press on with reforms and even liberalise at a time when the environment was more risky. This paper highlights the key changes and initiatives in MAS’s policies and organisation for supervising and developing the financial sector following the review in 1997. Section 2 provides details on the phased liberalisation of the banking industry. Section 3 describes MAS’ risk-focused, stakeholder-reliant, disclosed-based and business-friendly supervisory approach. Section 4 sets out the deposit insurance scheme that it is putting in place to provide an appropriate level of systemic protection. The paper concludes with the organisation changes MAS has introduced to strengthen its capabilities in carrying out its core functions.
2.
Banking liberalisation
Starting in 1999, MAS allowed foreign banks meeting its eligibility criteria greater access to the domestic retail market. MAS gave enhanced access privileges only to banks that met its prudential criteria and that were able to contribute to the financial sector by introducing new services and expertise to the market. MAS phased in the liberalisation to give time to its local banks to respond to the increased competition. Four foreign banks were first given enhanced market access privileges in 1999, followed by another two in 2001. The access privileges (such as number of service locations, access to Electronic Funds Transfer at Point of Sales systems, and Automated Teller Machine networks) granted to these six banks were also progressively improved over five years. MAS also eased entry to the wholesale banking market. This significantly broadened participation by foreign banks in the domestic wholesale market and encouraged international banks of good standing to use Singapore as their Asian base. It gave sophisticated customers in Singapore better access to world-class financial products and services. Besides giving foreign banks leeway to grow organically in Singapore, MAS also allowed strategic cooperation between Singapore and foreign banks. The 40% aggregate foreign shareholding limit for local banks was lifted. In its place, MAS implemented nationality requirements for the board of directors and tightened the single shareholding approval thresholds at 5%, 12% and 20%. MAS also signalled willingness to consider proposals by foreign banks to acquire strategic stakes in the local banks if they could add value and strengthen the local banks as a result.
3.
A principle-based supervisory approach
The phased liberalisation was complemented with a review of MAS’s regulatory and supervisory framework. To clarify and guide this ongoing process, MAS issued a monograph in 2004 entitled “Objectives and Principles of Financial Supervision”, which spells out MAS’s objectives of supervision, the functions it performs and the principles that guide its supervisory approach. 1 Moving away from “one-size-fits-all” regulation, the approach strives to be risk focused, stakeholderreliant, disclosure-based and business-friendly.
1
Available on the MAS website (www.mas.gov.sg) under “Publications”.
338
BIS Papers No 28
Risk-focused Regulatory framework MAS has been systematically reviewing its regulations to address well-defined risks that can have systemic implications and to sieve out those which are no longer relevant or necessary. Institutions launching new products need not come to MAS for approval, as long as the institution as a whole keeps within MAS’s prudential supervisory framework. Limits on car loans and aggregate investments in equity have also been lifted as it was assessed that banks could manage these risks. MAS also recently reviewed its requirements on securitisation transactions and replaced the need for prior approval with a notification requirement, to enable banks to bring securitisation transactions to the market more quickly. To provide institutions with incentives to better manage their risks, MAS has put in place risk-based capital frameworks. It has also revised its minimum liquidity requirements for banks, making them forward-looking and taking into account supervisory reviews of banks’ liquidity policies and practices. 2 Banks that passed MAS’s bank-specific liquidity assessment may peg their requirement to the volatility of their cash flows. Supervision Starting in 1998, MAS adopted a top-down, risk focused approach to bank examination, moving away from the traditional, bottom-up method. Emphasis is placed on the process by which a bank’s management itself addresses its risks, instead of reviewing the books for control deficiencies. 3 MAS also put in place structured frameworks to evaluate the risk profiles of its institutions and assess the potential impact they would have on Singapore’s financial system, economy and reputation. To strengthen the integrated supervision of institutions, it harmonised industry-specific risk assessment frameworks into a single framework that applies to all classes of institutions that it supervises. This activity-based framework emphasises the evaluation of risks and the quality of governance, controls and risk management processes commensurate with the scale and complexity of an institution’s operations. 4 To better understand the risks of a more inter-connected system, MAS has put more resources into macro-prudential surveillance. Analysis of macroeconomic and financial developments and their implications for the stability of the financial system has been enhanced and there are regular meetings to bring together macro- and micro-prudential perspectives on risks and other stability issues. Since December 2004, MAS has also published a Financial Stability Review (FSR) on a semi-annual basis to communicate its views and findings on the risks and vulnerabilities facing Singapore’s financial system.
Stakeholder-reliant MAS has introduced initiatives to encourage and reinforce self-governance in financial institutions. Regulations and Guidelines on Corporate Governance As part of the banking liberalisation measures, MAS had required local banks to appoint Nominating Committees within their boards to ensure that only competent individuals who can contribute to the bank and discharge their responsibilities in the interests of all shareholders are appointed to the board and key management positions in the bank. This has been further strengthened by the issuance in September 2005 of a set of Corporate Governance Regulations (“Regulations”) and Guidelines on Corporate Governance (“Guidelines”) that are consistent with global best practices.
2
Prior to the review, banks compute and maintain a minimum amount of liquid assets based on their historical liability base as defined by MAS.
3
MAS’s FY1997/98 Annual Report has details on this on pages 67-68.
4
MAS’s FY2004/05 Annual Report has details on this on pages 26-27.
BIS Papers No 28
339
The Regulations contain requirements that MAS considers essential for sound corporate governance, in particular the presence of an independent element on each bank’s board. The Regulations specify the proportion of directors on the board and board committees who must be independent of the financial institution’s management, business relationships and substantial shareholders. The Regulations also include rules that require banks to separate their management from those of the affiliates of their substantial shareholders, and for the separation of the Chairman and CEO roles within a bank or an insurance company. MAS also strongly encourages its banks and direct insurers to adopt the best practices in the Guidelines, given the diverse and complex risks undertaken by these institutions and their responsibilities to depositors and policyholders. Separation of financial and non-financial activities In June 2000, MAS required banks in Singapore to focus on their core financial business, so as to minimise the risk of non-arm’s length transactions between banks and their non-bank affiliates, and to limit the risk of contagion. Under the policy, the local banking groups are required, over a period of six years, to separate their financial and non-financial activities, divest control of all non-financial activities, and unwind all cross-shareholdings within these groups. In addition, local banks are allowed to undertake equity portfolio and venture capital investments, and to hold properties solely for their own use or for investment purposes. Strengthening the quality of external audits The local banks have publicly disclosed all non-audit consulting fees paid to their external auditors since 1999. They are also subject to the listing requirement of the Singapore Exchange that audit partners be rotated every five years. In 2002, MAS required banks incorporated in Singapore to change their audit firms every five years. In doing so, MAS had recognised that frequent rotation of auditors could be resource-consuming and could result in audit gaps. After consultation with banks, it was decided that a five-year rotation period would balance the need to enhance audit independence and bring fresh perspectives to the audit process with the desire to provide for continuity and contain costs.
Disclosure-based Steps have been taken to put in place a regulatory framework that provides timely, accurate and meaningful disclosure of material information that consumers could reasonably rely on to evaluate the product, judge its risks, and make financial decisions. Benchmarking disclosure norms to international standards Banks in Singapore raised their disclosure standards significantly following a 1998 review by a private sector committee. The local banks began disclosing the market value of their investments, the level of their non-performing loans, past and future provisions, off-balance sheet items, and significant exposures. They have continued to improve disclosure in line with industry developments and international best practice. Local banks now publish their annual accounts within five months of the financial year-end. As with other listed companies, local banks started quarterly reporting of interim financial announcements with effect from January 2003. They also disclose pertinent information relating to the areas of corporate governance practices, financial performance review, risk exposure, risk management practices and risk taking philosophy in their annual reports, in line with international standards. In the supervision of capital markets activities, MAS is also placing increased emphasis on market discipline through a disclosure-based regime. For example, disclosure standards for prospectuses have been tightened and the continuous disclosure of material information is mandated for listed companies. MAS has also made issuers and their advisers more accountable for making relevant disclosure, and subject inadequate or misleading disclosures and material omissions to statutory penalties. Investors now have access to civil remedy against offenders, while criminal sanctions remain for serious market misconduct.
340
BIS Papers No 28
Empowering consumers to assess and assume financial risks As more financial products are introduced, consumers need to understand these products well to make informed decisions. To enhance the basic financial literacy of consumers, Singapore launched a national financial education programme called MoneySENSE in October 2003. The MoneySENSE programme adopts a three-tiered approach that focuses on basic money management at the lowest tier, then looks at financial planning at the next tier, before moving on to the last tier on investment know-how. Establishing efficient and affordable dispute resolution mechanisms MAS also facilitated the establishment of a Financial Industry Disputes Resolution Centre (FIDReC) in August 2005 to enhance the efficiency of dispute resolution mechanisms for retail consumers. FIDReC brings together existing dispute resolution schemes under the banking and insurance sectors, with extended coverage to include the capital markets sector. Mediation services, the main way of resolving disputes, are provided free by FIDReC. If mediation fails, the dispute then enters into adjudication for a fee of just S$50.
Business-friendly Formalising consultation MAS introduced guidelines in 2002 to formalise public consultation as a standard procedure whenever significant changes in its regulatory framework are planned. Besides raising levels of transparency, consultation has helped MAS tap industry expertise and experience on new products and business models, better understand the impact of new regulations on competitiveness and compliance costs, and identify the operational and implementation issues that industry may face.
4.
Safety net
MAS is introducing a deposit insurance (DI) Scheme in April 2006. The main objectives are to provide a basic level of protection for small depositors, and to reduce the moral hazard from any mistaken perception of an implicit government guarantee on deposits. 5 As its local banks expand overseas and foreign banks increase their presence in Singapore, the banking system and depositors will be exposed to more risks from these banks’ international operations. International experience has shown that the possibility of a bank failure and loss to depositors cannot be eliminated even in reputable and well supervised jurisdictions. Moreover, as most foreign banks in Singapore operate as branches, MAS’s supervision is confined to their operations in Singapore, even though the risks to their viability may arise from any part of their global operations. Cross-border insolvency proceedings will also present significant uncertainty and delay claims in Singapore against a bank’s overseas assets. Greater certainty of and clarity in depositor compensation will enhance public confidence in banks, and the financial system’s stability. In the event of a bank’s failure, the DI Scheme will compensate individual depositors and charities up to S$ 20,000 per depositor 6 per institution through a fund built up from contributions by Scheme members. The Singapore Deposit Insurance Corporation Limited (SDIC) was established in January 2006 to administer the DI Scheme and manage the deposit insurance fund. To strengthen recovery by the SDIC from the failed institution of any compensation paid out, Scheme members that operate as foreign bank branches are required to maintain sufficient eligible assets located in Singapore to meet its insured deposit liabilities.
5
Depositors’ expectation of a government bail-out would reduce their incentive to seek out sound banks and weaken market discipline on banks, potentially undermining banking system stability.
6
This amount is on a per depositor per institution basis which would apply in the case of failure of more than one bank.
BIS Papers No 28
341
5.
Strengthening the organisation
MAS is fairly unique in that it is the central bank, integrated financial supervisor and financial sector developer. Since 1998, MAS has undertaken a series of internal organisational changes to bring together departments with existing and potential synergies and to facilitate a more integrated approach to meet its core mission and objectives. MAS has grouped its banking and insurance supervision departments to focus on prudential, and its securities departments to focus on market conduct regulation and supervision, for a more holistic view in supervising financial institutions and markets. Next, the prudential and market conduct policy functions across the three industries have been clustered together in order to better harmonise regulations and policies across financial activities. A Complex Institutions Supervision Department was set up to take a more integrated approach to supervising financial groups, evaluating them on a whole-group basis. This allows MAS to develop and retain both the depth and breadth of skills and expertise necessary for assessment of individual industries and complex financial conglomerates. MAS has given more focus to financial surveillance and financial stability. A Macroeconomic Surveillance Department (MSD) within the monetary policy arm of MAS was established to better identify and monitor emerging trends and potential vulnerabilities in the financial system and markets. As mentioned earlier, MAS has institutionalised a regular meeting to discuss financial stability issues, bring together macro-and microprudential perspectives, as well as market insights from the reserve management and financial development functions. MAS has also strengthened working arrangements between the developmental and supervisory functions. However, these separate and dedicated departments within MAS for financial supervision and financial centre development report to different senior management staff. In addition, officers involved in supervision are not charged with initiating and implementing developmental initiatives. Any potential tensions or trade-offs between supervision and development are resolved at the senior management level, which has collective responsibility for MAS’s dual mandate for supervision and development. In light of organisational restructurings and changes in the structure of financial markets and its regulatory approach, MAS has fine-tuned and specified more clearly in legislation its objectives and responsibilities relating to monetary policy and financial supervisory policy. In addition, it has used 7 mechanisms such as key performance indicators, periodic External Perception Surveys, and peer assessment through the IMF and World Bank’s Financial Sector Assessment Programme to measure the performance of each group carrying out the functions under its different roles. This ongoing process of organisational review will strengthen MAS’s ability to more effectively carry out its core functions in a challenging external environment.
7
The External Perception Survey (EPS) seeks to obtain feedback from external stakeholders on MAS’s performance as a central bank, integrated financial supervisor and financial centre developer, as well as on its general attributes such as competence and responsiveness. MAS publishes a summary of the main EPS findings on its website.
342
BIS Papers No 28
Annex
Financial Sector’s Contribution to GDP 14
20,000 18,000
12 16,000
S$ millions Millions
12,000
Per cent Cent
10
14,000
8
10,000 6
8,000 6,000
4
4,000 2 2,000 0
0 1990 1991 1992 1993 1994 1995 1996 1997 1998 1999 2000 2001 2002 2003 2004 Sep 05
Value Added Financialsector Sector(lhs) (LHS) added of financial
Share of GDP (rhs) (RHS)
Total Assets of Banking System
1,400,000
30 25
1,200,000
20 1,000,000
800,000
10
600,000
5
Per Cent cent
Millions S$ millions
15
0 400,000 -5 200,000
-10
0
-15 1990 1991 1992 1993 1994 1995 1996 1997 1998 1999 2000 2001 2002 2003 2004 Sep 05
Total assets Assets(lhs) (LHS)
BIS Papers No 28
YoY Growth Rates (RHS) growth rates (rhs)
343
Some Banking Sector Financial Indicators Q3 2003
Q4 2003
Q1 2004
Q2 2004
Q3 2004
Q4 2004
Q1 2005
Q2 2005
Q3 2005
Banking Sector* Loan Concentrations (% of Total Commercial Bank Loans) Bank Loans
64.8
65.8
67.1
66.2
65.6
66.0
65.4
65.1
65.4
Non-Bank Loans
35.2
34.2
32.9
33.8
34.4
34.0
34.6
34.9
34.6
Loans through the Asian Dollar Market and Domestic Banking Units (% of Total Commercial Bank Loans) Total ADM Loans
72.3
72.8
71.9
72.3
72.7
72.6
71.5
71.7
73.1
Total DBU Loans
27.7
27.2
28.1
27.7
27.3
27.4
28.5
28.3
26.9
Sectoral Distribution of DBU Loans Manufacturing
4.7
4.6
4.1
4.1
4.2
3.9
3.9
3.9
3.9
Building & Construction
10.6
10.4
9.5
9.6
9.6
9.4
8.9
8.8
8.9
Housing
21.8
22.7
21.6
22.5
23.9
23.4
23.4
23.2
23.7
Professionals & Private Individuals
14.0
14.2
12.9
13.1
13.3
13.0
12.6
12.4
12.7
9.6
9.4
8.8
8.5
8.7
8.8
8.4
7.9
8.0
26.2
25.5
30.8
29.3
26.9
28.8
30.9
31.4
30.1
Non-Bank Financial Institutions Banks
Domestic Liquidity Indicators Liquid Assets to Total Assets
14.1
14.3
14.0
13.1
13.6
13.0
12.8
13.1
13.0
Loan/Deposit
90.4
88.3
85.9
85.7
88.2
86.9
84.3
83.4
82.1
Local Banks’ Indicators Capital Adequacy (Per Cent) Regulatory Capital to RiskWeighted Assets
15.9
16.0
16.7
15.5
16.3
16.1
15.9
14.8
15.3
Regulatory Tier I Capital to RiskWeighted Assets
11.7
12.0
11.9
12.3
11.8
11.4
11.5
10.4
10.9
Shareholders’ Funds to Total Assets
10.6
10.7
10.3
10.1
10.0
9.7
10.1
9.8
10.0
Asset Quality (Per Cent) NPLs to Non-Bank Loans
7.0
6.7
6.2
5.5
5.4
5.0
4.6
4.2
4.0
Total Provisions to NPLs
64.4
64.9
67.8
71.5
72.8
76.6
77.7
78.9
80.0
Specific Provisions to NPLs
37.0
36.2
37.1
37.6
40.0
41.3
41.9
41.9
41.2
* Data relates to all commercial banks, Singapore operations only. Sources: MAS, local banks.
344
BIS Papers No 28
Number of Financial Institutions in Singapore Type of Institution
Number of Institutions as at 24 Nov 2005
Commercial Banks
110
Local
5
Foreign
105
Foreign Full Banks
24
Wholesale Banks
34
Offshore Banks
47
Merchant Banks
49
Representative Offices of Banks
42
Finance Companies
3
Insurance Companies
150
Direct Insurers
59
Professional Reinsurers
27
Captive Insurers
59
Authorised Reinsurers
5
Insurance Brokers
62
Money Brokers
9
Holders of Financial Adviser’s License
58 1
Holders of Capital Markets Services License
173
Dealing in Securities
70
Trading in Futures Contracts
39
Leveraged Foreign Exchange Trading
13
Advising on Corporate Finance
34
Fund Management
91
Securities Financing
16
Providing Custodial Services for Securities
30
1
The licensing regime under the Securities and Futures Act allows holders of a Capital Market Services license to engage in seven regulated activities.
BIS Papers No 28
345
Maintaining financial stability: the experience of Thailand Tarisa Watanagase and Financial Institutions Policy Group Bank of Thailand
1.
Introduction
An important lesson from the crisis of late 1990s is that the task of maintaining simultaneous economic and financial stability is a critical and complex one. It requires an in-depth understanding of the nature of risk and its propagation, an early warning system, effective risk management and a decision making process that ensures coordination and accountability on the part of all stakeholders - monetary authorities regulators and private agents. The imbalances in economic and financial sectors are closely related, and the degree and nature of correlation can change significantly during abnormal market conditions, especially when speculative momentum and herd behaviour take hold, creating a vicious circle and eventually leading to a crisis. Nevertheless, imbalances and disequilibrium normally build up over time and are caused by unsustainable distortions and structural weaknesses in economic and financial structure. Such weaknesses are often manifested in current account imbalances, inflation, and massive increases in the indebtedness of the corporate and household sectors, as well as an asset price bubble. Such weaknesses then render the economy vulnerable to shocks. The effect of these shocks can be magnified by increased competition and integration of international trade and capital flows, as well as by technological advances and financial innovation. This paper aims to address key issues in maintaining financial stability in Thailand under globalisation and structural change in the economic and financial sector. Section 2 discusses financial stability in the Thai context, and assesses the current conditions as well as the changing landscape of the Thai financial sector. Section 3 then analyses the risks posed to the financial sector, while the manner in which the financial institutions and authorities have managed and addressed these risks is presented in Section 4. Section 5 outlines the challenges ahead for the Thai financial sector.
2.
Thai Financial Sector
2.1
Financial stability in the Thai context
The financial sector plays the key role in ensuring efficient allocation of resources and risks between savers and investors, and across time. Thus, among the key roles of the financial institutions and markets is facilitating the price discovery process of resources. A failure in the market can lead to resource misallocation, asset price bubbles, and a boom and bust cycle, the effect of which is transmitted to other economic sectors via the central role of the financial system. However, a well functioning financial system will contribute to the economy’s increased efficiency, enhancing long-term growth potential through efficient choices of technology, capital formation and risk management. In the case of Thailand, as a small open economy, the challenge of ensuring a dynamic and competitive real sector, especially with the growing competition, is a critical one. The external sector plays a key role in our economic development, as international trade/GDP is currently 126 per cent, while the degree of openness of the capital account is also significant. Macroeconomic policy aims at sustainable growth, by ensuring internal and external stability. On the internal front, a key measure is inflation and its expectation. After the crisis, the framework of forwardlooking inflation targeting was adopted in 2000, whereby the Bank of Thailand would ensure that core inflation would stay within a range of 0-3.5 per cent. This process has proven to be valuable in reinforcing credibility and transparency of monetary policy. Core inflation has remained well within the target, which has aided in the recovery process. On the external front, the current account has remained in surplus during the period of economic stabilisation and has only edged into small deficit during the recent oil price hike. Fiscal policy played an important role in propelling recovery while
BIS Papers No 28
347
private sector demand was subdued by balance sheet constraints and risk aversion. But now, with the recovery of private demand, fiscal policy has shifted back to a balanced budget, while rather buoyant tax receipts with economic recovery have resulted in a cash surplus for the government, which should help ensure a sustainable investment-savings gap or current account position. Vulnerability has also been reduced with the careful monitoring of public debt, which is currently below 50 per cent of GDP. External debt has declined to 31.1 per cent of GDP, 68.3 per cent of total external debt is long-term, and international reserves have risen to around 50 billion USD, which provides more than three times the necessary coverage for short-term external liabilities. The exchange rate regime has changed to a managed float since the late 1990s, thus removing the distortion and moral hazard from an inflexible exchange rate. The exchange rate has resumed a stable path, with monetary policy now shifting to inflation targeting, which in turn enhances the independence of monetary policy. On the financial sector front, the Thai financial system is still bank-based, with Thai banks forming the dominant part. Prior to the crisis, there were also many finance companies which were similar to banks but had structural weaknesses mainly arising from restrictions on their activities. Such restrictions were partly the cause of their high risk and less flexibility to manage their portfolios, causing many to fail during the crisis. These structural weaknesses are tackled in the current Financial Sector Master Plan (FSMP) adopted early last year. The master plan seeks to ensure a financial landscape which is sound and free from such structural weakness, while providing a transition path to strengthen financial institutions, via merger and upgrading or orderly exit. A root cause of the banking crisis was also poor corporate governance and risk management at the corporate level as well as in financial institutions. Lending practices in some institutions did not involve proper credit assessment and were dubious regarding lending or collateral-based lending. Collateralbased lending was also highly risky given the asset price bubble leading up to the crisis, particularly in property markets. At the same time, the corporate sector was involved in many inefficient investments, while its debt also rose significantly with greater access to funding. This was partly from financial liberalisation which led to greater shorter-term capital flows, propelled by the fixed exchange rate system and borrowing through the international banking facility set up in early 1990s. The crisis took a significant toll on the corporate sector and the banking system, exacerbated by the vicious circle between market risk, from the currency crisis and interest rate hikes, and credit default. This was an important lesson which led to a concerted effort on the part of banks, regulators and the corporate sector to improve corporate governance and risk management. The roles of the board of directors and various subcommittees, such as risk management and audit committees, have been strengthened. For banks, improvements in risk management have been noteworthy. To date, substantial improvements have been made, including the introduction of risk management tools for banks and clients, the adoption of Basel market risk guidelines and capital allocation for market risk, and the planned adoption of Basel II by 2008. Moreover, the financial infrastructure will be strengthened by fortifying the capital market, foreign exchange market and money market; and legal reforms, including a move to introduce deposit insurance, which will pave the way for the removal of a blanket deposit guarantee, a legacy of the crisis. The Bank of Thailand occupies a central position in overseeing systemic risk due to its dual responsibility as banking regulator and monetary authority. The Bank’s core strategy therefore seeks to manage both macroeconomic and prudential risk by creating an early warning system and in-depth analysis of risk, together with prompt corrective action. Regulatory authorities are now working to achieve compliance with international standards and codes, with a plan to undergo the comprehensive Financial Sector Assessment Program (FSAP) in 2007. Policy formulation and the decision making process at the Bank of Thailand have also been reformed. The reengineering process has led to an organisational structure which aims for effective decision making, transparency and accountability, while ensuring coordination with other relevant agencies. The monetary policy making process and financial sector supervision are now being conducted by a structure which has a well defined mandate and accountability, under the Monetary Policy Committee (MPC) and Financial Institutions Policy Board (FIPB), both of which include outside members. The Governor and Deputy Governors of the Bank of Thailand sit on both boards in order to ensure effective information sharing and promote synergy in decision making, while experts from the industry and academia are invited to join the boards in order to promote transparency and keep checks and balances in place, in addition to providing intellectual input.
348
BIS Papers No 28
2.2
Macroeconomic recovery
A closer examination of the economic data shows that the Thai economy has recovered from the financial crisis with positive GDP growth, stable price levels and a favourable current account position (Figure 1). The economic recovery is further strengthened by the more robust financial sector, largely as a result of successful debt restructuring and reforms. The Thai economy and financial sector are sufficiently strong to be able to adjust flexibly to adverse shocks such as oil price shocks, natural disasters and turning points in the global economic cycle and in interest rates. Figure 1
GDP Growth, Inflation Rates and Current Account Balances 15.0 10.0 5.0 0.0 1997
1998
1999
2000
2001
2002
2003
2004
2005
-5.0 -10.0 -15.0
2.3
GDP (% change)
Headline Inflation (% change)
Core Inflation (% change)
Current Account (% of GDP)
Strengthening the financial sector
The financial sector continues to strengthen, with increasing stability and efficiency, as evidenced, for example, by declining NPL, rising profitability and ample provisioning, as well as the arrival of new financial products. Regarding stability in the system, the NPL/total loan ratio has declined from 43 per cent in 1998 to 10.5 per cent in June 2005. The majority of the remaining NPLs are currently in the court process. Furthermore, the entire banking sector maintains excess loan loss provisioning, while indicators on banking efficiency also show continual improvements (Figures 2 and 3). Efficiency in the financial sector is enhanced by the introduction of new sophisticated financial products and ongoing structural reform under the FSMP, 1 a medium-term policy framework formulated by Bank of Thailand in order to promote an efficient and stable financial sector that is responsive to consumers’ needs.
1
The FSMP will be discussed in detail in Section 4.
BIS Papers No 28
349
Figure 2
Figure 3
350
BIS Papers No 28
The current improved performance and soundness of the banking sector and prudent risk management practices mean that commercial banks are better able to identify risks and are in a position to adjust their portfolios accordingly. Increasing profitability and strong financial conditions, as evidenced by the high capital to risk-weighted assets ratio, which is above the minimum threshold set by the Bank of Thailand, provide Thai banks with a greater financial cushion to limit and absorb potential losses. However, in light of the fast-changing financial environment, and increasing integration among markets both globally and domestically, there are factors that may challenge the risk management ability of the Thai financial system; for example, the close relationship between the economic business cycle and credit risks, the proliferation of new service suppliers (mainly non-deposit-taking credit companies, which are not under prudential supervision by the Bank of Thailand), and the introduction of new and more sophisticated financial products.
3.
Macroprudential Analysis and Financial Sector Review
Since the maintenance of financial stability necessitates an understanding of the linkages between macroeconomic and financial risks, the Bank of Thailand carries out in-depth research and analysis of key variables determining instability. Moreover, the Bank also closely monitors developments in important macroprudential variables which can give early warning signals of risks to stability. In monitoring these key indicators, the Bank of Thailand also places importance on dialogue with market players at home and abroad. Such dialogue provides an important flow of information and feedback. Moreover, when there are important changes such as an oil price hike or a change in the interest rate cycles, the Bank also carries out quantitative analysis of the risk and impact whose publication helps to strengthen the risk management of individual institutions as they can get better information on the aggregate picture. The effectiveness of the financial stability process is enhanced when all agents are well informed of the risk. Thus, transparent information and communication by the Bank is also viewed as key. In such recent exercises, factors identified as potential risks that could trigger adverse effects in the Thai economy and financial sector were increases in oil prices and interest rates. Assessment, however, also shows adequate financial resilience in the corporate and household sectors to withstand the downside risks. In the medium term, there are risks from structural shifts in the financial and economic system, such as the changing monetary transmission mechanism or a shift in behavioural relationships such as propensity to save, which need to be carefully studied. Nevertheless, the Bank of Thailand has taken measures to safeguard stability, including monetary tightening and stringent prudential measures on credit card and consumer loans. 3.1
Risk from oil shocks and interest rate hikes
3.1.1
Risk assessment for the corporate sector
Rising oil prices and interest rate trends would have a direct effect on the corporate sector through increases in production and borrowing costs. While these factors and corresponding economic uncertainty raise production costs and soften aggregate demand, the Bank of Thailand expects the impact of these factors to be moderate given the strong financial conditions in the corporate sector. From simulations using the Corporate Sector Model linked to the Bank of Thailand’s Macroeconomic Model 2 to test the corporate sector’s ability to withstand the rising interest rate trend, it is shown that a rise in the policy interest rate could dampen the interest coverage ratio, 3 though it would still remain at a high level, while the debt-to-equity ratio would decline (Figure 4).
2
See the Bank of Thailand’s Inflation Report October 2005 (Bank of Thailand, 2005).
3
Interest coverage ratio = Profit (loss) before interest and income tax expenses (billion baht) Interest expenses (billion baht)
BIS Papers No 28
351
Figure 4
3.1.2
Risk assessment for the household sector
Analysis of the household sector also reveals conditions that moderate possible adverse effects from interest rate increases. First, despite the average of 16 per cent per annum growth of household debt from 2002 to 2004, the ratio of household debt to GDP still stands at a manageable 30 per cent. Moreover, the effect from consumer loans including credit card lending may not significantly impact the stability of the financial sector as they account for a small portion of the financial sector. The latest figures show that in the second quarter of 2005 consumer loans accounted for 16.5 per cent, with credit card lending standing at 1.9 per cent, of total loans. The situation therefore does not pose a threat to the stability of the financial system, especially with the corresponding NPLs standing at 9 and 3.2 per cent, respectively. Second, based on the forecast from the Bank of Thailand’s Household Sector Model, 4 using different scenarios of interest rate hikes, the rise in the cost of borrowing following the rate hikes would induce households to adjust their financial behaviour and slow down their borrowing. This would consequently help reduce households’ financial vulnerability (Figure 5). Nevertheless, the Bank of Thailand realises that while the level of household debt is still manageable, the debtservicing ability of the household sector amidst rising interest rates warrants close monitoring.
4
See the Bank of Thailand’s Inflation Report October 2005 (Bank of Thailand, 2005).
352
BIS Papers No 28
Figure 5
While the analysis in 3.1.1 and 3.1.2 regarding domestic conditions does not present any immediate concern for the stability of the Thai financial sector, it is crucial to stay vigilant of market conditions. The global environment has been witnessing a period of very low long-term global interest rates. This could potentially change. Therefore, the credit and market risk environment faces uncertainty for which an emerging economy such as Thailand, and financial institutions, must be prepared. Accordingly, both the industry and regulators need to be sufficiently agile in conducting and overseeing risk management in the financial sector. Under a forward-looking risk-based supervisory framework, financial institutions are encouraged to be proactive in assessing and managing their own risks, relying largely on their own analysis, auditing skills and risk management tools, while authorities are responsible for overseeing systematic risks and maintaining the stability of the whole financial sector and the economy. In this regard, the authorities have implemented measures to improve the risk management capability of the financial sector as well as initiating reform and structural change in order to address the weaknesses in the system.
3.2
Medium-term risk from structural shift
3.2.1
Transmission mechanism of monetary policy
Until recently, the pass-through from policy and money market rates to commercial bank retail rates was sluggish in Thailand. Although the policy rate started to move upward in August 2004, retail rates only began to adjust in May 2005 (Figure 6). This slow pass-through is a consequence of excess liquidity in the banking system. However, there are indications that the interest rate channel is beginning to improve. With deposit rates staying low in nominal terms and negative in real terms for a prolonged period of time, households and firms have moved away from bank deposits towards alternative saving instruments with higher rates of return. At the same time, the demand for loans continues to grow and is likely to accelerate from both the private and the public sector. The acceleration in private demand for loans is supported by a high and rising rate of capacity utilisation, which implies an increasing need for investment to expand production capacity. As for the public sector, large-scale investment projects are being planned for the next few years. Given these developments, banks are anticipating a relatively fast reduction of excess liquidity going forward.
BIS Papers No 28
353
Figure 6
Over the longer term, as the capital market, particularly the bond market, gains a bigger role in financial intermediation and the economy becomes less dependent on the banking sector, the chance of monetary transmission being stalled by the breakdown of the banking system’s intermediation process should diminish. At the same time, transmission through other channels such as expectations and asset prices may become more important, rendering the overall transmission process more balanced and perhaps more potent. Figure 7
354
BIS Papers No 28
Since a developed and efficient bond market would enhance the effectiveness of the conduct of monetary policy in addition to promoting stability and efficiency in the financial system, in January 2005, a high-level Domestic Bond Market Development Steering Committee was set up by the government with the aim to promote the development of the domestic bond market. In relation to this, the Bank of Thailand is responsible for developing an active secondary market. 3.2.2
Declining domestic savings
The gross savings-to-GDP ratio has been gradually declining since 1991, particularly in the private sector (Figure 8). Possible medium-term adverse impact from declining domestic savings, as the result of the consumption boom post-crisis, includes a potential increase in current account deficit and higher pressure on financing for future retirement. Once private investment gains momentum and the government mega-projects 5 are launched, the pressure on the current account may increase, potentially leading to higher vulnerabilities in the foreign exchange rate. Figure 8
Although the manner in which the projects are financed could have an adverse impact on Thailand’s current account, mega-projects also offer favourable investment opportunities for domestic financial institutions and the capital market. In all, given prudent financing and project implementation plans, mega-projects provide both economic stimuli and social welfare benefits. Current demographic trends in Thailand show that there will be an increase in the number of people of working and family age. This represents the expansion of potential borrowers as well as savers. Consequently, the challenge for financial institutions will be to tailor and market competitively priced financial products that respond to the needs of this segment of the population. Although such decline in savings does not pose any immediate and serious concern for the stability of Thai financial sector or the economy as a whole, in order to support the rise in domestic investment, curb the possible rise in the current account deficit and ensure sufficient funding for future retirement given the current demographic trend, domestic savings will need to increase and play a greater role in assisting the development of the economy (Figure 9).
5
The government’s mega-project initiative concerns 1.7 trillion baht in new infrastructure spending over 2005-09. Such initiatives have been on the decline since 1997 given the government’s preoccupation with economic stabilisation.
BIS Papers No 28
355
Figure 9
Furthermore, in relation to the socioeconomic concern over the prevalence of low-income households, the current limited opportunities for low-income groups in accessing and utilising financial services for saving and borrowing purposes may limit Thailand’s long-term development. Equal opportunity is important not only for better resource allocation but for social equity as well. Therefore, it is crucial to increase the coverage of financial institutions and services in rural areas and promote financial literacy, as well as raising income levels, especially among low-income households in order to encourage saving and more informed borrowing and lending decisions Correspondingly, Thai authorities have implemented the FSMP whose aims are to improve access to financial services and the consolidation of the banking sector, among others. Earnest efforts in strengthening financial infrastructure and promoting financial literacy among consumers should continue to be priorities for Thai policymakers in order to ensure sustainable development of Thai financial sector.
3.3
Implications for the financial sector
Adverse macroeconomic developments such as oil price and interest rate hikes, apart from the direct impact of reducing demand, may put further pressure on the debt service and loan repayment abilities of corporate and household sectors in the longer term. The financial strength and risk management capability of the financial sector are therefore important in ensuring that the sector will be able to withstand potential difficulties. However, this is helped by the fact that credit risks related to asset quality of the whole banking system, in particular concentration risk, have declined following enhanced credit diversification into different economic sectors in addition to the low, and still declining, expected probability of default of bank customers (Figure 10). Having begun to move away from collateral-based lending to a risked-based approach, commercial banks have improved credit analysis and risk management. There is increasing use of credit scoring and credit rating, application of value-at-risk, sensitivity and gap analyses, and fair accounting value
356
BIS Papers No 28
that facilitate enhanced risk awareness and comprehensive management oversight. 6 All banks have internal rating systems, and loan applications go through a risk assessment model. Commercial banks are also in the process of developing a stress testing model. In support of this move, the Bank of Thailand has established the scenario for banks to perform stress tests and is currently waiting for the first round of results. Figure 10
With regard to market risk, the impact analysis on the rise in interest rates is estimated to be around 0.1 percentage point of the capital ratio of Thai commercial banks. This, given the potential uncertainty of persistent increases in oil prices and interest rates in the global market, warrants further close monitoring. Moreover, financial institutions have benefited from information facilitated by the Bank of Thailand as well as from the market. The interest rate increases are necessary to maintain macroeconomic stability and send signals to the market, inducing market-oriented adjustment and triggering management of the changing risk environment. The market structure has also become more complete, allowing better pricing and trading of risk as evidenced, for example, by a more developed bond market with an almost complete yield curve, as compared to the situation before the crisis.
4.
Maintaining Financial Stability
4.1
Risk-based supervision
As already mentioned, Thailand’s supervisory system is moving towards risk-based supervision. In keeping with this new supervisory approach, Thailand still faces a number of key challenges, which include the following.
6
The most successful risk assessment tool used in the commercial banks thus far is credit scoring.
BIS Papers No 28
357
Availability and timeliness of data One of the key policy lessons learnt from the financial crisis is the importance of the accuracy, availability and timeliness of data in the financial sector. The difficulties faced by financial institutions in building the capacity for better risk management (for example, formulation of stress testing models, value-at-risk and credit rating systems) as well as adopting international standards and best practices are the lack of sufficient data following the period of high NPL. Such limitations need to be addressed in a timely manner. This is especially important for the development of risk management models. The Bank of Thailand continues to work with financial institutions in addressing these limitations, for example by improving credit bureaus and providing training programmes for staff. Timely information underpins the ability of commercial banks to make appropriate and prompt decisions. Third-party information on borrowers’ credit history is particularly important in this regard. The centralisation of credit bureaus, from two to only one credit bureau, also helps to create a more complete database. However, the use of information up until now has been limited by the rigidity of the Credit Bureau Act. For example, currently financial institutions can use credit information only for originating credit, but not for renewing credit. To overcome the legal obstacles, the Credit Bureau Act is currently under review by the senate. Another third-party source of credit information is available from the domestic credit rating agency in Thailand, the Thailand Rating and Information Service (TRIS). TRIS’s role thus far has been quite limited and less visible compared with that of international credit rating agencies. However, it is recognised that the domestic rating system needs to be further developed, particularly with the Basel II implementation and the development of the bond market. Human resources A commonly shared problem among emerging economies is the inadequate number of qualified staff both in the public and private sectors. Public sector officials need to have a broader and deeper understanding of macroeconomics, finance and accounting, as well as quantitative analysis, while personnel in financial institutions need to be more analytical, both quantitatively and qualitatively, in monitoring, assessing and managing risks. In the meantime, much progress has been made to safeguard financial stability. Market risk The Bank of Thailand introduced a market risk supervision policy in line with the Basel standard in December 2003, giving commercial banks a one and a half year adjustment period. Starting from June 2005, commercial banks have maintained capital against the market-specific and general risks according to 1996 Basel market risk guidelines. This policy ensures that movements in interest rates, in addition to foreign exchange and equity, are taken into account in commercial banks’ trading books when assessing their net positions in line with conservative accounting. Corporate governance Good corporate governance, not only in the financial sector, has been a key policy focus since the financial crisis. Moreover, in the context of risk-based supervision, corporate governance entails a high level of accountability by boards of directors for the performance and operations of the financial institutions under their oversight. In this light, the Bank of Thailand has issued a handbook for the directors of financial institutions and has requested commercial banks to create subcommittees, including auditing and risk management subcommittees, as well as imposing stricter rules and regulations on related lending in financial institutions. Furthermore, the Bank of Thailand requires commercial banks to disclose their related transaction activities, such as special payment to directors or senior management in the form of cash or in kind. Such requirements are also in line with those set by Thai Accounting Standards (TAS). New Basel Capital Accord The Bank of Thailand and the financial sector have been working closely to prepare for the adoption of Basel II, which is set for 2008. Commercial banks are required to assess the impact of Basel II on their capital adequacy, and to demonstrate the readiness of their new databases, IT systems, risk management processes and human resources. Financial institutions are free to choose alternative
358
BIS Papers No 28
approaches that suit them best. The standardised approach and foundation internal ratings-based (FIRB) approach will be implemented at the end of 2008, while the more sophisticated advanced internal ratings-based (AIRB) will be implemented a year later. In implementing Basel II, both supervisors and financial institutions face the key challenge of building capability for handling the more quantitatively oriented risk management systems under Basel II’s more advanced approaches to favour retail lending. Consolidated supervision In recognition of the presence of financial conglomerates, whose risk profiles and complex organisational structures call for a more inclusive supervisory mechanism than solo supervision, the Bank of Thailand has initiated consolidated supervision. In support of this, the existing law is being revised, empowering the Bank of Thailand to act as a lead supervisor of financial conglomerates. In the meantime, the Bank of Thailand has issued a consultative paper on consolidated supervision for comments from the banking community, before enforcement. Moreover, in order to ensure effective supervision, closer communication and cooperation among supervisory agencies, the Bank of Thailand has also formalised information exchange with Department of Insurance and the Office of the Securities and Exchange Commission. Legal reform Importantly, in order to carry out effective risk-based and consolidated supervision as well as implementation of Basel II, the role and responsibility of the Bank of Thailand need to be clearly defined with adequate legal authority. The current Commercial Banking Act of 1962, however, does not adequately address these points. Therefore, authorities are now working on a new Financial Institution Business Act that will specify the duties and authorities of the Bank of Thailand and is expected to reach the parliament for approval in 2006. In addressing moral hazard and promoting risk management in the financial sector, the Deposit Insurance Act, which allows for a one million baht per person per bank guarantee limit, has been drafted. This guarantee is expected to cover 98 per cent of depositors. The draft Act has been approved by the cabinet, and is currently waiting approval of the parliament.
4.2
Structural changes
Financial Sector Master Plan In order to further address structural weaknesses and develop a stable and efficient financial sector that is also accommodative to Thailand’s dual economy, the Bank of Thailand developed the Financial Sector Master Plan (FSMP) as the medium-term (5-10 years) development plan for the Thai financial sector. The plan was drafted with emphasis on meeting the needs of all financial service users, given that there is a need to promote greater access to financial services to cover low-income households and SMEs and expand the range of financial products for the corporate sector. The key measures to increase efficiency in the financial sector, by reducing the number of small players and eliminating regulatory arbitrage, are the licensing rationalisation scheme and the “one presence” policy. Licensing rationalisation created a new deposit-taking regime occupied by only four types of financial institutions, namely commercial banks, retail banks, foreign bank branches and subsidiaries of foreign banks. Licenses for International Banking Facilities (IBFs) have been discontinued to eliminate tax distortion. Qualified finance companies, credit fonciers, and stand-alone IBFs are allowed to be upgraded to either commercial or retail banks. With the new licensing scheme, authorities have removed the overlapping scopes of business that posed regulatory arbitrage problems. Commercial banks will be able to better take advantage of the economy of scope and scale, leaving retail banks as niche players in the retail and SME markets, while the expansion of foreign banks’ role will contribute to greater competition in the financial sector. The “one presence” policy requires financial conglomerates with more than one type of deposit-taking financial institution within their group to merge their holdings and maintain only one type of deposittaking institution. This measure corresponds well with the new licensing scheme in that it reduces the
BIS Papers No 28
359
number of licenses and increases the scope of commercial banks, thereby reducing regulatory arbitrage in the system. The FSMP began to be implemented at the beginning of 2004. Following the merging and upgrading of the finance companies and credit fonciers to commercial or retail bank status, discontinuation of IBFs and consolidation under the “one presence” policy, the number of financial institutions under the supervision of the Bank of Thailand is expected to decline from 83 to about 37 (Figure 11). Figure 11
5.
Challenges Ahead
The key long-term challenges are how to ensure that the economic and financial system can adjust flexibly to the key drivers of change (namely increased globalisation and technological innovation in both goods and the financial market), and to underlying changes in economic and financial structure such as demographic changes. Recent years have witnessed growing global competition and integration of goods and financial markets, especially from dynamic emerging markets such as China and India, as well as rapid and volatile capital flows. Thailand’s long-term growth and stability depends on upgrading competitiveness along with ensuring an agile and innovative private sector. The financial system, both the financial institutions which are still the key intermediary in Thai system as well as the rapidly growing capital market, play an important role in this process of resource allocation and risk management. Failure to make efficient investments and manage risk properly could have consequences for growth potential, with long-term impact on stability, as was the case in the last crisis. The impact of globalisation and competition will also increase due to numerous multilateral, regional and bilateral trade and investment agreements such as those of the WTO, APEC and the various free trade agreements (FTA). Thus, regulators also face the challenge of balancing costs and benefits of increasing market access to foreign competition. While increased competition enhances efficiency, the
360
BIS Papers No 28
precondition and sequencing must be appropriate in light of the risk of instability and the remaining weakness in domestic system. The reforms in the private and public sectors after the crisis have also done much to enhance risk awareness, including increasing demand for transparency, information dissemination and strengthened corporate governance. Such trends are observed in both the public and private sectors. As the Bank of Thailand moves to risk-based supervision, therefore, in parallel, greater emphasis and expectation must be placed on the internal risk management of financial institutions. Consistent with this, the Bank of Thailand has placed greater importance on involving financial institutions in the process of setting risk-based principles. Thus, the policy consultative process has been well institutionalised for most key policies, such as those on provisioning, new derivative products and market risk guidelines. The benefit of this is to ensure understanding of the principles and to allow close regular dialogue between regulators and financial institutions. This is truly helping to move regulation from a focus on black-letter law to a focus on the process of risk, which is critical in the face of the complexity of financial innovation. The consultative process and close cooperation have also been key in preparation for Basel II as the Bank of Thailand and financial institutions come together to review and draft comments on various consultative papers as well as in the process of finalising the Quantitative Impact Study. Managing the challenges ahead requires efficient risk monitoring and management, as well as redressing of structural weaknesses, including new architecture such as the FSMP and fortifying and modernising key infrastructure such as market and legal systems, and strengthening knowledge and technology in the financial system.
Bibliography Bank of Thailand (2004), “The Content of Financial Sector Master Plan”, http://www.bot.or.th/ bothomepage/BankAtWork/FinInstitute/FISystemDevPlan/ENGVer/pdffile/eng.pdf. Bank of Thailand (2004), “Supervision Report 2004”, also available at http://www.bot.or.th/ bothomepage/BankAtWork/Financial_Supervision/supervisionreport/SupervisionReport2004.pdf. Bank of Thailand (2005), “Inflation Report July 2005”, also available at http://www.bot.or.th/ BOTHomepage/BankAtWork/Monetary&FXPolicies/Monet_policy/report/7-28-2005-Th-i/full_e.pdf. Bank of Thailand (2005), “Inflation Report October 2005”, also available at http://www.bot.or.th/ BOTHomepage/BankAtWork/Monetary&FXPolicies/Monet_policy/report/10-28-2005/full_e.pdf.
BIS Papers No 28
361
Credit growth in Turkey: drivers and challenges Erdem Başçı 1
1.
Introduction
After witnessing the most severe crisis of its recent history in 2001, the Turkish economy has rapidly recovered and is now among the fastest growing economies in the world. During the recovery period, inflation rate has declined sharply to single-digit levels for the first time in three decades. This positive trend is a consequence of tight monetary and fiscal policies together with a comprehensive agenda of institutional reforms. During the last five years, the Turkish financial system has exhibited significant structural changes, fundamentally altering the nature of the risks that the system encounters (CBRT, 2005). Yet, credit risk remains at the top of the list, and its implications on both the macro economy and the financial system’s stability need to be closely monitored. This paper aims to discuss the main drivers of the recent credit boom in Turkey and the potential problems and challenges associated with it.
2.
Fiscal Consolidation and Credit Supply
The basic problem in Turkey during the last fifteen years has been the relatively large stock of public debt compared with the small deposit base in the banking system. The financial crisis of February 2001 added 30 percentage points to the already high public debt to GDP ratio (Figure 1). The following two years witnessed a collapse in credit, despite a temporary rise in deposits, which was mainly due to high levels of deposit-dollarization and the sharp depreciation of the Turkish lira in 2001. The credit to GDP ratio, however, has recovered strongly, by a total of 8 percentage points, after 2003. The most important driver of this rapid credit growth observed during the last two and a half years has been fiscal consolidation. During this period, the debt to GDP ratio fell by around 12 percentage points, while the deposit to GDP ratio stayed roughly the same. Therefore, the banks have replaced government securities with predominantly private credit on their balance sheets. Between the end of 2002 and mid-2005, total credit extended by Turkish banks tripled in US dollar terms (Table 1). More than 90% of the total credit is extended to the private sector, while the rest is used by state economic enterprises and other public institutions. The rapid growth in private sector credit growth is also confirmed in real terms. During the end-2002-June 2005 period, annual average real credit growth was 19.1%. As of June 2005, the year on year increase of the balance is 27.4% in real terms.
1
Deputy Governor, Central Bank of the Republic of Turkey (CBRT),
[email protected].
BIS Papers No 28
363
Figure 1 Credit, Deposits and Net Public Debt As a percentage of GDP
Sources: CBRT and Treasury.
Table 1 Main Developments in Bank Lending 2002
2003
2004
June 2005
Total Credit (Billions of US Dollars, Net)
30
47
74
91
Private Sector Credit (Billions of US Dollars, Net)
28
44
69
86
Private Sector Credit to Total Credit (%)
94.7
92.8
93.1
94.7
Private Sector Credit to GDP Ratio (%)
16.7
17.1
21.5
25.2
Real Annual Private Credit Growth (CPI 94=100)
–0.5
11.9
37.7
27.4
Source: CBRT.
The ratio of credit extended to the private sector to GDP shows an increasing trend after the end of 2003. The ratio is still low compared to those of the other central and eastern European (CEE) countries (Table 2). As a result of decreasing public sector borrowing requirements and falling interest rates, the loans to GDP ratio is expected to recover further in the coming years.
364
BIS Papers No 28
Table 2 Private Sector Credit to GDP in Eastern Europe 2000
2001
2002
2003
2004
Ukraine
11.1
12.9
17.5
24.3
24.9
Latvia
17.2
21.3
26.5
34.6
45.4
Albania
4.6
5.9
7.3
8.4
9.9
Bulgaria
12.6
14.9
19.6
27.4
36.7
Lithuania
11.4
11.4
14.0
20.4
25.6
Russia
13.3
16.5
17.7
21.0
24.5
Belarus
8.8
8.2
8.9
11.9
13.9
Estonia
23.9
25.2
26.9
33.1
43.3
Moldova
12.6
14.7
17.1
20.5
21.3
Hungary
32.4
33.7
35.8
43.0
46.0
Croatia
37.2
42.2
50.7
54.2
57.5
Romania
7.2
7.7
8.3
9.5
10.0
Slovenia
36.4
38.4
38.9
41.5
46.3
Bosnia
43.3
30.1
36.3
41.4
45.2
Macedonia
17.8
17.6
17.7
19.5
23.6
Poland
27.3
27.9
28.4
29.0
27.7
The Czech Republic
47.9
39.6
29.8
30.7
32.2
The Slovak Republic
51.3
37.6
39.6
31.6
30.6
Turkey
24.4
20.1
16.7
17.1
21.5
Sample Average
23.2
22.4
24.1
27.3
30.8
Sources: Otker_Robe et al. (2005) and CBRT.
Likewise, many developing countries around the world have been experiencing a rapid expansion of bank credit to the private sector in recent years. In fact, Turkey is considered a “late riser”. There are several reasons for the credit growth in these countries. Macroeconomic stabilization, robust growth, a strong economic outlook, regained confidence, bank restructuring, external borrowing and increased foreign participation are some of the reasons typically cited. In Turkey, deposits still constitute the main source of funding (Table 3). Despite the decline of their share, deposits are still an important source of funding. As of June 2005, the share of deposits declined to 60.7 percent from 64.9 percent in 2002. The significant increase in syndication and securitization credits plays an important role in this development. The pace of increase in deposits is slower compared to that of gross loans. As of June 2005, the gross loans to deposit ratio increased from 43.1 percent to 62.9 percent since 2002. The rise in the loans to deposit ratio is a positive indication that banks have been regaining their main intermediation function after many years of the public sector crowding-out private lending.
BIS Papers No 28
365
Table 3 Source of Funds 2002
2003
2004
84
111
142
153
Deposits/Liabilities (%)
64.9
62.2
62.3
60.7
Gross Loans/Total Deposits Ratio (%)
43.1
48.2
55.3
62.9
Securitization Credits (Billions of US Dollars)
2
3
4
7
Syndication Credits (Billions of US Dollars)
2
3
6
6
Deposits (Billions of US Dollars)
June 05
Source: CBRT.
State owned banks State banks were founded for development and supportive purposes, especially for agriculture and small and medium-sized enterprises (SMEs). However, over time they started to create major distortions in the sector because of their large size and political interference in their operations. State banks incurred losses from their “duty” of lending at below-market interest rates. These losses accumulated and reached 30 percent of state banks’ total assets in 1999, increasing the liquidity needs of these banks. They began to meet their liquidity requirements through short-term financing, offering high deposit rates compared to private banks by distorting the market. This syndrome culminated and exploded in the 2001 crisis. Today, the situation for state banks has changed. After the crisis, through a bank restructuring process, the Treasury issued “non-cash” government securities to clear its liabilities with the banks. The losses due to subsidized loans now have to be shown and financed through the government budget that is approved by the Parliament. Otherwise, they must operate under fully commercial principles. Moreover, the government aims to privatize all state owned banks. The privatization effort is expected to result in financial consolidation and/or foreign bank participation.
Reduced taxes on financial intermediation The extensive use of transaction taxes in Turkey was a major obstacle to the development of a more diversified financial system. Taxes on financial intermediation, the Banking Insurance and Transaction Tax (BITT), the Resource Utilization Support Fund (RUSF), and stamp duties used to increase spreads significantly. The government’s weak fiscal position had made it difficult to abolish these taxes, which discouraged bank-financed investments and encouraged offshore operations. However, taxes on financial intermediation, which were a significant restriction on extending credit, were either abolished or decreased. For instance, the taxes levied on loans, like banking and insurance transaction tax and stamp duties and fees, are no longer applied for export credits. While the RUSF rate for consumer loans is 15 percent, the rate for corporate loans has recently been reduced to zero.
Consolidation and scale effects The information gathered from the experiences of other countries emphasizes that there is a significant financial consolidation process taking place in developed and developing countries and a tendency towards universal banking and oligopolistic structures. Moreover, there is still not a consensus on the effects of financial consolidation. It is mostly accepted that financial consolidation has positive effects on effectiveness, efficiency and financial stability, and adverse effects on competition.
366
BIS Papers No 28
Table 4 Financial Consolidation
Concentration1 Number of Banks 1
1999
2000
2001
2002
2003
2004
June 05
46.3
47.8
54.4
58.4
60.3
59.5
60.8
81
79
61
54
50
48
48
Bank concentration is defined as the five largest banks’ share of the banking sector’s assets.
Source: CBRT.
The Turkish banking sector has experienced a significant financial consolidation process since the crisis. As seen in Table 4, the number of banks in the Turkish banking system has declined since the implementation of the new bank restructuring program after the 2000-01 crisis. In 1999, the number of banks was 81, and in 2004 it dropped to 48. As of June 2005, the number of banks is still 48. The concentration ratio confirms the continuation of the financial consolidation process. As seen in Table 4, the concentration ratio increased to 60.8 percent in June 2005, from 46.3 in 1999.
Foreign participation With the successful implementation of the economic program, increased confidence, political stability and EU accession prospects, foreign bank participation in the Turkish banking system has become a reality after many years. Table 5 Foreign Bank Participation
Share of Foreign Banks in the Sector (%)
2002
2003
2004
July 2005
3.6
3.2
3.9
13.6
Source: CBRT.
Foreign bank participation doubled during the credit boom period. The aggressive credit policies of new arrival foreign banks also positively affected credit growth. As seen in Table 5, the share of foreign banks in the Turkish banking system increased to 13.6 percent in July 2005, from 3.9 in 2004. This increased share also confirms foreign investors’ increased confidence in the Turkish economy and may add to the pace of private credit expansion.
3.
Disinflation and Credit Demand
With the successful implementation of a mix of prudent monetary and fiscal policies, bank restructuring program and structural reforms, economic and financial stability were strengthened. These developments also contributed to credit expansion, mostly from the demand side, due to the remarkable fall in inflation and the associated reduction in nominal as well as real interest rates (Figure 2). Right after the crisis in February 2001, the instrumental independence of the Central Bank was approved by the Parliament, and the primary goal of the Bank was set as maintaining price stability. In that context, the Central Bank switched to the floating exchange rate regime and declared its new policy framework as “implicit inflation targeting”.
BIS Papers No 28
367
Figure 2 CBRT Policy Rate and Benchmark Interest Rate on Government Securities
Source: CBRT.
In 2004, yearly change in the consumer price index decreased to single digits after more than 30 years, and most of the public believes that the ongoing recovery in inflation is not temporary. Inflation expectations improved significantly, and both consumer and corporate confidence were regained. As a result of these improvements, both investment and consumption spending that were deferred following the crisis started picking up and have manifested themselves in credit demand to the banking system. EU prospects and convergence expectations also played an important role in the pace of credit demand growth. Moreover, political stability, as well as the new three-year economic program announced at the end of 2004, with sound fundamentals and endorsement by both the EU 2 and the Bretton Woods institutions, 3 helped reduce the risk premia on all securities issued in Turkey.
Demand by types of loans A key way of looking at credit growth is by the type of borrower, in particular, the distinction between households and companies (Table 6). There has been a substantial increase in credit extended to the household sector. In an environment of increasing certainty, decreasing domestic and foreign funding costs and inflation levels, banks began to restructure their assets, which has supported this growth in credit demand. Furthermore, deferred consumption expenditure, especially on durable goods, has been realized and has contributed to rapid credit growth.
2
Pre-Accession Economic Program, 2004.
3
Moghadam et al. (2005).
368
BIS Papers No 28
Table 6 Real Credit Growth By Borrowers Yearly Change, %2
Households (Billions of US Dollars) Corporate Sector (Billions of US Dollars)
2002
2003
2004
June 2005
4
10
20
26
24
34
49
60
85.7
78.1
71.4
69.6
2.9
72.0
79.5
54.4
1.9
25.9
18.3
1
Corporate Sector to Private Sector Credit Ratio (%) Real Household Credit Growth (CPI 1994=100) Real Corporate Sector Credit Growth (CPI 1994=100) 1
–1.1
Corporate sector = private credit - consumer loans - credit cards.
2
All items are calculated in net terms.
Source: CBRT.
The increase in corporate credit has been slower compared to household loans. The share of household loans surged to 30 percent of total credit extended to the private sector in July 2005, from 14 percent in 2002. When consumer credit is analyzed based on subcategories, it is seen that in 2004, the fastest increase was in automobile loans. This is partly due to the tax incentive on new car purchases that was eliminated as of 2005. After May 2005, housing loans gained momentum and their share exceeded that of automobile loans. While all types of consumer loans increased in 2005, housing loans increased most. It is expected that housing loans will become more widespread and that their maturity will further extend. Apart from this development, with the introduction of the legal framework for the mortgage system in 2006, the construction sector and its subsidiary industries are expected to grow further. Demand by currency 4 Due to high degrees of asset and liability dollarization, the currency denomination of loans is another key element in understanding the nature of credit growth in Turkey. Borrowing in foreign currency, which is related to currency risk, has generally been driven by lower foreign interest rates compared to domestic rates and the appreciation of domestic currency. Since customers cannot hedge against currency risk, exchange rate risk may translate into sizeable credit risk for the banking sector. As for currency composition, the share of YTL denominated loans has exceeded the share of FX denominated ones since 2003 (Table 7). The main reasons behind this improvement in balance sheet are reverse currency substitution and the preference of borrowers due to the explicit currency risk associated with the floating exchange rate regime. Therefore, real credit growth stemmed mainly from YTL denominated credits. Since 2002, FX denominated credit growth has increased by only 2 percent on average. However, YTL denominated credits have increased enormously: 35.5 percent on average.
4
We mainly focus on bank credit to the private sector, excluding bank credit extended to the public sector and credit extended by non-bank financial institutions. However, currency and maturity composition of bank credit to the private sector is not available, so total credit extended by the banking sector is used in this analysis.
BIS Papers No 28
369
Table 7 Credit Growth By Currency 2002
2003
2004
June 2005
Real Credit Growth (CPI 94=100)
–0.6
14.2
37.2
25.8
YTL Denominated Credit (Billions of US Dollars, Net)
12
26
48
62
41.1
54.6
64.8
68.1
–16.3
51.8
62.7
43.9
18
22
26
29
FX Denominated Credit to Total Credit
58.9
45.4
35.2
31.9
FX Denominated Credit Growth (CPI 94=100)
14.3
–12.0
6.5
–0.9
YTL Denominated Credit to Total Credit YTL Denominated Credit Growth (CPI 94=100) FX Denominated Credit (Billions of US Dollars, Net)
Source: CBRT.
4.
Challenges for Financial Stability
Experience in Eastern Asia and elsewhere has shown that macroeconomic instability and deterioration of loan quality may be triggered by excessively rapid credit growth. Although Turkey is far from that point, the rapid expansion of loans may nevertheless add to the current account deficit and inflationary pressures. However, perceived risk of loans may be underestimated by the banks. During such lending boom periods, the loan quality typically deteriorates due to optimistic risk assessments based on the current strong economy and the higher value of collateral. From this perspective, this section examines the risks and opportunities produced by rapid credit growth in the Turkish banking system, and its macroeconomic effects.
Changing nature of risks The banking sector, whose balance sheet has improved significantly since the 2001 crisis, is still highly exposed to government securities despite the decline of its share in the balance sheet. As of June 2005, the ratio of the net debt stock of the government to GDP declined to 58%. Furthermore, the budget deficit of the general government is expected to be around 3 percent of GDP in 2005 and to improve further in 2006-2008. Therefore, fiscal dominance and the associated risks on the Turkish financial system are expected to decline further in the future. Nevertheless the banking sector is now much more resilient against currency risk. The banking sector’s net FX short position to capital ratio is close to balanced despite the observed appreciation of YTL, reverse currency substitution and higher yields of YTL instruments. This can mainly be attributed to the floating exchange rate regime. Regarding credit risk, risks stemming from household loans are much less than those from the corporate sector. The reason for this is the fact that consumer loans have the most diversified customer base and an adequate collateral structure (especially for automobile and housing loans), which is considered as a favorable condition for credit growth in this category. In the real sector, the profitability of corporations has recovered, but a combination of short-term foreign currency debt and still limited equity capital would pose a risk. The corporate sector should learn to hedge their currency risk under the flexible exchange rate regime.
370
BIS Papers No 28
On the household side, despite presenting a decreasing trend, foreign currency assets are still considerable. The debt stock of households is expected to increase with the increase in consumer loans and enforcement of the mortgage law.
Maturity mismatch The main new risk area for the Turkish banking system is the interest rate risk that stems from maturity mismatch and fixed rate consumer lending. In general, in emerging countries, the maturities of loans tend to be shorter than in developed countries, due to the lack of long-term domestic and foreign funding. This observation is true for Turkey as well (Table 8). Table 8 Maturity Composition and Interest Rate Structure As a Share of Total Credit, % 2002
2003
2004
June 2005
Sample Average
0-12 Months
56.2
57.6
55.7
51.2
55
12-24 Months
17.3
14.1
17.9
21.6
18
Greater than 24 Months
26.5
28.3
26.4
27.2
27
Fixed Interest Rate Loans
70.2
82.3
86.2
90.4
82
Floating Interest Rate Loans
29.8
17.7
13.8
9.6
18
Source: CBRT.
Table 8 shows that the share of short-term loans is falling. Even though the majority of total loans are short-term (0-12 months), the share of short-term loans has decreased in 2005. The rise in the share of long-term loans has stemmed from consumer loans, the majority of which are longer than one year. However, depending on developments on the liability side, the increase in the maturity of loans could adversely affect the maturity mismatch problem and the liquidity risk of the Turkish banking system. The majority of loans are extended at fixed interest rates. The share of fixed rate loans, which was 70.2 percent at the end of June 2002, increased to 91 percent as of June 2005, as a consequence of an enormous increase in consumer loans. 5 This shows that Turkish banks are becoming more vulnerable to unexpected interest rate increases. Within this framework, making new arrangements that allow floating rate consumer loans along with fixed rate ones and the use of derivative instruments would be beneficial for the sector to mitigate interest rate risk.
Non-performing loans Even though non-performing loans (NPLs) are one of the main indicators of loan quality, they are a lagging indicator of banking system indicators. In Turkey, the NPL ratio has fallen since 2002 (Table 9) and is now at comparable levels to its peers (Figure 3). The aforementioned ratio decreased from 17.6 percent in 2002 to 5.4 percent in June 2005. The increase in the debt-servicing capacity of
5
Article 10 of the Law on the Protection of Consumers (Law No: 4077), as amended by Law No: 4822, states that the aforementioned credit transaction cannot be changed against a consumer within the contract period. Consumers have the opportunity to close the loans they use prior to maturity. The article regarding credit cards (No 10/A) states that if the minimum payment amount declared in the account summary is not paid at maturity, the consumer does not enter into an obligation under any name except for the default interest (the default interest rate cannot exceed the contract rate by more than 30 percent).
BIS Papers No 28
371
the borrowers, the effects of restructured loans under the “Istanbul Approach” 6 which was put into practice in the beginning of 2002, arrangements for enhancing effective risk management by banks and improvement in banks’ risk perceptions are the major factors that contributed to the fall in NPL ratio. The increased share of household NPLs in total NPLs stems mainly from the increase in nonperforming credit cards. Starting from the end of 2002, this ratio increased continuously from 2.9 percent to 17 percent as of June 2005. Since there has been no significant change in the NPL ratio of consumer loans since the end of 2003, NPLs of credit cards are seen as the main factor for the increase in the aforementioned ratio. However, the draft law on credit and bank cards prepared by the Banking Regulation and Supervision Agency includes prudential measures on credit cards. In addition to the decline in the NPLs to gross loans ratio, the provisions to NPL ratio has been increasing. As of June 2005, the ratio increased to 88.4 percent from 64.2 percent in 2002. This increase, however, indicates that banks are more robust against credit risk.
Table 9 Non-Performing Loans
1
2002
2003
2004
6
6
5
5
–37.2
–30.1
–32.6
7.2
17.6
11.5
6.0
5.4
2.9
2.8
11.4
17.0
NPL Ratio for Consumer Loans
3.1
1.1
0.7
0.6
NPL Ratio for Credit Cards
5.0
2.4
4.4
6.5
64.2
88.5
88.1
88.4
NPLs (Billions of US Dollars) NPL Growth (CPI 1994=100) 2
NPL Ratio (%) Household' NPL3 to Total NPL (%)
Provisions to NPL Ratio (%)
June 05
1
NPLs include loans classified as substandard, doubtful and loss. These loans are recorded as non-performing receivables 2 3 NPL ratio is the ratio of non-performing loans to gross loans. Non-performing loans when they are 90 days past due. (NPLs) of households include past due consumer credit and credit card obligations. Source: CBRT.
6
In order to rehabilitate the companies that became insolvent due to the twin crises in 2000-01, Law No: 4743 dated 31 January 2002 on “Restructuring of Debts to the Financial Sector and Amendments to be Made to in Some Acts” was issued. Based on the aforementioned Law, “The Regulation on Terms Related to the Acceptance and Application of the Framework Agreements for Financial Restructuring” was issued on 11 April 2004 by the BRSA, and “The Financial Restructuring Framework Agreement” by the Turkish Banks Association was approved by the BRSA on 4 June 2002.
372
BIS Papers No 28
Figure 3 NPL Ratio of Selected Countries1
Source: IMF International Global Financial Stability Report, September 2005 1
Data for Argentina are for June 2005; for Bulgaria, Croatia, the Czech Republic, Latvia, Romania, Russia, Ukraine, March 2005; for Brazil, Poland, Hungary, the Slovak Republic and Lithuania, December 2004; for Estonia, April 2005 for Turkey, July 2005.
Connected lending Throughout the 1990s, most private banks belonged to family-owned industrial groups. These banks lent to their owners and to related companies due to lax definitions of related parties and broad limits in relation to capital. Moreover, these private banks had heavily funded themselves from international markets with a shorter maturity and invested in longer maturities in either government securities or loans to insiders or related parties, making them vulnerable to all types of shocks. Following the 2001 crisis, in order to reduce credit risk, significant measures were taken which included revised lending limits made parallel to EU regulations, a broader definition of credit to include forwards, option contracts, similar derivatives and shareholding interests, and regulation of connected lending complemented with limitations on partnership in non-financial subsidiaries. Also, the recapitalization operation helped achieve a transparent picture of the credit risk of the private sector. Group connections and hidden exposures were identified so that more effective measures could be taken. The new Banking Act of 2005 includes additional regulations in this area. Today, connected lending is becoming less significant in the Turkish banking system. The strong and independent Banking Regulation and Supervision Agency (BRSA) monitors and controls connected lending. This monitoring increases the robustness of the banking system. However, it should be kept in mind that most of the banks taken over by SDIF (Savings Deposit Insurance Fund) have been banks extending connected lending. Further reductions in connected lending would improve the health of credit expansion. Deposit insurance The consensus among academics, policymakers and international institutions on the effects of deposit insurance is that it benefits overall financial stability, but also imposes costs because of the encouragement of risk taking and misallocation of resources. Also, due to reduced market discipline and moral hazard, there is an intensified need for government supervision. The case of deposit insurance in general, or a particular deposit insurance scheme, thus depends on the relative strengths of these two counteracting forces. The risk-taking effect outweighs the stability effect, at least for full deposit insurance. BIS Papers No 28
373
Demirgüç-Kunt and Detragiache (1998) find that deposit insurance increases risk by weakening market discipline and encouraging excessive risk-taking. Similar results have been obtained in more recent studies. However, Gropp and Vesala (2001), among others, claim that deposit insurance decreases crisis risk by preventing bank runs due to depositor panic, and that this effect is stronger overall than the adverse moral hazard effects. In line with those two opposing views, deposit insurance has been a two-way street for Turkey. The introduction of full guarantees to all savings deposits after the 1994 crisis, coupled with regulatory forbearance in the past, inevitably increased moral hazard problems and ended with the inclination of banks and depositors towards taking more risks, leading to the deterioration of market discipline. The BRSA has recently announced its plans to gradually reduce deposit insurance to EU levels. As of July 2005, the full guarantee on deposits was eliminated. The government insures up to 50,000 YTL of savings deposits. In this way, limitation of deposit insurance will decrease risk by strengthening market discipline and discouraging excessive risk-taking.
5.
Challenges for Monetary Policy
Both in the literature and in practice, it is generally accepted that rapid credit growth poses potential risks for macroeconomic stability. Increased opportunity to borrow eases liquidity constraints on households and firms, leading to higher consumption and investment. Given the short-run constraints, this upward shift in credit-financed domestic demand would tend to exert upward pressure on prices in assets, goods and labor markets. Concurrently, demand for foreign goods - both consumption and investment - will rise, causing deterioration in the trade balance. Thus, a rapid increase in credit can put upward pressure on prices in a fixed exchange rate regime, while it may reduce international competitiveness and deteriorate the current account with a nominal exchange rate appreciation under a float. This section will discuss the macroeconomic risks and opportunities of rapid credit growth experienced in Turkey. In Turkey, GDP grew significantly during the rapid credit growth period (Table 10). In 2000, GDP was 185 billion US dollars. Just after the crisis, it declined to 124 billion US dollars with devaluation and decreased demand and investment. However, after the successful implementation of the economic program, political stability and EU expectations, GDP increased to 341 billion US dollars as of June 2005. Table 10 Macroeconomic Indicators 2000
2001
2002
2003
2004
GDP (Billions of US Dollars)
185
124
170
258
321
341
Current Account Balance (Billions of US Dollars)
–10
3
–2
–8
–16
–13
Private Sector Credit (Billions of US Dollars, Net)
45
25
28
44
69
86
Exports f.o.b. (Billions of US Dollars)
31
34
40
51
67
37
Financial Account Balance (Billions of US Dollars)
10
–15
1
7
18
19
54.9
54.4
45.0
25.3
10.6
9.6
11.8
21.1
11.1
10.7
8.4
116.3
125.4
140.6
143.2
159.5
Consumer Price Index (Base Year 1994=100) (Yearly Average) Ex Ante Real Interest Rates Real Effective Exchange Rate (CPI 95=100)
147.6
June 2005
Source: CBRT.
374
BIS Papers No 28
Current account balance deterioration is observed during the same period. The current account balance reached a record deficit level of 16 billion US dollars in 2004, from a surplus of 3 billion US dollars in 2001. As of June 2005, there was a deficit of 13 billion US dollars. A positive development is the increasing export performance of the Turkish economy. Despite discussion about the negative effects of rapid credit growth on international competitiveness, the export performance of the Turkish economy has improved. As of 2004, exports were 67 billion US dollars. In June 2005, the first six-month performance was 37 billion US dollars, which increases the hopes of reaching 70 billion US dollars at the end of the year. The increase in domestic demand attracts capital inflows, which indicates higher profit opportunities due to increased domestic demand. It is observed that there has been a huge capital inflow during the rapid credit growth period. As of June 2005, the financial account generated a 19 billion US dollar surplus. This surplus indicates and confirms that the capital inflow is due to increased economic activity and higher profit expectations of foreign capital. Despite credit expansion, consumer price inflation is decreasing. Inflationary pressures still remain at a manageable level, despite the surge in oil prices. Another positive development is decreasing ex ante (expected) interest rates. In the credit boom period, although domestic demand has shown an upward trend, ex ante interest rates have been following a decreasing trend. As of June 2005, ex ante real interest rates declined to 8.4 percent, from 21.1 in 2002. Moreover, the real effective exchange rate (CPI 95=100) indicates a strong currency appreciation during the credit boom period. As of June 2005, the real effective exchange rate (REER) has climbed to 159.5, which is a record level compared to 116.3 in 2001.
6.
Conclusions
The rapid credit growth in emerging market economies, especially in central and eastern European countries, during recent years leaves policymakers with a number of difficult questions in deciding how to respond to the credit boom. Finding ways to reduce the risk of rapid credit growth and to improve the management of this boom is one of the big policy challenges in today’s new financial architecture. The two main drivers of the recent credit boom observed in Turkey have been fiscal consolidation and disinflation. The fast pace of public debt reduction and improvements in the public sector borrowing requirement have helped the growth in credit supply, through increased availability of funds. The disinflation process, however, has stimulated credit demand. So far this is a healthy credit expansion pattern that stems from two healthy developments on the macro side. As far as the microprudential aspects are concerned, the main challenge of the future will be the gradual implementation of Basel II in Turkey. On the macroeconomic side, the continuation of prudent policies with a careful eye on financial stability will be essential.
References CBRT (2005). “Financial Stability Report - 2005”, Central Bank of the Republic of Turkey, Ankara. Demirgüç-Kunt, A. and Detragiache, E. (1998). “Financial Liberalization and Financial Fragility”, prepared for the World Bank Annual Conference on Development Economics, March. Gropp, R. and Vesala, J. (2001). “Deposit Insurance and Moral Hazard: Does the Counterfactual Matter?”, Working Paper Series No: 47, European Central Bank. Moghadam, R.; Celasun, O.; Debrun, X.; Griffiths, M. E. L. (2005). “Turkey at the Crossroads: From Crisis Resolution to EU Accession”, IMF Occasional Paper No. 242. Otker_Robe, İ.; Pazarbasioglu, C.; Johnsen, G.; Hilbers, P. (2005). “Assessing and Managing Rapid Credit Growth and the Role of Supervisory and Prudential Policies”, IMF Working Paper No. WP/05/151. PEP (2004). Pre-Accession Economic Program, Republic of Turkey, State Planning Organization, Ankara. BIS Papers No 28
375