Asian Social Science; Vol. 10, No. 4; 2014 ISSN 1911-2017 E-ISSN 1911-2025 Published by Canadian Center of Science and Education
The Benefits of Diversification in Asean Stock Market to Malaysia Investors Q. R. Goh1, M. N. Annuar2 & M. A. Zariyawati2 1
Graduate School of Management, Universiti Putra Malaysia, Selangor, Malaysia
2
Faculty of Economics & Management, Universiti Putra Malaysia, Selangor, Malaysia
Correspondence: M. A. Zariyawati, Faculty of Economics & Management, Universiti Putra Malaysia, 43400 UPM Serdang, Selangor, Malaysia. Tel: 60-3-8946-7710. E-mail:
[email protected] Received: October 27, 2013 doi:10.5539/ass.v10n4p78
Accepted: November 27, 2013
Online Published: January 26, 2014
URL: http://dx.doi.org/10.5539/ass.v10n4p78
Abstract The establishment of ASEAN Exchange had removed the barriers and hassles from investors in six ASEAN member countries to invest freely and easily within the six countries’ stock market, including Malaysia. This study aimed to analyse whether the establishment of ASEAN Exchange, can provide diversification benefit to Malaysian investors compared with their domestically diversified portfolio. The analysis is done based on 25 companies which selected from each participating ASEAN country by using Efficient Frontier Model. In addition, Sharpe Ratio had also been developed and analysed to provide an insight to Malaysia and ASEAN investors regarding the attractiveness of each ASEAN market. The results of this study conclusively show that an ASEAN level of diversification does bring benefits to Malaysian investors, as ASEAN portfolio outperforms all individual country’s portfolio. Keywords: ASEAN Exchange, diversification, efficient frontier index, Sharpe ratio 1. Introduction Investors today actively and purposefully diversify their investments to different area in order rise the return by lessen the risk of their investment at the same time. The effect of diversification using portfolio to increase return and reduce investment risk had been proven by researchers. The diversification value of a portfolio is said to be positive in 3 circumstances: 1) A portfolio had a higher return and lower risk than the other one. 2) A portfolio is able to achieve higher return at same level of risk. 3) A portfolio is able to achieve same level of return at lower level of risk. So, how can investors obtain positive diversification value? Harry Markowitz’s portfolio theory had provided the answer, Markowitz stated that positive diversification value exist in any assets that are imperfectly correlated, the lower the correlation between the assets, the higher the diversification value. Therefore, due to the lower correlation between different countries’ economy, internationally diversified portfolio generally had more diversification value than a domestically diversified portfolio in terms of both risk and return. However, recent years studies had shown that the value of international diversification is reducing, as the worldwide financial market is becoming more assimilated due to the improvement of telecommunication and transportation technologies and the removal of trade barrier (Fadhlaoiu, Bellalah, & Lahiani, 2011). Despite the common belief on the reduction of diversification value in international diversification, ASEAN Exchange, a collaboration that consists of 7 exchanges from 6 different countries in South East Asia, including Malaysia’s Bursa Malaysia, Vietnam’s Hanoi Stock Exchange (HNX) and Ho Chi Minh Stock Exchange (HOSE), Singapore’s Singapore Exchange (SGX), Indonesia’s Indonesia Stock Exchange (IDX), Thailand’s The Stock Exchange of Thailand (SET) and Philippine’s Philippine Stock Exchange (PSE), is trying to create an integrated stock exchange in 2015 that will allows investors from all member’s countries to purchase stocks listed in other members’ countries in their home countries seamlessly at a lower cost (ASEAN Exchange, 2013). As at 15th October 2012, the ASEAN Trading Link established by the ASEAN Exchange had linked Bursa Malaysia, Singapore Exchange and The Stock Exchange of Thailand, offering more than 2,200 listed companies to the investors in Thailand, Singapore and Malaysia (ASEAN Exchange, 2013). Although the research by Agati (2007) 78
www.ccsenet.org/ass
Asian Social Science
Vol. 10, No. 4; 2014
shows that financial markets in European Union (EU), a similar but more integrated collaboration like ASEAN, are highly correlated to each other, hence the diversification value is low, similar research had not been perform for ASEAN financial market in recent years. Hence, the objectives of this paper are stated below: 4) To assess the diversification value that Malaysian investors could gain through ASEAN diversification by utilizing the ease of ASEAN Trading Link. 5) To evaluate whether diversification in developing market like ASEAN can achieved the positive diversification value similar to developed market like EU. 6) To rank the attractiveness of different ASEAN countries’ financial market for ASEAN countries investors to invest in, through the study of their efficient frontier. 7) To provides an insight to Malaysian and ASEAN investors regarding the optimal risky portfolio to invest in different ASEAN countries. The rest of the paper is organised as follows. In the next section a review of prior diversification studies is summarised. This is followed by describing the sample used and the methodology employed. The findings and discussions section follows and the paper ends with highlighting the main results of the study. 2. Literature Review In 1991, Madura and O’Brien (1991) conduct a research to study the effect of international diversification benefit to individual investors, the research review the strategies and means for individual investors to participate in international diversification, and comes out with a conclusion that although international diversification benefit exists at that time, the benefits may decline as world financial market become more integrated. The finding by Madura and O’Brien (1991) open the gates for future researcher to study whether the power of international diversification had fade away over time, multiple researchers then conduct studies on the diversification value of international diversification, to name a few, in year 1995, Harvey (1995) study 20 emerging economies and conclude that emerging market can provide high level of diversification benefits due to its low correlation with developed market, the inclusion improve the risk-return profile of the portfolio significantly. The findings also conclude that the low correlation between developed and developing market is due to the fact that developing market are more likely to be influenced by local information rather than worldwide information. Dresden and Laeven (2004) research, on the other hand, shows that international portfolio investment brings benefits to both developed and developing countries investors, however, higher diversification value can be obtained by local investors in developing market, the study were conducted based on a sample of 52 countries and the period from 1985 to 2002, the results also conclude that developing countries investors are worse off if restricted to invest overseas compared with developed countries investors. However, as developing countries investors are often restricted or lack of the opportunities to invest overseas, the result brings no actual benefits to them, but it clearly shows the importance of financial liberation to investors in the world. Another research that specifically focus on the effects of international diversification on the risk of portfolio is performed by Agati (2007), the author chosen index from German, French, U.S. and China to study, the study period is from 2000 to 2006, interestingly, the authors found out that the U.S. portfolio which consist of only stocks from S&P 500, had similar level of risk compared with the portfolio that consists of all 4 countries’ stocks, but the international portfolio had a higher rates of return. The results indicate that international diversification does not necessarily reduce the risk of investing solely in domestic market; but investors can achieve higher level of return at same level of risk using international diversification. In year 2010, You and Daigler’s research found out that international markets are experiencing an increment of correlations over time as compared with earlier research, the research is done based on the weekly data from 17 different markets from 1997 to 2002, increased in correlation had result in a decline of diversification value, also, the benefits of international diversification are asymmetric, especially during the time of bull market. In 2011, a research done by Hsu from California State University that study the period from August 2002 to September 2010, found out that although the world financial market is becoming more and more interdependence, this interdependence, nevertheless, did not reduce the benefits of international diversification for United States investors. The research also found out that portfolio that consist of gold, silver and investment grade corporate bond can provide higher diversification value due to its lower correlation with United States markets. This research, though, did not specify clearly regarding the proportion to invest in different region. Also in year 2011, Christofferson, Errunza and Jacobs; performs empirical studies on developed and emerging 79
www.ccsenet.org/ass
Asian Social Science
Vol. 10, No. 4; 2014
markets, based on the weekly returns during the period from 1973 to 2009. The research is done through the analysis of correlations and tail dependence, their finding shows that there is a significant upward trending correlations in both developed and emerging markets, but the emerging market correlations with emerging markets are significantly lower compared with developed market, this finding suggest that there is strong diversification value in emerging markets exist for emerging market investors. The research finding is similar to the one perform by Dresden and Laeven (2004), which shows that emerging market investors can obtain higher diversification value through international diversification than developed market investors. To provide a basis of comparison, few researches that specifically focus on emerging market across Asia and Europe will also be reviewed. Fadhlaoui, et al. (2009) conduct an empirical examination on the diversification benefits of the emerging markets in Central Europe, the research examined both short and long-term relationship between the G7 and 3 Central Europe emerging markets, namely Czech-Republic, Hungary and Poland. Similar to the current situation in Malaysia, Central Europe market at that time is liberalizing their market to integrate with the greater European Union market, just like what Malaysia is currently doing to join the greater ASEAN market through the ASEAN Exchange. Fadhlaoui, et al. finding concludes that emerging markets do provide high level of diversification value, specifically to the investors from developed markets. However, the countries covered in the research are very limited, an expansion to include more Central Europe market could be better. Another research conducted by Sazali, et al. (2004) try to focus on the international diversification value from a Malaysian perspective, the research had chosen 20 different stock markets including both developed and developing markets to study, the period of study is from 1987 to 2003, and the analysis had been divided into pre, during and post crisis period, also, this research specifically incorporate the effect of currency to provide a more comprehensive result. The research finding does not provide full support to previous studies, as it shows that Malaysian investors, under certain condition, can be better off by investing solely in domestic markets, as Malaysia local market already had a numbers of low correlation stocks, the finding is contradict to the previous research that indicate international portfolio investment can always bring benefits to domestic investors. After looking at the recent works on international diversification, another subject that is critical to international portfolio investment is the currency rate, in year 1996, Solnik states that the volatility in currency would not have a major impact on the international investment portfolio over long run as the appreciation in a currency is a result of depreciation of another currency, therefore a well-diversified international portfolio should diversified the currency risk away at the same time. Shetty and Manley (2006) research, however, provide a different opinion, based on the data from 1988 to 1997, Shetty and Manley found out that the return’s correlation between United States and Canada is lower when measured in investors’ home currency, the correlation fall from 0.675 to 0.603; the results indicate the importance of currency in international investment. However, the research cover only United States and Canada, the applicability to the world market remain in doubts. As a summary for the literature review, we can see in the recent studies conducted by researchers from different countries, the effect of international diversification in improving the risk-return profile of a portfolio is reducing, as a result of worldwide financial market integration, but the diversification value of an international portfolio still exists currently, particularly in emerging markets. Emerging markets not only provide a source for risk reduction for both developed and developing market investors, it also provides extremely higher return to investors in developed market compared with their local market. 3. Data In order to understand the benefits of an ASEAN diversification to Malaysian investors, the efficient frontier of the 6 ASEAN Exchange’s member countries and a portfolio that consists of stocks from every 6 members countries, will be created and compared with Malaysia domestic portfolios. Based on the analysis of Moody’s (2013), the most cost-effective risk reduction is a portfolio that consist of 25 stocks, by investing in 25 different stocks, 80% of the diversifiable risk could be reduce by this way, this analysis is similar with Elton and Gruber (1977) work, which shows that the benefit of risk reduction reduce significantly when more than 20 assets had been add in to the portfolio. Therefore, 25 most attractive stocks will be selected from each member countries, the 25 stocks are selected based on their attractiveness, only those stocks that are being listed under ASEAN Stars will be selected, ASEAN Stars is a selection of top 30 blue chip stocks from each members countries, they are the most attractive and exciting companies under ASEAN Exchange; another criteria for the selection is the data availability. The study used daily closing figures for all the 150 stocks selected, over a period of 3 year from 1st January 2010 80
www.ccsenet.org/ass
Asian Social Science
Vol. 10, No. 4; 2014
to 31st December 2012, this period was selected to avoid any structural break like economy crisis, there are no significant economy event happen during this period. Lists of the selected stocks from each country are available upon request. 4. Methodology In this study, we are interested in understanding whether an ASEAN diversified portfolio can outperform the portfolio constructed solely based on Malaysia domestic stocks. The independent variables in this study will be the characteristic of the assets, whether it is domestic stocks or international stocks, while the dependent variables will be the performance of the portfolio, as measured by efficient frontier, efficient frontier index and Sharpe Ratio. It is expected that international stocks may improve the performance of the portfolio. Therefore, efficient frontier and efficient frontier index for each countries and ASEAN portfolio will be first created and compared with the 3 portfolio that is constructed domestically in Malaysia. After evaluating the efficient frontier, each country risk free rate will be employed to find out the optimal risky portfolio for each country, and their return and risk will be evaluated accordingly. In order to do this, the formula shown below will be used. 4.1 Return All of the closing price of each stock will be first converted into percentage return using the formula shown below:
R
e1 e0 e0
(1)
where: R = return of the assets; e0 = price at time 0; e1 = price at time 1. 4.2 Arithmetic Mean Arithmetic mean is the average value of a set of data; it is calculated using the sum of all data divide by the total number of data. In finance, arithmetic mean is use as a way to determine the average return of an asset, the formula is shown below:
X where:
X N
(2)
X =arithmetic Mean; ΣX = sum of all data values; N = numbers of data.
4.3 Variance The risk of the stock is measured using the variability of the returns of the stocks, using the formula below:
s
2
(X
i
X )2
N 1
(3)
where: S2 = Variance of the stocks; Xi = each of the return of the stocks; X = the mean of the return of the stocks; N = the numbers of the stocks. 4.4 Standard Deviation Standard deviation is the square root of variance, it provides a more standard way of comparison on the variability of the returns of the stocks, as it is measure in the same unit as the mean, while variance is the square of the mean, in finance, standard deviation is the most widely acceptable measurement of an asset’s risk, the formula of standard deviation is shown below:
s s2 Where: S = Standard deviation of the stocks; S2 = Variance of the stocks.
81
(4)
www.ccsenet.org/ass
Asian Social Science
Vol. 10, No. 4; 2014
4.5 Covariance Covariance is a mathematical concept that are used to understand the degree of which 2 different variable vary together, as mentioned earlier, Modern Portfolio Theory states that the lower the correlation between 2 different asset is, the better is their diversification value. By using covariance formula, one can determine whether 2 different assets have a positive or negative relationship, if it had a positive covariance, this 2 assets will move in the same direction together, if it had a negative covariance, then the 2 assets will move in opposite directions, if the covariance is zero, then the 2 assets had no relationship in the movement at all. Covariance is also one of the inputs needed in the calculation of the standard deviation of a portfolio, the formula is shown below:
COVxy
(X
i
X )(Yi Y )
(5)
N 1
where: COVxy= Covariance between stock X and Y; Xi = each of the return of the stock X; return of the stock X; Yi = each of the return of the stock Y;
X = the mean of the
Y = the mean of the return of the stock Y; N = the
numbers of the observations. 4.6 Portfolio Return The return for portfolio is calculated as the weighted average of the return of the stocks in the portfolio, using this formula:
R p Wi Ri
(6)
where: Rp = the expected return of portfolio; ΣWi = 1; Wi = the proportion of stock in total portfolio; Ri = the expected return of individual stock; N = the number of stock in the portfolio. 4.7 Portfolio Standard Deviation Unlike the portfolio return, the portfolio standard deviation is not only the weighted average of the standard deviation of each asset in the portfolio; it also required one to include the covariance of the 2 assets, the formula is shown below:
S p ( wi si (2 wi w j COVi , j )) 2
2
(7)
where: Sp = standard deviation of the portfolio; Si= standard deviation of stock i; Wi = weightage of stock i in the portfolio; COVi,j = covariance of stock i and j. 4.8 Sharpe Ratio Sharpe Ratio is the figure that is used to evaluate the portfolio, it is also known as the reward-to-variability ratio, it measures the excess return per unit risk, the higher the Sharpe ratio, the better the risk-return profile of a portfolio or asset is, the formula of Sharpe Ratio is shown below: Sharpe Ratio
(Rp R f )
Sp
(8)
where: Rp = the expected return of the portfolio Rf = the risk free rate Sp = the standard deviation of the portfolio 4.9 Efficient Frontier Microsoft Excel 2013 with Solver add-on is being used to develop the efficient frontier that will be used to study in this paper. Solver is an optimization program that can be used to solve for the efficient frontier. First, a 82
www.ccsenet.org/ass
Asian Social Science
Vol. 10, No. 4; 2014
variance-covariance matrix of each country’s 25 stocks will have to be created. Secondly, with the variance-covariance matrix as the input, put in the weightage equal to 1 as the constraint for the solver, this is to limit the total weightage to equal 1, and tick the “make unconstrained variables non-negative” to make sure there will be no negative weightage, this is to reflect the non-availability of short sales in Malaysia. Thirdly, run the solver to find the weightage that minimize the variance of the portfolio, with that, we can find the minimum variance portfolio for the given set of assets. The forth step is to create efficient frontier, by adding in specific level of return as another constraint on top of the previous constraint, we can make solver solve for the minimum standard deviation at that level of return, an efficient frontier can then be graphed by changing different level of return and solve for the minimum standard deviation. Similarly, by using the solver, one can find the portfolio weightage that maximize the Sharpe Ratio, which is the optimal portfolio/tangency portfolio for the given set of assets. This could be done by putting in the risk free rate to the Microsoft Excel, and set the constraint of weights equal to 1, and solve for the weightage. This method to create the efficient frontier is developed by Zivot (2009). 4.10 Efficient Frontier Index As mentioned earlier, the evaluation of the superiority of efficient frontier is usually being done visually, in which the more northwest the efficient frontier is, the better the efficient frontier is. However, in some instances, when the efficient frontier cross each other, normal visual evaluation may failed to judge whichever efficient frontier is the better one. Therefore, an absolute way to define the superiority of efficient frontier is being developed and introduced by Sazali, et al. (2004), which is known as the Efficient Frontier Index, the general rule of the efficient frontier index is the higher the index, the better the efficient frontier, the index can then provide an absolute way to compare the superiority of efficient frontier compared with the visual technique, the formula is shown below:
Ri n Ri Rlowest i 1 S i i 1 Si S lowest
EF Index
n
(9)
where: Ri = all points of Expected Return on a set of optimal portfolio Si = all points of Standard Deviation on a set of optimal portfolio Rlowest = the expected return of minimum variance portfolio Slowest = the standard deviation of minimum variance portfolio 5. Results and Discussions The findings of this paper can be divided into 3 parts. First, an analysis on the efficient frontier will be performed between 6 different ASEAN countries portfolio, ASEAN portfolio and 2 additional Malaysia portfolios, the evaluation will be done visually and through the efficient frontier index. Second part of the findings will incorporate the risk free rate of each countries, and find out the optimum portfolio that maximize the Sharpe Ratio from each of the efficient frontier, the proportion to invest in each country/company will be given at this section. Third part of the findings will present an analysis on the optimum portfolio of each efficient frontier to the readers; readers can have an understanding on the risk-return profile for each optimum portfolio, this part will provide a ranking of each market based on their Sharpe Ratio to the readers too.
83
www.ccsenet.org/ass
Asian Social Science
Vol. 10, No. 4; 2014
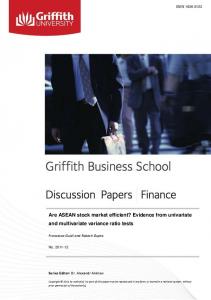
5.1 Efficient Frontier
Figure 1. Efficient frontiers for Malaysia, Singapore, Thailand, Indonesia, Philippines, Vietnam, ASEAN, Malaysia ACE and Malaysia Random Figure 1 shows the efficient frontier generated using Microsoft Excel 2013. It exhibits the ASEAN portfolio that consists of stocks from every member countries is more superior than other portfolios as it is located most northwest than the other portfolios. Meanwhile, the Vietnam efficient frontier is the inferior the efficient frontier located most southeast. Malaysia-ACE portfolio crossed ASEAN portfolio when the return is 70%. At the crossed point, Malaysia-ACE portfolio is able to provide higher return at the same level of risk and lower risk at same level of return. However, this creates a situation where visual evaluation alone is not enough to judge which efficient frontier is better. In addition, the situation becomes more puzzles when we remove ASEAN portfolio since efficient frontier of each countries cross each other at different level of risk and return. As a result, the ranking financial market of each country becomes impossible by relying solely on the visual evaluation alone. The only conclusive result at this stage is about Vietnam Portfolio where it is the worst among all of the countries and markets that are being evaluated. Therefore, Efficient Frontier Index is used to find out a conclusive evaluation and ranking for all the countries and market. The result of the Efficient Frontier Index is given in Table 1 below. Table 1. Efficient frontier index for Malaysia, Singapore, Thailand, Indonesia, Philippines, Vietnam, ASEAN, Malaysia ACE and Malaysia Random portfolio A
ASEAN MY-ACE Indonesia Philippines Singapore Malaysia Thailand MY-Random Vietnam
B
C
D
E
F
G
H
Lowest E(R)
Lowest SD
No. of portfolio
Sum of each E(R)/each SD
Sum of E(R)-min E(R)
Sum of SD-min SD
Sum E/G
0.13 0.32 0.19 0.20 0.10 0.13 0.27 0.25 0.07
0.33 1.16 1.11 0.89 0.66 0.41 0.81 0.63 1.11
11 8 10 9 6 6 7 6 7
6.03 2.92 2.63 3.24 1.34 2.25 2.72 2.63 1.52
2.95 1.54 2.08 1.87 0.49 0.62 0.95 0.73 1.55
5.04 1.78 3.58 2.04 0.92 1.31 1.54 1.53 1.98
16.83 18.09 23.84 14.77 20.34 9.13 8.38 5.96 7.12
84
I of
Sum G*D 9.29 6.10 5.18 5.04 3.71 3.48 3.24 2.78 0.89
of
www.ccsenet.org/ass
Asian Social Science
Vol. 10, No. 4; 2014
As mentioned earlier, the Efficient Frontier Index (EFI) is created using Microsoft Excel 2013 by using method which developed by Sazali et al. (2004). Column I displays EFI and each country are being ranked according to the EFI. Table 1 revealed ASEAN portfolio is the top of the ranking with highest EFI of 9.29. Follow by Malaysia-ACE portfolio, which ranked second with EFI of 6.10. Table 1 also displays that Vietnam portfolio ranked last with EFI of 0.89. This result is consistent with the visual evaluation method (referring Figure 1). Hence, this result supports the previous findings where internationally diversified portfolio is always better than a domestically diversified portfolio. In this situation, ASEAN portfolio’s level of diversification outperforms the entire three Malaysia domestically diversified portfolio. However, this result is contradict to the finding of Sazali, et al. (2004) which Malaysian investors can achieved better risk-return combination using a domestically diversified portfolio than an internationally diversified portfolio. As at this stage, we can say that ASEAN diversification does provide benefits to Malaysian investors when referring to the EFI alone. 5.2 Optimal Risky Portfolio The optimal risky portfolio is identified by using Sharpe ratio. Portfolio is at optimal risk at the highest level of Sharpe Ratio at the given risk-free rate. The government bond issue by each country is used as proxy of risk-free rate. Meanwhile the average risk free rate of every member countries is used as proxy risk-free rate of ASEAN portfolio. The optimal risky portfolio for each portfolio is given in the figure 2.
Figure 2. Optimal portfolio weightage for ASEAN portfolio As the ASEAN portfolio consists of 150 different companies, the figure is simplified to indicate only the proportion to invest in each countries, a detailed table that specify the weightage to invest in each companies can be found in appendix. As the short-selling is prohibited in Malaysia, all of the calculation is done based on no-short sell allowed assumption; reader is able to understand the proportion to invest in each country or company in order to obtain the highest possible Sharpe Ratio. In other words, the weightage stated above will give investors the best risk-reward combination under the given risk-free rate for each country. 5.3 Ranking of Optimal Risky Portfolio In this section, the optimal portfolio for each country will be ranked according to their different variables, which are the expected return, standard deviation and the Sharpe Ratio.
85
www.ccsenet.org/ass
Asian Social Science
Vol. 10, No. 4; 2014
Figure 3. Ranking of portfolio based on standard deviation Figure 3 exhibits Malaysia portfolio tops the table with the lowest standard deviation. The results indicate that investing only in the domestic market can let investors exposed to the minimum level of risk. This is contradict to the common belief that international diversification can lower the risk. However, this finding is congruent to the studies performed by Agati (2007), which stated that international diversification does not necessarily reduce risk compared with a domestically diversified portfolio. Figure 3 also shows Singapore is the only developed economy in ASEAN recognized by the IMF (2013), ranked only in the 4th place. This result indicates that developed countries market does not certainly had lower risk compared with the developing market. This result served as a reference for investors that concern only for the risk of their investment, if that is the case, invest at the stated proportion in last section for Malaysia portfolio can let investors exposed to minimal level of risk. With the given risk-free rate from each countries (referring to figure 4), Malaysia ACE market top the table that ranked portfolio based on the expected return alone with the expected return of 69.13%. The top 4 places are occupied by the developing market. This is consistent with the previous findings that the developing market can achieve higher rate of return than the developed market. In this case, Singapore’s optimal risky portfolio ranked number 8 out of 9 portfolios that are being evaluated. Therefore, investors who concerned only about the return may obtain highest level of return by investing 100% in the Malaysia-ACE portfolio with the proportion stated in last section. Hence, comparing figure 3 and figure 4, we can say that investors who pursue ultimate risk or return, that is to say, investors who want only the highest return or lowest risk, can achieve so by investing solely in a domestically diversified portfolio.
86
www.ccsenet.org/ass
Asian Social Science
Vol. 10, No. 4; 2014
Figure 4. Ranking of portfolio based on expected return Although Malaysian investors can rely on domestically diversified portfolio to achieve highest return or lowest risk in ASEAN, the story is different when we compared risk and return together. As shown in figure 5, the ASEAN portfolio completely outperforms the other market’s portfolio with a Sharpe Ratio of 60.49. This result the result is similar with the study performed by Agati (2007). Although domestically diversified portfolio can achieve lowest level of risk, nevertheless internationally diversified portfolio outperform domestic portfolio in terms of risk-return combination. Moreover, in Malaysia context, Malaysian investors can even achieve highest level of return through domestic portfolio. However, an ASEAN portfolio still dominates the other entire portfolio in terms of risk-return combination as measured by Sharpe Ratio. Also, if we exclude the ASEAN portfolio from the comparison, we can see that Malaysia-ACE portfolio, Malaysia-Random portfolio and Malaysia portfolio had taken 3 of the top 4 places in the table, with Malaysia-ACE portfolio top the table. Therefore, we can say that Malaysian investors will not be worse off as much as other ASEAN countries investors if the ASEAN Trading Link did not establish.
Figure 5. Ranking of portfolio based on Sharpe ratio
87
www.ccsenet.org/ass
Asian Social Science
Vol. 10, No. 4; 2014
6. Conclusion The visual evaluation method presented in figure 1 failed to provide a conclusive result on the superiority of the efficient frontier for each market. However, the efficient frontier index conclusively prove that an ASEAN portfolio outperform the entire domestically diversified portfolio. This is including 3 different domestically portfolio from Malaysia that consists of Malaysia’s top 25 blue chip stocks, 25 randomly chosen stocks from main market and 25 randomly chosen stock from secondary market respectively. The result remains the same when different countries’ risk free rates were incorporated to find out the optimal risky portfolio to invest in ASEAN and also every member countries respectively. The outcome shows that ASEAN portfolio again lead all others portfolio with the highest Sharpe Ratio. However, despite the fact that ASEAN portfolio can provides investors the best risk-return combination. It is notable that the ASEAN’s highest return portfolio and the ASEAN’s lowest risk portfolio remains to be the Malaysia domestically diversified portfolio, that is Malaysia-ACE portfolio and Malaysia portfolio respectively. As a conclusion, the findings of this paper support the previous studies of international diversification, in which international diversification does provides better risk-return combination compared to the domestic diversification. Results of this study suggest that an ASEAN level of diversification does provides benefit to Malaysian investors compared to Malaysia domestically diversified portfolio. However, the ranking of optimal risky portfolio as shown in figure 5, had provide us an insight into the ASEAN financial market, as 3 of the Malaysia domestic portfolio ranked number 2, 3 and 5 out of the 9 portfolios that is being evaluated respectively. Even though it is clear that the establishment of ASEAN Trading Link that provides the ease of trading between 6 different ASEAN countries to Malaysian investors had gave Malaysian investors an opportunities to improve their portfolio performance. The benefit to Malaysian investors is lower compared with other ASEAN countries’ investors. Undeniably, the participation of Malaysia’s stock market in the ASEAN Trading Link provides other ASEAN countries’ investors greater diversification value than other ASEAN market can provides to Malaysian investors. This is proven in Figure 2 where the proportion of Malaysia market in the ASEAN portfolio is the highest which constitute about 33% of the ASEAN portfolio. References Agati, A. (2007). The Effects of International Diversification on Portfolio Risk. Retrieved March 4, 2013, from http://digitalcommons.iwu.edu/cgi/viewcontent.cgi?article=1002&context=econ_honproj ASEAN Exchange. (2013). ASEAN http://www.aseanexchange.org
Stars
by
Market.
Retrieved
Bursa Malaysia. (2013). Equities. Retrieved March http://www.bursamalaysia.com/market/securities/equities/prices/#/?filter=BS02
March 4,
2,
2013,
2013,
from from
Christoffersen, P., Errunza, V., Jacobs, K., & Langlois, H. (2011). Is the Potential for International Diversification Disappearing? Working Paper, Rotman School of Management, University of Toronto, Canada. Dresden, J., & Laeven, L. (2004). International Portfolio Diversification Benefits: Cross-Country Evidence from a Local Perspective. Journal of Banking & Finance, 31, 1693-1712. Elton, E. J., & Gruber, M. J. (1977). Risk Reducation and Portfolio Size: An Analytic Solution. Journal of Business, 50, 415-437. http://dx.doi.org/10.1086/295964 Fadhlaoui, K., Bellalah, M., & Lahiani, A. (2011). The Contribution of Emerging Markets to International Diversification. Bankers, Markets & Investors, 31-50. Fadhlaoui, K., Bellalah, M., Dherry, A., & Zouaouii, M. (2008). An Empirical Examination of International Diversification Benefits in Central European Emerging Equity Markets. International Journal of Business, 13(4), 331-348. Harvey, C. R. (1994). Predictable Risk and Returns in Emerging Markets. Review of Financial Studies, 8(3), 773-816. http://dx.doi.org/10.1093/rfs/8.3.773 Hsu, H. C. (2011). Global Risk Diversification: An Empirical Investigation from the U.S. Perspective. International Business & Economics Research Journal, 10(8), 57-66. IMF.
(2012).
World
Economic
Outlook:
October 88
2012.
Retrieved
March
4,
2013,
from
www.ccsenet.org/ass
Asian Social Science
Vol. 10, No. 4; 2014
http://www.imf.org/external/pubs/ft/weo/2012/02/pdf/text.pdf Madura, J., & O’Brien, T. J. (1991). International Diversification for the Individual: A Review. Financial Services Review, 1(2), 159-175. http://dx.doi.org/10.1016/1057-0810(91)90031-S Markowitz, H. M. (1952). Portfolio Selection. The Journal of Finance, 7(1), 77-91. Moody’s. (2013). Diversification. Retrieved http://www.efmoody.com/investments/diversification.html
March
4,
2013,
from
Sazali, Z. A., Ariff, M., Annuar, M. N., & Shamser, M. (2004). International Portfolio Diversification: A Malaysian Perspective. Investment Management and Financial Innovations, 3, 51-68. Sharpe, W. J. (1966). Mutual http://dx.doi.org/10.1086/294846
Fund
Performance.
Journal
of
Business,
39(1),
119-138.
Sharpe, W. J. (1972). Risk, Market Sensitivity and Diversification. Financial Analysts Journal, 74-79. http://dx.doi.org/10.2469/faj.v28.n1.74 Shetty, A., & Manley, J. (2006). Analysis of the Currency Impact on International Investment. Managerial Finance, 32(1), 5-13. http://dx.doi.org/10.1108/03074350610641839 Solnik, B. (1974). Why Not Diversify Internationally Rather Than Domestically? Financial Analysts Journal, 30(4), 48-54. http://dx.doi.org/10.2469/faj.v30.n4.48 Solnik, B., Boucrelle, C., & Fur, Y. L. (1996). International Market Correlation and Volatility. Financial Analysts Journal, 52(5), 17-34. http://dx.doi.org/10.2469/faj.v52.n5.2021 You, L., & Daigler, R. T. (2009). The Strength and Source of Asymmetric International Diversification. Journal of Economics and Finance, 34, 349-364. http://dx.doi.org/10.1007/s12197-009-9081-7 Zivot, E. (2009). Efficient Portfolios in Excel Using the Solver and Matrix Algebra. Retrieved February 28, 2013, from http://faculty.washington.edu/ezivot/econ424/Efficient%20Portfolios%20in%20Excel%20Using% 20the%20Solver%20and%20Matrix%20Algebra.pdf Appendix Appendix 1. Optimal portfolio weightage for Malaysia portfolio Company Name AMMB Holdings Berhad Axiata Group Berhad British American Tobacco CIMB Group Holdings Berhad DiGi.Com Berhad Genting Malaysia Berhad Genting Berhad Hong Leong Bank Berhad Hong Leong Financial Group Berhad IOI Corporation Berhad Kuala Lumpur Kepong Berhad Malayan Banking Berhad Maxis Berhad
Weight 0.0000 0.1319 0.0000 0.0000 0.1183 0.0000 0.0000 0.0751 0.0000 0.0000 0.0000 0.0000 0.0000
Company Name PPB Group Berhad PETRONAS Dagangan Berhad PETRONAS Gas Berhad Public Bank Berhad RHB Capital Berhad Sime Darby Berhad Tenaga Nasional Berhad Telekom Malaysia Berhad UEM Land Holdings Berhad UMW Holdings Berhad YTL Power International Berhad YTL Corporation Berhad
Weight 0.0000 0.1920 0.1102 0.1320 0.0000 0.0000 0.0000 0.1166 0.0000 0.1240 0.0000 0.0000
Appendix 2. Optimal portfolio weightage for Singapore portfolio Company Name
Weight
CapitaLand Limited
0.0000
CapitaMalls Asia Limited ComfortDelGro Corporation Limited City Developments Limited
0.0000 0.0000 0.0000
Company Name Oversea-Chinese Banking Corporation Limited Olam International Limited Sembcorp Industries Ltd Singapore Exchange Limited 89
Weight 0.0000 0.0000 0.0000 0.0000
www.ccsenet.org/ass
Company Name DBS Group Holdings Ltd Fraser and Neave, Limited Golden Agri-Resources Ltd Genting Singapore PLC Hongkong Land Holdings Limited Jardine Matheson Holdings Limited Jardine Cycle & Carriage Limited Keppel Corporation Limited Noble Group Limited
Asian Social Science
Weight 0.0000 0.3540 0.0000 0.0000 0.0000 0.2161 0.0442 0.0000 0.0000
Vol. 10, No. 4; 2014
Company Name SIA Engineering Company Limited Singapore Airlines Limited Singapore Press Holdings Limited StarHub Ltd Singapore Technologies Engineering Ltd Singapore Telecommunications Limited United Overseas Bank Limited Wilmar International Limited
Weight 0.0000 0.0000 0.0000 0.3857 0.0000 0.0000 0.0000 0.0000
Appendix 3. Optimal portfolio weightage for Thailand portfolio Company Name Advanced Info Service Public Company Limited Airports of Thailand Public Company Limited
Weight
Company Name
Weight
0.0268
Shin Corporation PCL
0.0558
Banpu Public Company Limited
0.0000
Bangkok Bank Public Company Limited
0.0000
BEC World Public Company Limited
0.0191
Bangkok Dusit Medical Services Public Company Limited Big C Supercenter Public Company Limited C.P. All Public Company Limited Charoen Pokphand Foods Public Company Limited Central Pattana Public Company Limited Total Access Communication Public Company Limited Electricity Generating Public Company Limited Glow Energy Public Company Limited
KASIKORNBANK Public Company Limited Krung Thai Bank Public Company Limited Land & Houses Public Company Limited PTT Exploration and Production Public Company Limited Ratchaburi Electricity Generating Holding Public Company Limited
0.0000
0.2491 0.1409
The Siam Commercial Bank PCL
0.0000 0.0000 0.0000 0.0000 0.0242 0.0000
0.0910
The Siam Cement Public Company Limited Siam City Cement Public Company Limited TMB Bank Public Company Limited
0.0399
Thai Oil Public Company Limited
0.0000
0.1131
Thai Union Frozen Products Public Company Limited
0.0261
0.1508 0.0451
0.0000 0.0000 0.0000
0.0179
Appendix 4. Optimal portfolio weightage for Indonesia portfolio Company Name Astra Agro Lestari Pt Astra International Tbk Bank Central Asia Tbk Bank Negara Indonesia Bank Rakyat Indonesia Bank Danamon Indonesia Tbk
Weight 0.0000 0.0000 0.0000 0.0000 0.0000 0.0000
PT Bank Mandiri
0.0000
Bumi Resources Tbk Charoen Pokphand Indonesia Tbk Axiata Tbk
0.0000 0.3218 0.1320
Company Name PT Indocement Tunggal Prakarsa Tbk PT Indo Tambangraya Megah Tbk PT Jasa Marga (Persero) Tbk PT Kalbe Farma Tbk PT Lippo Karawaci Tbk PP London Sumatra Indonesia Tbk PT Perusahaan Gas Negara (Persero) Tbk PT Bukit Asam (Persero) Tbk PT Semen Gresik (Persero) Tbk PT Telekomunikasi Indonesia, Tbk. 90
Weight 0.0000 0.0000 0.2261 0.2098 0.0000 0.0000 0.0000 0.0000 0.0000 0.0000
www.ccsenet.org/ass
Company Name Gudang Garam Tbk Vale Indonesia Tbk PT Indofood Sukses Makmur Tbk
Asian Social Science
Weight 0.1103 0.0000 0.0000
Vol. 10, No. 4; 2014
Company Name United Tractors Tbk PT Unilever Indonesia Tbk
Weight 0.0000 0.0000
Appendix 5. Optimal portfolio weightage for Philippines portfolio Company Name Ayala Corporation Aboitiz Equity Ventures, Inc. Alliance Global Group, Inc. BDO Unibank, Inc. Belle Corporation Bank of the Philippine Islands DMCI Holdings, Inc. Energy Development Corporation First Gen Corporation Globe Telecom, Inc. International Container Terminal Services, Inc. Jollibee Foods Corporation JG Summit Holdings, Inc
Weight 0.0000 0.2291 0.0485 0.0000 0.0932 0.0000 0.1435 0.0000 0.0000 0.0000
Company Name Metropolitan Bank & Trust Company Megaworld Corporation Manila Electric Company Metro Pacific Investments Corporation Manila Water Company Inc. Philex Mining Corporation ROBINSONS LAND CORPORATION SM Investments Corporation San Miguel Corporation SM Prime Holdings, Inc. The Philippine Long Distance Telephone Company Universal Robina Corporation
0.0069 0.0000 0.1341
Weight 0.0000 0.0000 0.0000 0.0000 0.1381 0.0000 0.0000 0.0000 0.0000 0.0000 0.0000 0.2066
Appendix 6. Optimal portfolio weightage for Vietnam portfolio Company Name
Weight
Asia Commercial Bank
0.0000
Bank for Foreign Trade of Vietnam Bao Viet Holdings
0.0000 0.0000
Dabaco Corporation
0.0034
HAGL JSC Kinh Do Corporation
0.0000 0.0000
Masan Group Corp
0.0000
PetroVietnam Southern Gas JSC
0.0000
Petrochemical JSC
0.1143
PetroVietnam Technical Services Corp Petrovietnam Fertilizer and Chemical JSC
0.0000 0.0001
Petrovietnam Construction Corporation
0.0000
PetroVietnam Insurance
0.0000
Company Name Saigon-Hanoi Commercial Joint Stock Bank The Southern Rubber Industry JSC Tien Phong Plastic JSC Viet Nam Construction and Import-Export JSC Vietnam Dairy Products JSC Vietnam Export Import Bank Vietnam National Reinsurance Corporation Vincom JSC Vinaconex Advanced Compound Stone JSC Sai Gon Thuong Tin Real Estate JSC Saigon Securities, Inc. Vietnam Joint Stock Commercial Bank For Industry and Trade
Weight 0.3743 0.0000 0.0000 0.0000 0.0000 0.0000 0.0000 0.0000 0.0000 0.0000 0.0000 0.5080
Appendix 7. Optimal portfolio weightage for Malaysia-Random portfolio Company Name Patimas Computers Berhad K & N Kenanga Holdings Berhad Alam Maritim Resources Berhad
Company Name Kamdar Group(M)Bhd Kpj Healthcare Berhad Lien Hoe Corporation Berhad
Weight 0.0115 0.0000 0.0000
91
Weight 0.0201 0.1248 0.0143
www.ccsenet.org/ass
Company Name Air Asia Berhad Scomi Group Berhad Allianz Malaysia Berhad Berjaya Corporation Berhad Bimb Holdings Berhad Dutch Lady Milk Industries Bhd Gamuda Berhad Harrisons Holdings (Malaysia) Berhad Handal Resources Berhad Hwa Tai Industries Bhd
Asian Social Science
Weight 0.0121 0.0000 0.1561 0.0000 0.0558 0.4671 0.0000 0.0089 0.0000 0.0037
Vol. 10, No. 4; 2014
Company Name Lion Corporation Berhad Malayan Flour Mills Berhad Mmc Corporation Berhad Olympia Industries Berhad Rapid Synergy Berhad Press Metal Berhad Premier Nalfin Berhad Permaju Industries Berhad Voir Holdings Berhad
Weight 0.0000 0.0000 0.0000 0.0000 0.1185 0.0000 0.0030 0.0043 0.0000
Appendix 8. Optimal portfolio weightage for Malaysia-ACE portfolio Company Name Gpro Technologies Berhad Asia Bioenergy Technologies Berhad Ariantec Global Berhad At Systematization Berhad Ingenuity Consolidated Berhad Mexter Technology Berhad Sanichi Technology Berhad Solution Engineering Holdings Berhad Technodex Bhd The Media Shoppe Berhad 1 Utopia Berhad Winsun Technologies Berhad Maxis Berhad
Weight 0.0569 0.0218 0.0322 0.0733 0.0519 0.0547 0.0038 0.0000 0.0000 0.0302 0.0000 0.0303 0.0336
Company Name Borneo Aqua Harvest Berhad Extol Msc Berhad Focus Dynamics Technologies Berhad Gd Express Carrier Berhad Infortech Alliance Berhad Instacom Group Berhad K-One Technology Berhad Lng Resources Berhad M N C Wireless Berhad Puc Founder (Msc) Berhad Ytl Power International Berhad Ytl Corporation Berhad
Weight 0.0558 0.0445 0.0000 0.2906 0.0698 0.0221 0.0049 0.0272 0.0458 0.0336 0.0172 0.0000
Copyrights Copyright for this article is retained by the author(s), with first publication rights granted to the journal. This is an open-access article distributed under the terms and conditions of the Creative Commons Attribution license (http://creativecommons.org/licenses/by/3.0/).
92