Biogeochemistry 53: 249–267, 2001. © 2001 Kluwer Academic Publishers. Printed in the Netherlands.
The carbon content characteristics of tropical peats in Central Kalimantan, Indonesia: Estimating their spatial variability in density SAWAHIKO SHIMADA1∗, HIDENORI TAKAHASHI1, AKIRA HARAGUCHI2 & MASAMI KANEKO3 1 Graduate School of Environmental Earth Science, Hokkaido University, N.10 W.5, Kita-ku, Sapporo 060-0810, Japan; 2 Department of Environmental Science, Faculty of Science, Niigata University, Ikarashi 2-8050, Niigata 950-2181, Japan; 3 Hokkaido Institute of Environmental Sciences, N.19 W. 12, Kita-ku, Sapporo 060-0819, Japan (∗ Author for
correspondence, e-mail:
[email protected])
Key words: AVHRR, Central Kalimantan, multiple regression, peatland types, tropical peatland, volumetric carbon density Abstract. Clarification of carbon content characteristics, on their spatial variability in density, of tropical peatlands is needed for more accurate estimates of the C pools and more detailed C cycle understandings. In this study, the C density characteristics of different peatland types and at various depths within tropical peats in Central Kalimantan were analyzed. The peatland types and the land cover types were classified by land system map and remotely sensed data of multi-temporal AVHRR composites (1-km pixel size), respectively. Differences in the mean values of volumetric C density (CDV ) were found among peatland types owing to the variability in physical consolidation from peat decomposition or nutrient inputs, although no vertical trends of CDV were found. Using a step-wise regression technique, geographic variables and the categories of peatland type and land cover type were found to explain 54% of the variability of CDV within tropical peatlands in some conditions. Abbreviations: CDV – Volumetric carbon density; TPS – Total pore space
Introduction Sorensen (1993) estimated the total amount of carbon (C) sequestered in peat in Indonesia at 15.93–19.29 Gt (1 Gt = 1015 g) assuming that C content is constant at 53.44% and bulk density of 114 kg m−3 . Peat deeper than 6 m was not considered, this accounts for 3–4% C mass of peatland C pools (329–525 Gt) of the world (Immirzi & Maltby 1992). In Indonesia, 3.72 Mha of the total peatland (17.85 Mha, RePPProT 1990), have had some form of development. At least 0.5 Mha have been cultivated by transmigrated farmers (Maltby &
250 Immirzi 1996). Furthermore, the huge 1997/98 forest fires burned, not only the surface vegetation over a large areas of peat swamp forests in Kalimantan and Sumatra but also the part of the underlying peat (Page & Rieley 1998). Owing to these drastic land system changes in recent years, an enormous amount of carbon may have been released to the atmosphere from tropical peatlands. To estimate the amount of C emission after land use change and to derive accurate C pool estimates, the more detailed knowledge of the spatial variation in C content and bulk density (BD) is needed. In some temperate-subarctic regions variability in BD and C content among different peatland types (Botch et al. 1995) or at various depths (Howard et al. 1995) have been reported and applied for the calculation of C pool estimates. A lot of efforts have been done to clarify the spatial variability in BD (e.g. Subagjo & Driessen 1974; Driessen & Rochimah 1976) or C content (e.g. Suhardjo & Widjaja-Adhi 1976; Abdullah 1997) of the tropical peats, which are mainly wood peat as opposed to sedge and Sphagnum moss peat in temperate-subarctic regions (Andriesse 1988; Rieley et al. 1992). BD and C content, however, have been studied separately in the previous reports and few efforts have been done to analyze BD and C content in the same peat samples. To authors’ knowledge, only Neuzil (1997) published the combined data of BD and C content of tropical peats, although the values of BD were estimated from other peat samples. Combined data on BD and C content are needed to determine the value of volumetric C density (CDV , kg m−3 ), which are needed to estimate spatial C mass distribution. While CDV has been used for soils (e.g. Brown & Lugo 1990; Liski & Westman 1995; Van Dam et al. 1997) and for peats in a temperate region (e.g. Minkkinen & Laine 1998) to trace the vertical C content characteristics or to measure long-term change in C density, there have been no reports using CDV on tropical peats. The variation in CDV with depth are potentially very important in tropical peatlands, which are often 10 m, and sometimes up to 20 m deep (Bruenig 1990; Rieley et al. 1992). This work has done in tropical peatlands of Central Kalimantan to analyze CDV in various peatland types, land cover types and at various peat depths. The aim of this study is to clarify the spatial variability in CDV in tropical peatlands and to estimate the CDV in tropical peats from the geographical position.
251
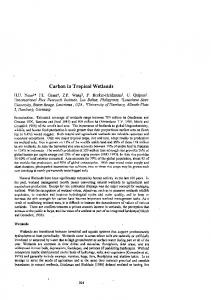
Figure 1. (a) Peatland distribution in Sumatra and Kalimantan, modified from the Digital Chart of the World (ESRI 1993). (b) Peatland type map of Central Kalimantan, modified from RePPProT (1985). The circled points indicate plots of peat core (cf. Table 2). * Riverine peatlands exists in some depression areas within riverine areas.
Materials and methods Study sites and peatland classification Seventy-five percent of the total Indonesian peatland area occur in Sumatra and Kalimantan (RePPProT 1990). Most of the peatlands lie in coastal lowlands within five degrees of the equator (Figure 1(a)). We selected study sites in Central Kalimantan (Figure 1(b)), which holds 15% of the total Indonesian peatland area (calculated from: ESRI 1993 and RePPProT 1990). The climate of Central Kalimantan is humid tropical; mean annual temperature varies between 25–27 ◦ C and the mean annual precipitation varies between 2300–3000 mm (Boerema 1931; BAPPEDA 1993; Asdak 1995; Takahashi & Yonetani 1997). Evapotranspiration exceeds precipitation in less than three months per year (Neuzil 1997). Based on the land system map of Regional Physical Planning Programme for Transmigration (RePPProT 1985), we classified the peatland types of Central Kalimantan into terrace, basin/domed, riverine, floodplain and marginal peatland (Table 1; Figure 1(b)). The study sites were located in five different peatland types (Table 2, Figure 1(b)). Data of plot PK3 (Neuzil
252 1997) were added as terrace peatland type (Table 2, Figure 1(b)). For comparison, some data of Riau (BK5, SK6), Sumatra and Keramat (WK3), West Kalimantan (Neuzil 1997) were also studied (Table 2, Figure 1(a)). Since the base of the peat deposits BK5, SK6 and WK3 are at ca. 0 m a.s.l., we categorized these peatlands as coastal peatlands (Table 1) according to the previous category based on the topographical location (Andriesse 1974; Anderson 1983; Rieley et al. 1996). The elevation, the distance from the nearest river and from the nearest sea coast at each study site was calculated from data by Moore et al. (1992, 1996), Supardi et al. (1993), Neuzil et al. (1993), Neuzil (1997), the map of BAKOSURTANAL (1993), and the Digital Chart of the world (ESRI 1993) (Table 2). Different sets of forest types of tropical peatlands have been distinguished in northern Borneo and Sumatra (Anderson 1975, 1983) and Kalimantan (Shepherd et al. 1997). However, it is difficult to extend the types to our whole study areas because of the regional differences of the types (Rieley & AhmadShah 1996) and of the species richness within the types (Anderson 1976). For this reason, we used multi-temporal remotely sensed data to classify land cover types of tropical peatland in Kalimantan and Sumatra. Since the classification using the thermal band indices were acceptable in the tropics (Foody et al. 1996), classification based on the ratio of Ts (surface radiation temperature) and NDVI (Normalized Difference Vegetation Index) in the period of 1992–1993, i.e. before the large scale forest fire occurred in 1994, were used in this study. The 10-days composite data (Apr. 1992–Sep. 1993; NDVI, channel-4, channel-5) of 1-km × 1-km NOAA-AVHRR (Advanced Very High Resolution Radiometer) over Sumatra-Kalimantan area were acquired from EROS (Earth Resources Observations Systems) Data Center (cf. Eidenshink & Faundeen 1994). Ts was calculated using the following equation by assuming the surface emissivity to be 0.96 (Nemani et al. 1993): Ts = Tc4 + 3.3(Tc4 – Tc5 ), where Tc4 and Tc5 are brightness temperature (K) of AVHRR channel-4 and channel-5, respectively. The maximum Ts and maximum NDVI ratio (Ts /NDVI) (cf. Lambin & Ehrlich 1995) was calculated for every monthly period (18 months) from the 10-days composite data, and smoothed by moving median (3 months). Five principal components (PCs) (83% of the variance) were selected after principal component analyses (PCA) were performed on those multi-temporal (16 months) data of monthly Ts /NDVI. The unsupervised classification (ISODATA algorithm) (cf. Tou & Gonzales 1974) was conducted on the PCs, then the land cover types of the study sites were determined (Table 2) after smoothing the classified map by majority filter.
Table 1. General description, mineralogy and altitude of each peatland type in the tropics. Peatland type
General description
mineralogy
Altitude (m a.s.l.)
Riverine
Swampy floodplains mainly within terraces
Peat, Recent alluvium (riverine)
0–43
Terrace
Peat-covered sandy terraces
Peat, Old alluvium (sand)
5–50
Basin/Domed
Peat basins or domes
Peat
2–10
Marginal
Peat basin margins
Peat, Recent alluvium (riverine, estuarine/marine)
1–5
Floodplain
Alluvial floodplains between swamps, Permanently waterlogged plains, others†
Peat, Old alluvium (sand), Recent alluvium (riverine, estuarine/marine)
2–10
Coastal*
Coastal peatlands of the maritime fringe and deltas
Peat, Recent alluvium (estuarine/marine)
1–5
All the criteria are modified from RePPProT (1985) except for with the asterisked (*), which is modified from Rieley et al. (1996). † The sites where temporarily (in the wet seasons) waterlogged were also categorized as floodplain peatlands even though categorized as different peatland types on the Peatland Type Map (Figure 1) (cf. Table 2).
253
Site
Latitude
Longitude
Elevation (m a.s.l.)
Peatland type
N
Peat Depth (m) [Min] [Max]
Mineral layer below peat
Distance from river (km)
Distance from sea (km)
Land cover type
Lahei‡ Setia Alam Jaya‡ Marang PK3a Petukketimpun Hampangen
1◦ 2◦ 2◦ 2◦ 2◦ 1◦ 1◦ 1◦ 2◦ 2◦ 2◦ 2◦ 2◦ 2◦ 2◦ 2◦ 2◦ 2◦ 1◦ 1◦ 1◦
114◦ 113◦ 113◦ 113◦ 113◦ 113◦ 113◦ 113◦ 114◦ 114◦ 114◦ 113◦ 113◦ 113◦ 114◦ 113◦ 113◦ 113◦ 109◦ 102◦ 102◦
34* 12* 18* 25 (31*) 14* 37* 37* 41* 14* 20* 17* 13* 12* 12* 12* 14* 16* 9* 9 9 14
riverine terrace terrace terrace terrace terrace
9 3 1 1 1 3
[1.2] [1.8]
basin/doomed basin/doomed marginal marginal floodplain** floodplain** floodplain** floodplain** floodplain** floodplain** coastal coastal coastal
1 1 2 2 2 1 6 3 2 1 1 1 1
sand‡ sand‡ sandy clay‡ sandy clay sandy clay‡ sandy clay‡ sand‡ sand‡ sandy clay‡ clay‡ clay‡ clay‡ sandy clay‡ sand‡ clay‡ clay‡ clay‡ clay‡ clay clay clay
0–0/5 14–45 1 7 1 10 11 6 1 12 10 30–36 0 0 0–0.5 0.5–1.1 0 2 5 4 9
149–150 97–100 124 120 118 127 128 129 99 46 45 29 100–101 93 86–87 46–48 53 36 11 4 9
6 6, 7 7 6 6 9 6 6 11 13 11 7, 8 6, 8 9 8 6 6 11 8 9 10
Tumbangnusa Pankoh-B Pankoh-M Tanjung Mas UP-SBG Bakung Rasau Kajangpamali Musang Paduran WK3b BK5c SK6c
560 190 060 060 080 070 060 040 210 520 520 400 180 240 290 360 410 530 250 320 400
S S S S S S S S S S S S S S S S S S N N N
110 540 460 450 530 290 320 370 080 040 050 000 520 560 000 160 270 460 090 050 020
E E E E E E E E E E E E E E E E E E E E E
[2.4] [3.8] [0.5] [2.5] [0.5] [2.5]
[7.5] [4.1] 3.0 6.4 1.8 1.0 5.1 3.1 3.7 5.9 [5.3] [4.1] [5.0] 9.7 [4.5] [5.6] [5.2] 1.2 6.5 8.0 13.7
N: number of coring point. *Values are interpolated from BAKOSURTANAL (1997). ‡observed in the field. **The sites where temporarily (in the wet seasons) waterlogged were also categorized as floodplain peatlands even though categorized as different peatland types on the Peatland Type Map (Figure 1). Compiled from references as follows a Moore et al. (1996), Neuzil (1997). b Moore et al. (1992); Neuzil et al. (1993), Neuzil (1997). c Neuzil et al. (1993), Supardi et al. (1993), Neuzil (1997). ‡ The forest type of Setia Alam Jaya site is mixed swamp forest or pole forest dominated by Calophyllum hosei, Palaquim cochlearifolium, Parastemon spicatus, and Combretocarpus rotundatus (Shepherd et al. 1997). The vegetation of Lahei site is dominated by Shorea balangeran, Semecarpus sp., Buchanania sp. (Suzuki et al. 1998).
254
Table 2. Characteristics of the study sites and their corresponding peatland types of Central Kalimantan and coastal peatlands in Sumatra and West Kalimantan.
255 Methodology Peat samples were collected from undisturbed (virgin or secondary forested) peatlands in July–August 1997–1999. The geographic location of the sampling points was determined by GPS. Peat cores were taken from the surface to the base of peat layer using half cylinder type Eijkelkamp peat core sampler (cf. Neuzil et al. 1997) with a bulk capacity of 400 cm3 . However, it was impossible to sample the entire peat layer from one bore hole because of the presence of hard woody materials or fragmented samples which might be disturbed by the sampler. Thickness of peat layer was also measured with the sampler. Intact parts of cores were divided into samples of 40 cm3 pieces and sealed in plastic bags for analysis. The samples were weighted, oven-dried at 90 ◦ C over 24 hours, and stored for the analysis. Water content (WC) of a fresh peat sample was determined after measuring dry peat mass. Dry bulk density (BD) was calculated by dividing dry peat mass by fresh volume of the sample. Loss on ignition (LOI) of dry mass was measured after 550 ◦ C (ca. 5 h) combustion by electric muffle furnace. C content (CC) of dry mass was measured by CHN Elemental Analyzer (Elementar Vrio EL). Total pore space (TPS) was estimated by the equation: TPS = 1 – BD × (LOI/SDP + (1 – LOI)/SDA ) (cf. Driessen et al. 1976). We assumed the specific density of peat (SDP ) and ash component (SDA ) to be 1430 kg m−3 and 2650 kg m−3 , respectively (Driessen & Rochimah 1976). Volumetric C density (CDV ) was calculated by the equation: CDV = BD × CC. Sandy or clayey layers recognized in the field, we categorized these layers separately as such. Material with LOI lower than 65% was also attributed to as sandy/clayey layers (cf. Sorensen 1993) even though we did not categorize them as such in the field. Material with LOI lower than 50%, occurred only near the bottom of peat layers and was defined as mineral subsoil (cf. Immirzi & Maltby 1992). Large quantities of undecomposed woody fragments are present heterogeneously in tropical peats (cf. Anderson 1964; Yonebayashi et al. 1992). We categorized layers as ‘woody’ for 40 cm3 samples that contain wood debris more than 50% wood debris by volume. Sampling depths were normalized by setting the peat thickness at each sampling points at 1.0 to facilitate comparison of vertical CDV trends among peatland types (Figure 3). ANOVA (Sheffé’s test) was used to determine differences between mean values of CDV among peatland types. Step-wise multiple regression analysis was conducted to estimate CDV from the Geographic factors, peatland types and land cover types except for riverine peatland, which location is specific and not consecutive to the other peatland types (cf. Figure 1(b)).
256 Results Input of sand or clay significantly changes the peat characteristics, by decreasing WC, TPS and CC, and increasing BD and CDV . Yet mean CDV value of sandy/clayey layers is not significantly different from that of floodplain peatland (Table 3, Figure 4). Sandy/clayey peat layers may occur throughout the peat column in riverine peatland, while they occur only near the bottom (normalized depth > 0.6) in other peatland types (Figure 2). Woody peat sample occurred throughout the peat column except near the surface (Figure 2). From the number of samples (n, Table 3), woody peat sample was common in marginal (84%) and basin/domed (53%) peatland, and less in terrace (16%) and floodplain (12%) peatland. There was no information about the existence of woody layer at coastal peatlands (Neuzil 1997). There were no peats defined as woody layer at riverine peatland, although small pieces of wood debris were observed in the field. Without distinguishing these woody layers, no significant relationships within each peatland type were found between volumetric C density (CDV ) of pure (not woody) peat layers and normalized peat depth except for riverine peatland (r = –0.37, P < 0.05; Figure 3). Woody layers and pure peat layers have similar values of WC, TPS, BD, and CDV in basin/domed and marginal peatland, but showed clear differences (P < 0.05) between woody layers and pure layers of terrace and floodplain peatland (Table 3; Figure 4). Mean value of TPS and CDV were significantly different between terracefloodplain peatland type and coastal-marginal peatland type. Difference of mean CC value was only significant between terrace and floodplain peatland. No significant different mean values of WC and BD among peatland types were found (Table 3). The strong relationships, which have been previously reported (e.g. Päivänen 1976), between peat BD and TPS (r 2 = 0.95) and between CDV and TPS (r 2 = 0.85), were also found in this study (Figure 5). The coefficient of determination of CDV versus BD was lower (r 2 = 0.72). The variables of peat thickness, peatland type, land cover type, and geographic factors (altitude of peat layer, distance from nearest river and sea) explained 54.0% (or, with adjusted r 2 statistics, 50.8%) of the variability of CDV , although woody layers of terrace and floodplain peatland were not taken into consideration (Table 4).
Table 3. Peat characteristics of different peatland types in Central Kalimantan and coastal peatland. Values are the mean ±S.D. Values followed by the same letter are not significantly different at the P < 0.05 significance level. ANOVA was not conducted to the values with parentheses. Peatland Type
Riverine Terrace* (woody) (pure†) Basin/Domed (woody) (pure†) Marginal (woody) (pure†) Floodplain (woody) (pure†) Coastal** Sandy/Clayey layer Woody peat (total)
n
nSC
31 67 (11) (56) 15 (8) (7) 32 (27) (5) 57 (7) (50) 29 (53)
26 1
0
3
2
0 32
Water content
Carbon Content
Total pore space
(fresh mass)
% (dry mass)
(fresh volume)
87.9 ± 3.2a 88.5 ± 3.3a (91.2 ± 1.6) (88.1 ± 3.3) 91.1 ± 2.1a (91.0 ± 2.3) (91.2 ± 1.7) 91.3 ± 1.9a (91.3 ± 2.0) (91.6 ± 0.5) 87.9 ± 2.9a (89.9 ± 1.4) (87.6 ± 2.9) 90.9 ± 2.3a 78.8 ± 10.7 (91.0 ± 2.0)
55.5 ± 4.2bc 56.7 ± 5.1b (58.9 ± 5.7) (56.4 ± 5.0) 57.0 ± 4.5bc (55.9 ± 4.4) (58.3 ± 4.4) 56.6 ± 3.9bc (55.9 ± 3.8) (60.3 ± 1.5) 52.5 ± 8.0c (50.4 ± 10.3) (52.8 ± 7.6) 57.3 ± 2.8b 44.3 ± 8.0 (55.8 ± 6.1)
92.1 ± 1.8efg 92.1 ± 1.8fg (93.5 ± 1.5) (91.0 ± 2.0) 93.3 ± 1.5def (93.3 ± 1.5) (93.2 ± 1.2) 93.8 ± 1.5de (93.9 ± 1.6) (93.7 ± 0.3) 90.4 ± 2.9g (92.9 ± 1.0) (90.1 ± 2.6) 94.2 ± 0.8d 88.4 ± 2.5 (93.6 ± 1.5)
Dry bulk density
Volumetric carbon density
kg m−3 117 ± 27.5h 124 ± 31.3h (95.6 ± 21.7) (130 ± 19.7) 98.4 ± 22.3h (99.2 ± 25.6) (97.4 ± 17.8) 94.9 ± 25.2h (95.1 ± 27.2) (93.4 ± 6.5) 141 ± 35.1h (114 ± 17.7) (145 ± 35.3) 84.1 ± 11.5h 264 ± 163 (98.6 ± 25.6)
257
n: number of samples; nSC : number of sandy/clayey layer samples. †Samples without woody, sandy, clayey peat layers. *Some data (n = 9) are adapted from Neuzil (1997); **All the data are adapted from Neuzil (1997).
64.5 ± 14.0jk 71.5 ± 17.3j (56.3 ± 13.8) (74.4 ± 16.3) 55.8 ± 8.7kl (54.6 ± 10.9) (57.2 ± 4.9) 53.6 ± 12.5kl (53.1 ± 13.5) (56.2 ± 3.8) 72.9 ± 16.2ij (57.2 ± 13.0) (75.1 ± 15.3) 48.7 ± 6.3l 83.6 ± 18.7i (54.5 ± 13.2)
258
Figure 2. Vertical frequency of occurrence of woody peat samples (n = 32), and of sandy/clayey peat samples within riverine peatland (n = 16) and at other peatland types (n = 6).
Discussion Characteristics of volumetric carbon density From the correlations of CDV versus TPS (r 2 = 0.85) and BD (r 2 = 0.72), the different CDV values among peatland types could be explained by differences in TPS. This indicates that only physical consolidation contributes to the value of peat CDV . Inputs of mineral components due to rises flooding may have caused the physical consolidation on the peats of floodplain and riverine peatland. This aspect agree well with Parton et al. (1987) and Brown and Lugo (1990), who have reported that soil texture, particularly the silt plus clay content, and biotic factors play a role in the differences in C density among soil types. The degree of physical consolidation in pure peat layer may seem smaller in terrace than floodplain peatland (Figure 4). However, similar mean values and the 95% confidence intervals (±1.96 × SE) of CDV were due to the higher carbon contents in terrace peatland (Table 3). These results suggest that the formation of C consolidation in terrace peatland, which is thought to be ombrogenous (Neuzil 1997; Shepherd et al. 1997), is different from that in floodplain peatland. Since it is difficult to apply the soil taxonomy for tropical peats (Vijarnsorn 1986), we have not done any test to check the degree of peat decomposition. However, it is clear from the lower TPS (Table 3, Figure 4) and the lower frequency (16%) of woody layers (Table 3) that terrace peat is more decomposed than coastal, marginal, and basin/domed peat, which are also ombrogenous (cf. Neuzil 1997).
259
Figure 3. Variations in volumetric C density with normalized peat depth for all peatland types († without woody layer), sandy/clayey layer, and woody layer. r: correlation coefficient of volumetric carbon density versus normalized peat depth; P : p-value; N: number of coring points; n: number of samples.
260
Figure 4. Mean (±95% confidence interval) total pore space (A), bulk density (B), and volumetric C density (C) of peats between peatland types of riverine, floodplain, terrace († without woody layer), sandy/clayey layers and a combined category of basin/domed, marginal and woody layers.
Figure 5. Scatter diagram of volumetric C density and bulk density against total pore space.
261 Table 4. Regression model using stepwise regression procedure, with a variability of volumetric C density of 54.0% (adjusted 50.8%). Variable
Coefficient
S.E.
Constant Distance from seacoast (km) Distance from river (km) Altitude (m) Thickness of peat (m) Floodplain peatland*‡ Terrace peatland*‡ Basin/domed peatland* Coastal peatland* Land cover type 7* Land cover type 8* Land cover type 9* Land cover type 13*
49.89 −0.13 −0.8 1.09 −0.016 36.67 25.10 12.44 18.03 9.37 −7.59 −9.62 20.22
4.75 0.11 0.80 0.32 0.0063 5.62 9.25 8.28 5.46 3.30 3.40 4.83 8.90
Standardized estimate of coeff. −0.30 −0.15 0.42 −0.25 0.92 0.65 0.19 0.37 0.22 −0.18 −0.13 0.20
r 2 = 0.540; r 2 (adjusted) = 0.508. F(12,169) = 16.544, P < 0.001. *Peatland types and land cover types were included as dummy variables (1: included, 0: not included). ‡Woody peat layers were not taken into consideration for the regression model.
The variances on the values of CDV , BD, and TPS within a combined category of woody layer, coastal, marginal, basin/domed peatland were smaller than the other well-consolidated peatland categories (Figure 4). This result can be explained from the vertical heterogeneity in degree of decomposition. The existence of woody layers, with an extremely low degree of decomposition, enlarges the variances of the CDV and other peat physical characteristics within the well-consolidated peatlands (Table 3). From studies in temperate peatlands (e.g. Howard et al. 1995; Robinson & Moore 1999) where BD increases with increasing peat depth, we expected CDV to increase with increasing peat depth. However, we found no such relationships except in riverine peatland (Figure 3). Driessen and Rochimah (1976) reported that decomposition of Kalimantan peats has virtually stopped below depths of 60–80 cm and that the subsoils contain less decomposed material than the surface layers unlike most peats in temperate regions. This may explain the absence of woody layer near the surface, i.e. normalized depth < 0.1 (Figure 2), and the negative correlation coefficients between the variables of normalized peat depth and CDV within the most of the peat-
262 land types, although the correlation was not significant (P > 0.05) except for riverine peatland. Volumetric carbon density of terrace peatland in relation to the geomorphic history From the topographic characteristics of each peatland type (Table 1, Table 2), the peatlands stretch continuously from Java Sea thorough coastal, marginal to basin/domed and terrace peatland toward ca. 100 km inland of Kalimantan (Figure 6). Sieffermann et al. (1988) reported the existence of high peatland, developed on podzolic terraces and formed earlier (ca. 10000– 5000 before present: BP) than the other peatlands (ca. 6000–2000 BP; i.e. after the Daly’s transgression) that were described by e.g. Andriesse (1974), Tejoyuwono (1979), and Anderson (1983). This type of peatlands developed on white sandbars was also described in Brunei (Furukawa 1988; Bruenig 1990) or Sumatra (Furukawa 1994). High peatlands occur in low altitude watershed positions (10–30 m a.s.l.) between major river systems (Rieley et al. 1996). These topographic characteristics of high peatlands coincide with those of terrace peatland (Table 1), although the distribution of high peatlands does not match completely with the map (Figure 1) of terrace peatlands (cf. Sieffermann et al. 1988). However, the sampling plots of Marang, PK3, Petukketimpun and Hampangen are within the high peatland area (cf. Sieffermann et al. 1988), the sampled cores of terrace peatland in this study might reflect the characteristics of older peats. Sieffermann et al. (1988) indicated that these old terrace peat deposits stopped accumulating ca. between 5000–2500 BP and are in the process of decomposition. Hence, the C consolidation from the longer decomposition period may attribute to the greater CDV value of terrace peatland. On the other hand, the better drainage of the terrace peatlands, from their higher topographic position and higher permeability of mineral subsoils, may be another possibility of the higher CDV (cf. Minkkinen & Laine 1998). However, no differences in the structure of the peat dome, the slope, and the water table (cf. Rieley et al. 1996; Takahashi & Yonetani 1997) between terrace peatlands and the other ombrogenous peatlands have been found, so the effect of longer anaerobic decomposition seems to be more acceptable reason for the higher CDV value of terrace peats. Estimating volumetric carbon density from geographic factors The main objective of this study was to estimate the variability of tropical peat CDV in Central Kalimantan. For this purpose, geographic factors that might relate to the CDV value were used as variables for a step-wise multiple regression analysis (Table 4). The most important geographic variable was
263
Figure 6. Schematic model for longitudinal section of Central Kalimantan (modified from: Sieffermann 1990) superimposed by the distribution of peatland types (cf. Table 1).
altitude of the peat layer, which derived by subtracting the depth of sampling peat layer from the elevation of the location, within one area of combined category of peatland types and land cover types, which were included as dummy variables in the model. Negative coefficient of the variable of distance from river agrees with the fact that lower value of BD near the top of peat dome (e.g. Driessen & Rochimah), which develop between rivers. It is clear from the regression model that decision of peatland type is the most important factor in estimating CDV . Decision of land cover type is also found to be an important factor to estimate CDV value. The reason for this is probably that differences in vegetation is a good indicator for the CDV differences due to the mineral richness and increase of effective capillary pore system from TPS increase (Päivänen 1976). In this study, land cover types classified by the remotely sensed data were used as an index of the vegetation differences. Although the verification of the land cover type by the ground truth data could not be done, we found that the CDV differs among vegetation types as well as peatland types. The regression model (Table 4) can explain 54% of the variability in the value of CDV . However, the model cannot predict the woody layers in terrace (16% frequency) and floodplain (12% frequency) peatland. If all the woody layers are included for the step-wise regression model, coefficient of determination (r 2 ) would by down be 44.9% (or, with adjusted r 2 statistics, 41.0%).
264 Acknowledgements We would like to thank Suwido H. Limin of University of Palangka Raya, Jack O. Rieley, Ph.D. of Nottingham University, Susan E. Page, Ph.D. of University of Leicester, Eiji Suzuki, Ph.D. of Kagoshima University, and Herwint Simbolon, Ph.D. of LIPI (the Indonesian Institute of Science) for advice on field collection; Tsutomu Suzuki of JICA (Japan International Cooperation Agency) specialist for support on purchasing maps from BAKOSURTANAL (National Coordination Agency for Surveys and Mapping, Indonesia); and Sandra G. Neuzil, Ph.D. of U.S. Geological Survey for valuable comments on the manuscripts. We also would like to thank staff of CIMTROP of University of Palangka Raya for support during field collection. This study was conducted as a part of the Core University Program between Hokkaido University and R & D Center of Biology, LIPI as the title ‘Environmental Conservation and Land Use Management of Wetland Ecosystem in Southeast Asia’, which supported by JSPS (Japan Society for the Promotion of Science).
References Abdullah TS (1997) Tanah gambut – Genesis, Klasifikasi, Karakteristik, Penggunaan, Kendala dan Penyebarannya di Indonesia (Indonesian), Jurusan Tanah, Fukultas Pertanian, Institut Pertanian Bogor Anderson JAR (1964) The structure and development of the swamp of Sarawak and Brunei. Journal of Tropical Geography 18: 7–16 Anderson JAR & Muller J (1975) Palynological study of a Holocene peat and a Miocene coal deposit from NW Borneo. Review of Palaeobitany and Palynology 19: 291–351 Anderson, JAR (1976) Observations on the ecology of five peat swamp forests in Sumatra and Kalimantan. In: Peat and Podzolic Soils and their Potential for Agriculture in Indonesia (pp 45–55). Soil Research Institute, Bogor, Indonesia, Bulletin No. 3 Anderson JAR (1983) The tropical peat swamps of western Malaysia. In: Mires, Swamp, Bog, Fen and Moor, Ecosystem of the World 4B (pp 181–199). Elsevier, Amsterdam Andriesse JP (1974) Tropical lowland peats in South-East Asia. Dep. Agric. Res., R. Trop. Inst., Amsterdam, Commum. 63 Andriesse JP (1988) Nature and Management of Tropical Peat Soils. FAO Soils Bulletin 59. Food and Agriculture Organization of the United Nations, Rome, Italy Asdak C (1995) Rainfall interception loss of tropical forest of Central Kalimantan (Part 1). The Indonesian Journal of Geography 27(70): 27–36 BAKOSURTANAL (1997) Peta rupabumi Indonesia 1: 50000, National Coordination Agency for Surveys and Mapping BAPPEDA (1993) Tim penyusunan data pokok pembangunan 1992/1993. Propinci daerah tingkat1 , Kalimantan Tengah Boerema J (1931) Rainfall in the Netherlands Indies. Koninklijk Magnetisch en Meteorologisch Observatorium te Batavia 1(25): 244
265 Botch MS, Kobak KI, Vinson TS & Kolchugina TP (1995) Carbon pools and accumulation in peatlands of the former Soviet Union. Global Biogeochemical Cycles 9(1): 37–46 Brown S & Lugo AE (1990) Effect of forest clearing and succession on the carbon and nitrogen content of soils in Puerto Rico and US Virgin Islands. Plant and Soil 124: 53–64 Bruenig EF (1990) Oligotrophic forested wetlands in Borneo. In: Lugo AE, Brinson M & Brown S (Eds) Ecosystems of The World 15 (pp 299–334), Forested Wetlands, Elsevier Driessen PM & Rochimah L (1976) The physical properties of lowland peats from Kalimantan, Indonesia. In: Peat and Podzolic Soils and their Potential for Agriculture in Indonesia (pp 56–73). Soil Research Institute, Bogor, Indonesia, Bulletin No. 3 Driessen PM, Buurman P & Permadhy (1976) The influence of shifting cultivation on a ‘podzolic’ soil from Central Kalimantan. In: Peat and Podzolic Soils and their Potential for Agriculture in Indonesia (pp 95–115). Soil Research Institute, Bogor, Indonesia, Bulletin No. 3 Eidenshink JC & Faundeen JL (1994) The 1 km AVHRR global land data set: first stage in implementation. International Journal of Remote Sensing 15(17): 3443–3462 ESRI (1993) The Digital Chart of the World for Use with ARC/INFOr Software from ESRI, Redlands, CA Foody GM, Boyd DS & Curran, PJ (1996) Relations between tropical forest biophysical properties and data acquired in AVHRR channels 1–5. International Journal of Remote Sensing 17(7): 1341–1355 Furukawa H (1988) Stratigraphic and geomorphic studies of peat and giant podzols in Burnei: 1. Peat. Pedologist 32(1): 26–42 Furukawa H (1994) Coastal Wetlands of Indonesia: Environment, Subsistence and Exploitation. Kyoto University Press, Japan Gorham E (1991) Northern Peatlands: Role in the carbon cycle and probable responses to climatic warning. Ecological Applications 1(2): 182–195 Howard PJA, Loveland PJ, Bradley RI, Dry FT, Howard DM & Howard DC (1995) The carbon content of soil and its geographical distribution in Great Britain. Soil Use and Management 11: 9–15 Immirzi P & Maltby E with Clymo RS (1992) The Global Status of Peatlands and their Role in Carbon Cycling. Report No. 11, The Wetland Ecosystems Research Group, University of Exeter, UK Lambin EF & Ehrlich D (1995) Combining vegetation indices and surface temperature for land-cover mapping at broad spatial scales. International Journal of Remote Sensing 16(3): 573–579 Liski J & Westman CJ (1995) Density of organic carbon in soil at coniferous forest sites in southern Finland. Biogeochemistry 29: 183–197 Maltby E., Immirzi CP (1996) Introduction: The sustainable utilisation of tropical peatlands. In: Proceedings of a Workshop on Integrated Planning and Management of Tropical Lowland Peatlands (pp 1–14). Tropical Lowland Peatlands of Southeast Asia, IUCN Man JK (1986) Changes in soil carbon storage after cultivation. Soil Science 142(5): 279–288 Moore TA & Hilbert RE (1992) Petrographic and anatomical characteristics of plant material from two peat deposits of Holocene and Miocene age, Kalimantan, Indonesia. Review of Palaeobotany and Palynology 72: 199–227 Moore TA, Shearer JC & Miller SL (1996) Fungal origin of oxidised plant material in the Palangkaraya peat deposit, Kalimantan Tengah, Indonesia: Impactions for ‘inertinite’ formatoin in coal. International Journal of Coal Geology 30: 1–23 Minkkinen K & Laine J (1998) Long-term effect of forest drainage on the peat carbon stores of pine mires in Finland. Canadian Journal of Forest Research 28: 1267–1275
266 Nemani R, Pierce L & Running S (1993) Developing satellite-derived estimates of surface moisture status. Journal of Applied Meteorology 32: 548–557 Neuzil SG, Supardi, Cecil CB, Kane JS & Soedjono K (1993) Inorganic geochemistry of domed peat in Indonesia and its implication for the origin of mineral matter in coal. In: Modern and Ancient Coal-Forming Environments (pp 23–44). Geological Society of America Special Paper 286 Neuzil SG (1997) Onset and rate of peat and carbon accumulation in four domed ombrogenous peat deposits, Indonesia. In: Rieley JO & Page SE (Eds) Biodiversity and Sustainability of Tropical peatlands (pp 55–72). Samara Publishing Limited, Cardigan Page SE & Rieley JO (1998) Executive summary: Field research programme 1996/1997. Report to the South-east Asian Rainforest Research Committee of the Royal Society. Kalimantan Peat Swamp Forest Research Project, Universities of Nottingham, Leicester and Palangka Raya Päivänen J (1976) Bulk density as a factor describing other physical properties of peat. In: Transactions of the Working Group for Classification of Peat (pp 40–45). Helsinki Parton WJ, Schimel DS, Cole CV & Ojima DS (1987) Analysis of factors controlling soil organic matter levels in Great Plains Grassland. Soil Science Society of America Journal 51: 1173–1179 RePPProT (1985) Land systems and land suitability series at 1:250 000 scale. Accompanying Maps of Review of Phase 1B Results, Central Kalimantan. Regional Physical Planning Programme for Transmigration. UK Overseas Development Administration and Directorate Bina Program. Jakarta, Ministry of Transmigration RePPProT (1990) A national overview from the regional physical planning programme for transmigration. UK Overseas Development Administration and Directorate Bina Program. Jakarta, Ministry of Transmigration Rieley JO, Sieffermann RG & Page SE (1992) The origin, development, present status and importance of the lowland peat swamp forests of Borneo. Suo 43: 241–244 Rieley JO, Ahmad-Shah AA & Brady MA (1996) The extent and nature of tropical peat swamps. In: Proceedings of a Workshop on Integrated Planning and Management of Tropical Lowland Peatlands (pp 17–53). Tropical Lowland Peatlands of Southeast Asia Rieley JO & Ahmad-Shah AA (1996) The vegetation of tropical peat swamp forests. In: Proceedings of a Workshop on Integrated Planning and Management of Tropical Lowland Peatlands (pp 55–73). Tropical Lowland Peatlands of Southeast Asia Robinson SD & Moore TR (1999) Carbon and peat accumulation over the past 1200 years in a landscape with discontinuous permafrost, northwestern Canada. Global Biogeochemical Cycles 13(2): 591–601 Shepherd PA, Rieley JO & Page SE (1997) The relationship between forest vegetation and peat characteristics in the upper catchment of Sungai Sebangau, Central Kalimantan. In: Rieley JO & Page SE (Eds) Biodiversity and Sustainability of Tropical Peatland (pp 191–210). Samara Publishing Limited Sieffermann RG, Fournier M, Triutomo S, Sadelman MT & Semah AM (1988) Velocity of tropical peat accumulation in Central Kalimantan Province, Indonesia (Borneo). In: Proceedings of the 8th International Peat Congress (pp 90–98). Leningrad 1 Sieffermann RG (1990) Origin of iron carbonate layers in Tertiary coastal sediments of Central Kalimantan Province (Borneo), Indonesia. Spec. Publs int. Ass. Sediment. 11: 139–146 Sorensen KW (1993) Indonesian peat swamp forests and their role as a carbon sink. Chemosphere 27(6): 1065–1082
267 Suhardjo H & Widjaja-Adhi (1976) Chemical characteristics of the upper 30 cms of peat soil from Riau. In: Peat and Podzolic Soils and their Potential for Agriculture in Indonesia (pp 74–92). Soil Research Institute, Bogor, Indonesia, Bulletin No. 3 Subagjo & Driessen PM (1974) The ombrogenous peats in Indonesia. In: Agricultural Cooperation Research Reports (pp 193–205). Indonesia-the Netherlands Supardi, Subekty AD & Neuzil SG (1993) General geology and peat resources of the Siak Kanan and Bengkalis Island peat deposits, Sumatra, Indonesia. In: Modern and Ancient Coal-Forming Environments. Geological Society of America Special Paper 286 (pp 45– 62) Scheffé H (1953) A method for judging all contrasts in the analysis of variance. Biometrika 40: 87–104 Suzuki E, Kohyama H, Simbolon H, Haraguchi A, Tsuyuzaki S & Nishimura T (1998) Vegetation of kerangas and peat swamp forests in Lahei, Central Kalimantan. In: Environmental conservation and land use management of wetland ecosystem in Southeast Asia (pp 3–4). Hokkaido University, Japan Takahashi H & Yonetani Y (1997) Studies on microclimate and hydrology of peat swamp forest in Central Kalimantan. In: Rieley JO & Page SE (Eds) Biodiversity and Sustainability of Tropical peatlands (pp 179–187). Samara Publishing Limited, Cardigan Tejoyuwono N (1979) Peat deposition, an idle stage in the natural cycling of nitrogen, and its possible activation for agriculture. In: Nitrogen cycling in South-East Asian wet monsoonal Ecosystems (pp 139–147), Canberra, Australian Academy of Science, 1981 Tou JT & Gonzales RC (1974) Pattern Recognition Principles. Addison-Weley, Reading, MA, 377 pp van Dam D, Veldkamp E & van Breemen N (1997) Soil organic carbon dynamics: variety with depth in forested and deforested soils under pasture in Costa Rica. Biogeochemistry 39: 343–375 Vijarnsorn P (1986) Distribution, properties and classification of histosols in Thailand. In: Eswaran H, Panichapong S, Bachik AT & Chitchumnoug T (Eds) Classification, characterization and utilization of peat land. Proceedings of 2nd International Soil Management workshop (pp 69–81). DLD, Thailand Yonebayashi K, Okazaki M & Pechayapisit J (1992) Woody fragments in tropical peat soils. In: Kuyma K, Vijarnsorn P & Zakaria A (Eds) Coastal Lowland Ecosystems in Southern Thailand and Malaysia, V-4 (pp 233–247)