Utah State University
DigitalCommons@USU All Graduate Theses and Dissertations
Graduate Studies, School of
8-1-2011
The decline and conservation status of North American bumble bees Jonathan B. Koch Utah State University
Recommended Citation Koch, Jonathan B., "The decline and conservation status of North American bumble bees" (2011). All Graduate Theses and Dissertations. Paper 1015. http://digitalcommons.usu.edu/etd/1015
This Thesis is brought to you for free and open access by the Graduate Studies, School of at DigitalCommons@USU. It has been accepted for inclusion in All Graduate Theses and Dissertations by an authorized administrator of DigitalCommons@USU. For more information, please contact
[email protected].
THE DECLINE AND CONSERVATION STATUS OF NORTH AMERICAN BUMBLE BEES
by
Jonathan Berenguer Koch A thesis submitted in partial fulfillment of the requirements for the degree of MASTER OF SCIENCE in Biology
Approved: ________________________ Dr. James P. Pitts Major Professor
________________________ Dr. James P. Strange Committee Member
________________________ Dr. David N. Koons Committee Member
________________________ Dr. Byron R. Burnham Dean of Graduate Studies
UTAH STATE UNIVERSITY Logan, Utah 2011
ii
Copyright © Jonathan Berenguer Koch 2011 All Rights Reserved
iii ABSTRACT
The decline and conservation status of North American bumble bees
by
Jonathan Berenguer Koch, Master of Science Utah State University, 2011
Major Professor: Dr. James P. Pitts Department: Biology
Several reports of North American bumble bee (Bombus Latreille) decline have been documented across the continent, but no study has fully assessed the geographic scope of decline. In this study I discuss the importance of Natural History Collections (NHC) in estimating historic bumble bee distributions and abundances, as well as in informing current surveys. To estimate changes in distribution and relative abundance I compare historic data assembled from a >73,000 specimen database with a contemporary 3-year survey of North American bumble bees across 382 locations in the contiguous U.S.A. Based on my results, four historically abundant bumble bees, B. affinis, B. occidentalis, B. pensylvanicus and B. terricola, have declined by 72 - 96% relative abundance across their native distribution, while B. bifarius, B. bimaculatus, B. impatiens, and B. vosnesenskii appear to be relatively stable. Finally, I provide some notes on the distribution, abundance, and frequency of Nosema bombi infections in Alaskan B. occidentalis. (133 pages)
iv FRONTISPIECE
v ACKNOWLEDGMENTS
I would first like to thank Jamie Strange and Terry Griswold for taking on a student whose first encounter with the somewhat daunting bumble bees was a little over two years ago. I am thankful for the opportunity to conduct research in some of the most amazing places in North America. I would also like to thank the primary investigators of the USDA CSREES-NRI grant #2007-02274 which provided the funding opportunity for me to study at Utah State University: Sydney Cameron (University of Illinois, UrbanaChampaign), Lee Solter (Illinois Natural History Survey), Jamie Strange (USDA-ARS PIRU), and Terry Griswold (USDA-ARS PIRU). I am especially grateful to Joyce Knoblett, Harold Ikerd, Leah Lewis, and Daniel Young at the Bee Lab for providing the crucial technical support and database assistance. Without your patience and charisma, this project would have never come to fruition. I would like to extend a special thank you to the many museum curators and managers who provided lab space on my museum visits, electronic databases and time to carefully ship hundreds, sometimes thousands of specimens for me to database: Jason Weintraub (Academy of Natural Sciences), John Ascher (American Museum of Natural History), Sheperd Myer (Bernice Pauahi Bishop Museum), Kimberly Huntzinger and Sean Clark (Brigham Young University), Norm Penny and Vince Lee (California Academy of Sciences), William H. Clark (The College of Idaho), Christopher Marshall (Oregon State University), Pamela Horsley (San Diego Natural History Museum), Dr. Marshal Hedin (San Diego State University), Sèan Brady and David Furth (Smithsonian Institution), Paul Johnson (South Dakota State University), Cheryl Barr and Robert Zuparko (University of California-Berkeley), Robbin Thorp and Steve Heydon
vi (University of California- Davis), Frank Merickel (University of Idaho), Steven Krauth (University of Wisconsin), Richard Zack (Washington State University), and Lawrence Gall (Yale University). I thank James Pitts and David Koons for providing thoughtful comments, insight, and support throughout my thesis; and Terry Griswold for providing stimulating conversation about bee biology and natural history. I especially thank Robbin Thorp for sharing his wealth of bumble bee knowledge, life experiences, and hospitality as I poured over the thousands of specimens housed at the Bohart museum at the University of California in Davis, CA. Without his > 40 years of expertise, the bumble bee community would not be what it is today. Finally, I will be forever indebted to my hānai family of Logan, Utah for their friendship, support, and the push to succeed. My sincerest aloha.
Jonathan B. Koch
vii
CONTENTS Page ABSTRACT ....................................................................................................................... iii FRONTISPIECE ................................................................................................................ iv ACKNOWLEDGMENTS ...................................................................................................v LIST OF TABLES ............................................................................................................. ix LIST OF FIGURES .............................................................................................................x CHAPTER I.
INTRODUCTION .............................................................................................1 Thesis Description .......................................................................................1 Background ..................................................................................................1 Bumble Bee Decline in North America .......................................................4 Thesis Outline ..............................................................................................5 Literature Cited ............................................................................................7
II.
CONSTRUCTING A RELATIONAL DATABASE AND SPECIES DISTRIBUTION MODELS OF NORTH AMERICAN BUMBLE BEES (BOMBUS LATREILLE) TO INFORM CONSERVATION DECISIONS AND MONITORING EFFORTS ....................................................................11 Abstract ......................................................................................................11 Introduction ................................................................................................12 Bombus sensu stricto: Description and Biology ............................14 Bombus affinis, the Rusty Patch Bumble Bee ................................15 Bombus terricola, the Yellow Banded Bumble Bee ......................16 Bombus franklini, Franklin’s Bumble Bee.....................................16 Bombus occidentalis, the Western Bumble Bee ............................17 Materials and Methods ...............................................................................18 Results ........................................................................................................24 Discussion ..................................................................................................30 Conclusion .................................................................................................36 Literature Cited ..........................................................................................37
III.
A STATUS SNAPSHOT OF BUMBLE BEE (BOMBUS) COMMUNITIES IN THE ALASKA INTERIOR WITH A SPECIAL FOCUS ON NOSEMA BOMBI PREVELANCE IN B. OCCIDENTALIS AND B. MODERATUS .....42
viii Abstract ......................................................................................................42 Introduction ................................................................................................42 Methods......................................................................................................45 Pathogen Load Analysis ................................................................45 Species Distribution Models ..........................................................46 Results ........................................................................................................47 Pathogen Load Analysis ................................................................47 Species Distribution Models ..........................................................49 Discussion ..................................................................................................51 Literature Cited ..........................................................................................55 IV.
SUMMARY AND CONCLUSIONS ..............................................................58
APPENDICES ...................................................................................................................61 Appendix A ................................................................................................62 Appendix B ................................................................................................64 Appendix C ................................................................................................67 Appendix D ................................................................................................96 Appendix E ..............................................................................................123 Appendix F...............................................................................................128 Appendix G ..............................................................................................130 Appendix H ..............................................................................................132
ix
LIST OF TABLES Table
Page
2-1
Bombus occidentalis NHC digitization summary ..............................................................21
2-2
Worldclim bioclimatic variables utilized in SDM construction ........................................22
3-1
Alaskan bumble bee community composition ...................................................................48
x
LIST OF FIGURES Figure
Page
1-1
Shaded distribution map of bumble bee study species ........................................................5
2-1
Focal study species of the subgenus Bombus sensu stricto................................................15
2-2
Range maps of Bombus affinis...........................................................................................25
2-3
Bombus affinis habitat suitability delineation summary ....................................................26
2-4
Range maps of Bombus terricola .......................................................................................27
2-5
Bombus terricola habitat suitability delineation summary ................................................28
2-6
Range maps of Bombus franklini .......................................................................................28
2-7
Bombus franklini habitat suitability delineation summary ...............................................29
2-8
Shaded range map of Bombus occidentalis .......................................................................30
2-9
Bombus occidentalis species distribution models across NHC .........................................31
2-10
Bombus occidentalis habitat suitability delineation summary ...........................................33
4-1
Nosema bombi prevalence across Alaskan bumble bees ...................................................50
4-2
Potential distribution of Bombus moderatus and B. occidentalis in Alaska ......................51
C-1
Digitization summary map of bumble bee database effort ................................................81
C-2
Summary map of current bumble bee survey ...................................................................81
C-3
Current relative abundance of study bumble bee fauna and underlying probable distribution based on species distribution modeling techniques ........................................83
C-4
Four regional comparisons of bumble bee relative abundance ..........................................84
C-5
Regional temporal trend comparisons of bumble bee relative abundance ........................85
C-6
Probability of persistence (P) of study bumble bee fauna across ecoregions in the contiguous U.S.A. .............................................................................................................88
1 CHAPTER 1 INTRODUCTION
Thesis Description Reports of North American bumble bee (Bombus Latreille) decline have been documented across the continent, but no study has fully assessed the geographic scope of decline. In this thesis natural history collections (NHC) and current survey data are applied to broadly assess the conservation status of several bumble bee species in the U.S.A. Bumble bee species speculated to be declining in range or abundance (B. affinis Cresson, B. franklini Frison, B. occidentalis Greene, B. terricola Kirby, and B. pensylvanicus DeGeer), and species presumed to be maintaining robust population numbers (B. bifarius Cresson, B. bimaculatus Cresson, B. impatiens Cresson, B. moderatus Cresson, and B. vosnesenskii Radoszkowski) are investigated. The results suggest that the species speculated to be declining have significantly decreased in relative abundance from historic numbers, whereas the five presumptive stable species appear to not be threatened and are well detected across their native range. Declining species are associated with low extantness probabilities across the ecoregions of their known historic ranges, whereas stable species are associated with high extantness probabilities. The study concludes with a novel assessment of the pathogen densities of Nosema bombi associated with B. occidentalis and its sister species B. moderatus in the Alaskan Interior.
Background Bumble bees (Bombus Latreille) are conspicuous bee pollinators, notably due to their robust, furry and brightly colored appearance (Thorp et al. 1983, Williams 1998). They are
2 documented to pollinate numerous wildflower species (Allen-Wardell et al. 1998), as well as economically important food crops like tomatoes, peppers, and blueberries (Velthuis & van Doorn 2006). Like many other genera of bee, Bombus have successfully invaded and evolved in several different biomes including deserts, tundra, grasslands and forests (Heinrich 1979, Williams 1998, Cameron et al. 2007, Hines 2008). Globally, there are approximately 250 species of extant bumble bee, of which 50 species are native to North America (Williams 1998, Cameron et al. 2007, Hines 2008). Worldwide, at least five bumble bee species have been reared commercially with estimated sales at $70.2 million (USD) per year to deliver pollination services to at least 20 different food crops (Velthuis & van Doorn 2006). In fact, 95% of commercially reared bumble bees are responsible for assisting in the pollination of approximately 40,000 ha of green house tomato crops (Lycopersicon esculentum), an agricultural product valued at $15.4 trillion (USD) annually (Velthuis & van Doorn 2006). However, despite the pollination services provided by bumble bees in both wild and managed environments, several species have been documented to be experiencing precipitous declines and localized extinction (Evans et al. 2008, Goulson et al. 2008). The extinction of bumble bee species may result in the loss of critical pollination services to flowering plants across different ecosystems, possibly facilitating an extinction vortex between pollinator and plant (Bond 1994, Kearns et al. 1998, Allen-Wardell et al. 1998, Goulson et al. 2008). To date, numerous studies have documented bumble bee decline at both broad and narrow spatial and temporal scales (Williams 1986, Tommasi et al. 2004, Thorp 2005, Thorp & Shepherd 2005, McFrederick & Lebuhn 2006, Kosier et al. 2007, Colla & Packer 2008, Grixti et al. 2009, Lozier & Cameron 2009). For example, of the 25
3 bumble bee species historically present in the United Kingdom, three species have gone extinct while eight species have experienced range contraction from areas where they frequently occurred (Goulson 2003). Furthermore, a study in western and central Europe documented localized extinction of 13 bumble bee species across multiple countries, of which four species are expected to have gone completely extinct (Kosier et al. 2007). Although some studies have identified the probable cause of localized bumble bee decline (Williams et al. 2007, Grixti et al. 2009), many also remain speculative (Thorp 2003, 2005, Colla & Packer 2008, Evans et al. 2008). The causes of bumble bee declines in both Europe and North America are attributed to four prevailing hypotheses: climate change, urbanization, agricultural intensification and pathogen pressure (Williams 1986, Goka et al. 2001, Colla et al. 2006, Goulson et al. 2008). The validity of these competing hypotheses is subject to both the species in question, as well as the region in which they occur (Williams 1986, Goulson et al. 2008). In the United Kingdom, agricultural intensification is the presumed causal factor for the decline of longtongued bumble bees (Williams et al. 2007), as they are dependent on perennial flowers with long corollas to provide nectar (Rasmont 1988). In Western Europe, the range of two bumble bee species, B. distinguendus and B. sylvarum have been documented to have shifted due to northern and southern contractions of their bioclimatic niche (Williams et al. 2007). In San Francisco, California, U.S.A. a decrease in bumble bee community richness over time is correlated with increased urbanization (McFrederick & Lebuhn 2006). Furthermore Colla et al. (2006) and Otterstatter & Thompson (2008) document and model the potential for commercially reared bumble bees to horizontally transmit pathogens to wild populations of congenerics, respectively.
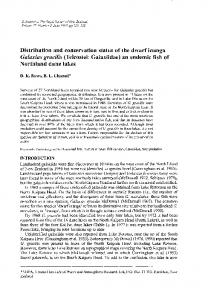
4 Bumble Bee Decline in North America North American bumble bee declines were first observed in the late 1990s when populations of the commercially reared B. occidentalis collapsed in rearing facilities due to a pathogen outbreak (Evans et al. 2008, Goulson et al. 2008). Since the collapse, commercial production of B. occidentalis has been abandoned, and speculation arouse regarding the possibility that North American bumble bees, including wild populations of B. occidentalis have been exposed to a novel pathogen via horizontal transmission (Thorp & Shepherd 2005, Otterstatter & Thomson 2008). In academic circles there has been great speculation that pathogen pressure is the main causal agent of North American bumble bee decline (Colla et al. 2006, Committee on the Status of Pollinators in North America 2007, Otterstatter & Thomson 2008). Considering the possibility that transmission of a novel pathogen from commercial B. occidentalis to wild populations of bumble bees may have taken place (Goka et al. 2001, Colla et al. 2006, Otterstatter & Thomson 2008), it is ecologically pressing to document the geographic extent of decline in possibly imperiled bumble bee fauna. Along with B. occidentalis, the North American bumble bee species considered threatened include B. affinis, B. franklini, B. terricola, and B. pensylvanicus (Thorp 2005, Colla et al. 2006, Evans et al. 2008). The former four species are of the subgenus Bombus sensu stricto while the latter species is of the subgenus Thoracobombus. With the exception of the narrowly distributed B. franklini, these species are distributed across a broad range of environments throughout the North American continent (Milliron 1971, see Chapter 2). Several publications and anecdotal reports suggest that the bumble bee species experiencing decline were once widely distributed in North America (Figure 1-1; Thorp & Shepherd 2005, Evans et al. 2008). However, documentation of historic abundance data is generally
5 0restricted to narrow ecological studies that are usually oriented towards the study of pollination ecology (e.g. Macior 1982, Pyke 1982) and not interested specifically in bumble bee communities (but see Bowers 1985). A
B
C
D
E
F
G
H
I
J
Figure 1-1. Traditional shaded-distribution maps of the focal bumble bee taxa in the present study. Western species: (A) B. franklini, (B) B. bifarius, (C) B. occidentalis, (D) B. moderatus and (E) B. vosnesenskii. Eastern species: (F) B. affinis, (G) B. bimaculatus, (H) B. impatiens, (I) B. pensylvanicus and (J) B. terricola (Thorp et al. 1983, Milliron 1971; G and H adapted from Kearns & Thomson 2001).
Thesis Outline Chapter 2 reviews the status of four bumble bee species of the subgenus Bombus s. str. in North America (B. affinis, B. franklini, B. occidentalis, and B. terricola) by applying species distribution modeling (SDM) techniques to determine their respective probable distribution. These models demonstrates the importance of expanding a relational database from multiple natural history collections (NHC) to improve the resolution of a SDM by using the species B. occidentalis as a model taxon. The results suggest that an updatable relational database, and in turn, an updatable SDM are useful when facilitating monitoring programs for at risk species. Chapter 2 has been published in part as Koch & Strange (2009).
6 Chapter 3 is a novel assessment on the population health of five bumble bee communities in the Alaskan Interior. These five communities were chosen as they had a good representation of both B. occidentalis, and its sister species B. moderatus individuals. These species are of particular interest as bumble bees of the subgenus Bombus s. str. appear to be experiencing precipitous decline in the contiguous U.S.A., and virtually nothing is known of bumble bee pathogen loads in Alaska or the current status of B. moderatus. All bumble bees detected within the standardized survey are screened for N. bombi, an obligate intracellular microsporidium associated with bumble bees. Appendix C reports (1) a summary of the largest relational North American bumble bee database, (2) SDM for nine bumble bee species in the contiguous U.S.A. (western U.S.A.: B. bifarius, B. occidentalis, B. vosnesenskii; eastern U.S.A.: B. affinis, B. bimaculatus, B. impatiens, B. pensylvanicus, B. terricola) and (3) their respective conservation status based on a comparison of NHC data and current standardized survey efforts. Historical specimen data from multiple NHC and available databases were digitized and stored in a relational database in Logan, Utah, U.S.A. To determine the bioclimatic profile associated with each species, several SDM are constructed by aggregating georeferenced NHC data with a suite of abiotic variables. SDM are then projected on to geographic space to characterize areas of habitat suitability for each species. SDM and NHC data are then used to inform current, standardized survey efforts across the U.S.A. Relative abundance data from current surveys are then compared to data compiled from NHC to determine whether a decrease from historic population abundance took place. The conservation status of all the focal bumble bee species are quantified in the contiguous U.S.A. by applying over 100 years of NHC data and current survey efforts. Finally, a
7 discussion on the implications of this study on future directions in bumble bee conservation and management in the U.S.A. is presented. Appendix C has been published in part as Cameron et al. (2011). Figures C-1 to C-5 are published in Cameron et al. (2011) along with results of the SDMs, NHC digitization effort and regional comparisons of relative abundance. Appendices D and E are also published in Cameron et al. (2011). Figure C-6 is a novel analysis not published in Cameron et al. (2011). The introduction and discussion of Appendix C are unique to this thesis, whereas the methods and results are published in part in Cameron et al. (2011). Appendix H are updated maps of western surveys conducted in 2010 and is not published in Cameron et al. (2011). Paper and citation format of Appendix C follows the submission requirements of Proceedings of the National Academy of Sciences USA. While I am not the primary author, Cameron et al. (2011) would not have been accomplished without my invaluable contributions of data basing, specimen curation, survey time, statistical analysis and species distribution modeling.
Literature Cited Allen-Wardell, G., Bernhardt, P., Bitner, R., Burquez A., Buchmann, S., Cane, J., Cox, P.A. 1998. The potential consequences of pollinator declines on the conservation of biodiversity and stability of food crop yields. Conservation Biology 12:8-17. Bond, W.J. 1994. Do mutualisms matter? Assessing the impact of pollinator/disperser disruption on plant extinctions. Philosophical Transactions of the Royal Society B. 344: 83-90. Bowers, M.A. 1985. Bumble bee colonization, extinction, and reproduction in subalpine meadows in northeastern Utah. Ecology 66: 914-927. Cameron, S.A., Lozier, J.D., Strange, J.P., Koch, J.B., Cordes, N., Solter, L.F., Griswold, T.L. 2011. Patterns of widespread decline in North American bumble bees. Proceedings of the National Academy of Sciences of the United States of America 108: 662-667.
8 Cameron, S. A., Hines, H.M., Williams, P.H. 2007. A comprehensive phylogeny of the bumble bees (Bombus). Biological Journal of the Linnaean Society 91: 161-188. Colla S.R., Otterstatter M.C., Gegear, R.J., Thomson, J.D. 2006. Plight of the bumble bee: pathogen spillover from commercial to wild populations. Biological Conservation 129: 461467. Colla, S. R., Packer, L. 2008. Evidence for the decline of eastern North American bumble bees, with special focus on Bombus affinis Cresson. Biodiversity and Conservation 17: 13791391. Committee on the Status of Pollinators in North America, National Research Council. 2007. Status of Pollinators in North America (National Academies Press, Washington, DC). Evans, E., Thorp, R., Jepsen, S., Black, S.H. 2008. Status Review of Three Formerly Common Species of Bumble Bee in the Subgenus Bombus: Bombus affinis (the rusty patched bumble bee), B. terricola (the yellow banded bumble bee), and B. occidentalis (the western bumble bee). The Xerces Society of Invertebrate Conservation, Portland, OR. Goka, K., Okabe, K., Yoneda, M., Niwa, S. 2001. Bumble bee commercialization will cause worldwide migration of parasitic mites. Molecular Ecology 10: 2095-2099. Goulson, D. 2003. Bumble bees, Their Behaviour and Ecology. Oxford University Press, Oxford, England. Goulson, D., Lye, G.C., Darvill, B. 2008. Decline and conservation of bumble bees. Annual Review of Entomology 53:191-208. Grixti, J.C., Wong, L.T., Cameron, S.A., Favret, C. 2009. Decline of bumble bees (Bombus) in the North American midwest. Biological Conservation 142: 75-84. Heinrich, B. 1979. Bumble bee Economics. Harvard University Press, Cambridge, MA and London, England. Hines, H.M. 2008. Historical biogeography, divergence times, and diversification patterns in bumble bees (Hymenoptera: Apidae: Bombus). Systematic Biology 571: 58-75. Kearns, C., Inouye, D., Waser, N. 1998. Endangered mutualisms: The conservation of plant pollinator interactions. Annual Review of Ecology, Evolution, and Systematics 29:83-112. Kearns, C., Thomson, J.S. 2001. The natural history of bumble bees: a sourcebook for investigations. University Press of Colorado, Boulder , CO, U.S.A. Kosior, A., Celary, W., Olejniczak, P., Fijat, J., Krol, W., Solarz, W., Plonka, P. 2007. The decline of the bumble bees and cuckoo bees (Hymenoptera: Apidae: Bombini) of western and central Europe. Oryx 41: 79-88.
9 Lozier, J.D., Cameron, S.A. 2009. Comparative genetic analyses of historical and contemporary collections highlight contrasting demographic histories for the bumble bees Bombus pensylvanicus and B. impatiens in Illinois. Molecular Ecology 18: 1875-1886. Macior, L.W. 1982. Plant community and pollinator dynamics in the evolution of pollination mechanisms in Pedicularis (Scrophulariaceae). Pages 29-45 in J.A. Armstrong, J.M. Powell, A.J. Richards, editors. Pollination and evolution. Royal Botanic Gardens, Sydney, Australia. McFrederick, Q.S., LeBuhn, G. 2006. Are urban parks refuges for bumble bees Bombus spp. (Hymenoptera: Apidae)? Biological Conservation 129: 372-382. Milliron, H.E. 1971. A monograph of the western hemisphere bumble bees (Hymenoptera: Apidae; Bombinae) I. The genera Bombus and Megaombombus subgenus Bombias. Memoirs of the Entomological Society of Canada 82: iii- 80. Otterstatter, M.C., Thomson, J.D. 2008. Does pathogen spillover from commercially reared bumble bees threaten wild pollinators? PLoS ONE 3: e2771. Pyke, G. H. 1982. Local geographic distributions of bumble bees near Crested Butte, Colorado: competition and community structure. Ecology 63: 555-573. Rasmont, P. 1988. Monographie écologique et zoogéographique des bourdons de France et de Belgique (Hymenoptera, Apidae, Bombinae). PhD Thesis, Facultédes Sciences Agronomique de l’Etat, Gembloux, Belgium. Thorp, R.W., Horning, D.S. Jr., Dunning, L.L. 1983. Bumble bees and cuckoo bumble bees of California (Hymenoptera: Apidae). Bulletin of California Insect Survey 23, viii-79. Thorp, R.W. 2003. Bumble Bees (Hymenoptera: Apidae): Commercial use and environmental concerns. pp. 21-40. In K. Strickler and J. H. Cane (eds.). For nonnative crops, whence pollinators of the future? Thomas Say Publications in Entomology: Proceedings. Entomological Society of America, Lanham, MD. Thorp, R. 2005. Bombus franklini Frison 1921 Franklin's bumble bee (Hymenoptera: Apidae: Apinae: Bombinae). In Shepherd, M.D. Vaughan, D.M., Black, S.H. (Eds.), Red List of Pollinator Insects of North America. CD-ROM Version 1 (May 2005). The Xerces Society of Invertebrate Conservation, Portland, OR. Thorp, R. W., Shepherd, M. D. 2005. Subgenus Bombus. Latreille, 1802 (Apidae: Apinae: Bombini). In Shepherd, M. D., D. M. Vaughan, and S. H. Black (Eds.) Red List of Pollinator Insects of North America. CD-ROM Version 1 (May 2005). Portland, OR: The Xerces Society for Invertebrate Conservation. www.xerces.org/Pollinator_Red_List/Bees/Bombus_Bombus.pdf Tommasi, D., Miro, A., Higo, H.A., Winston, M.L. 2004. Bee diversity and abundance in an urban setting. The Canadian Entomologist 136: 851-869.
10 Velthuis, H.H.W., van Doorn A. 2006. A century of advances in bumble bee domestication and the economic and environmental aspects of its commercialization for pollination. Apidologie 37: 421-451. Williams, P.H. 1986. Environmental change and the distribution of British bumble bees (Bombus Latr.). Bee World 67: 50-61. Williams, P.H. 1998. An annotated checklist of bumble bees with an analysis of patterns of description (Hymenoptera: Apidae, Bombini). Bulletin of the Natural History Museum, London (Ent.) 67: 79-152. Updated at: www.nhm.ac.uk/research-curation/projects/Bombus/. Williams, P.H., Araujo, M.B., Rasmont, P. 2007. Can vulnerability among British bumble bee Bombus species be explained by niche position and breadth? Biological Conservation 138: 493-505.
11 CHAPTER 2 CONSTRUCTING A RELATIONAL DATABASE AND SPECIES DISTRIBUTION MODELS OF NORTH AMERICAN BUMBLE BEES (BOMBUS LATREILLE) TO INFORM CONSERVATION DECISIONS AND MONITORING EFFORTS1
Abstract Bumble bees (Bombus Latreille) are important pollinators of numerous angiosperms in both wild and managed environments. In the last decade at least six North American bumble bee species have experienced significant range contractions or population declines. A major limitation to studying their decline is a lack of knowledge on historic distribution and abundance. This study reviews the status of four bumble bee species of the subgenus Bombus sensu stricto in North America and applies species distribution modeling (SDM) techniques to determine their respective probable historic distributions. I demonstrate the importance of expanding a relational database from multiple natural history collections (NHC) to improve the resolution of a SDM by using the species B. occidentalis as a model. Changes in the proportion of habitat suitability values (HS) of the B. occidentalis SDM constructed from multiple NHC are significantly different (all p < 0.001) than the values estimated from a SDM constructed with data from a single NHC. For example, there was a 118% increase of suitable habitat at HS = 0.90 when multiple NHCs were applied. The results suggest that an updatable relational database, and in turn, an updatable SDM are useful when determining the types of habitats an at-risk species is associated.
1
This chapter has been published in part in Uludag Bee Journal. Permission has been granted for the reproduction of the work here (Appendix B). Please cite as Koch, J.B. and Strange J.P. 2009. Constructing a species database and historic range maps for North American bumble bees (Bombus sensu stricto Latreille) to inform conservation decisions. Uludag Bee Journal 9(3): 97-108.
12 Introduction Bumble bees (Bombus Latreille) are invaluable pollinators of wild flowers (Kearns et al. 1998) and several food crops such as blueberry (Vaccinium angustifolium), cranberry (Vaccinium macrocarpon), tomato (Solanum lycopersicum) and sweet pepper (Capsicum annuum) (Banda & Paxton 1991, Shipp et al. 1994, Javorek et al. 2002, Cane & Schiffauer 2003). In greenhouse settings, commercially reared bumble bees are better suited, and more efficient than honey bees (Apis mellifera) in facilitating fruit-set (Banda & Paxton 1991). Furthermore, although many bumble bee species are generalist foragers, several genera of wild flower depend exclusively on bumble bees to be pollinated effectively (Macior 1968). Thus the potential loss of pollination services provided by bumble bees may have profound impact on the stability of ecosystems, economic markets and food security (Allen-Wardell et al. 1998, Kearns et al. 1998). To date, several studies have documented range contractions, population declines, decreased community richness and localized extirpations of bumble bee fauna in North America (McFrederick & LeBuhn 2006, Kosier et al. 2007, Colla & Packer 2008, Grixti et al. 2009, Colla & Ratti 2010). While some studies have identified the probable cause of bumble bee decline (e.g. Grixti et al. 2009), others remain speculative (Thorp 2003, Colla & Packer 2008). A review by Goulson et al. (2008) identifies four prevailing hypotheses contributing to global bumble bee decline: climate change, pathogen pressure, urbanization and agricultural intensification (Williams 1986, Colla et al. 2006, McFrederick & LeBuhn 2006, Otterstatter & Thomson 2008, Williams et al. 2007). Of the four hypotheses the latter two are the most intensively documented in both Europe and North America (Goulson et al. 2008). However, pathogen transmission from commercially reared bumble bees to wild
13 conspecifics is currently receiving more research attention in North America (Colla et al. 2006, Otterstatter & Thompson 2008, Gillespie 2010). The decline of North American bumble bees was first observed in the early 1990s (Thorp 2003, 2005, Evans et al. 2008), whereas declines of some European bumble bees has been observed as early as the late 1940s (Williams 1986, Goulson et al. 2008). Although most of the preliminary observations of species decline were anecdotal, recent studies in North America have documented both decreased bumble bee richness and absence of some species where they were once fairly abundant (McFrederick & LeBuhn 2006, Colla & Packer 2008, Grixti et al. 2009, Colla & Ratti 2010). Of the 50 bumble bee species occurring in North America, six species have been identified as declining in abundance and range (Thorp 2005, Colla & Packer 2008, Evans et al. 2008, Goulson et al. 2008, Grixti et al. 2009). Localized extirpations of some of these six bumble bee species are based primarily on correlation and narrow documentation of possible pathogen transmission (Colla et al. 2006, Gillespie 2010). However, the full bioclimatic extent of range contractions of North American bumble bees, particularly those of the subgenus Bombus sensu stricto is not well documented. A major problem confronting conservation biologists is determining the historic range of a species experiencing range contraction (Shaffer et al. 1998, Scott et al. 2002). This appears to be especially true for insects, since many are sessile, have patchy distributions across broad bioclimatic scales and display a great deal of phenological variability. While entomological holdings in natural history collections (NHC) are informative, they rarely have specimen representation of a species across its entire bioclimatic range (Koch & Strange, unpublished data). This is because insect collectors seldom target a single species, but rather
14 often focus on collecting a large diversity of insects. Second, collectors generally survey near the NHC where they deposit their specimens; and when travelling, they are often limited to collecting in areas near major transportation corridors. Third, many NHC usually have unidentified and misidentified specimen holdings. Finally, specimen label data from determined specimens are usually not incorporated into a digitized relational database, and therefore highly inaccessible (reviewed in Soberón et al. 2002, Graham et al. 2004, Vollmar et al. 2010). This study reviews the biology and status of four of the six North American bumble bee species speculated to be declining (Thorp 2005, Colla & Packer 2008, Evans et al. 2008, Goulson et al. 2008). First, species distribution models (SDM) are constructed for each species by aggregating point locality data from NHC to bioclimatic predictor variables in a maximum entropy framework. While traditional shaded-distribution maps are an invaluable first step in determining the extent of a species distribution, they generally provide little ecological meaning on determining the bioclimatic profile and habitat suitability associated with a species. Second, this study demonstrates how the resolution of an SDM can be improved through expansion of a relational database that includes multiple NHC using B. occidentalis as a model.
Bombus sensu stricto: Description and Biology The subgenus Bombus s. str. is represented by 12 species of bumble bee distributed across Europe, Asia and North America (Williams 1998, Cameron et al. 2007, Hines 2008). In North America the subgenus includes the following species: B. affinis, B. franklini, B. moderatus, B. occidentalis and B. terricola. They are short tongue bumble bees and have been documented to forage on flowers with short corollas, and rob nectar from flowers with
15 long corollas (Thorp et al. 1983). With the exception of B. moderatus, for which there is no data to support decline in abundance or range contraction, the North American species of the subgenus are documented to be experiencing decreased abundance in areas where they were relatively once common (Figure 2-1; Thorp 2003, 2005, Colla et al. 2006, McFrederick & LeBuhn 2006, Grixti et al. 2009).
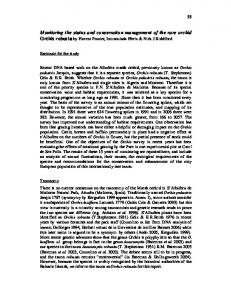
Figure 2-1. Focal study species of the subgenus Bombus sensu stricto. From left: B. affinis, B. franklini, B. occidentalis and B. terricola
Bombus affinis, the rusty patch bumble bee The historic distribution of B. affinis (Figure 2-1) spans the eastern half of North America. In the contiguous U.S.A. historic records are known mostly from the Appalachian Mountains and the prairies of the Midwest (Figure 2-2A; Medler & Carney 1963, Speight 1967). The northern limit of its historic distribution includes southern Ontario, Canada, whereas the southern limit approaches Georgia, U.S.A. (Milliron 1971). Within its historic range, B. affinis is associated with a broad range of habitats including agricultural landscapes, marshes and forests. As a generalist forager, B. affinis has been documented to visit at least 65 genera of plant (Macfarlane 1974), and nectar rob several different species of flowering plant with long corollas (Colla & Packer 2008). Bombus affinis are associated with high colony outputs and have been documented to produce a mean of 1,081 workers/males and 181 queens in a single reproductive season (Macfarlane et al. 1994).
16 Bombus terricola, the yellow-banded bumble bee Similar to B. affinis, the historic distribution of B. terricola (Figure 2-1) includes the eastern half of North America and extends north into Canada (Figure 2-4A; Milliron 1971). While the species occurred along the Appalachian Mountain Crest, it was more abundant in the forests and prairies of Canada and far northern U.S.A. based on published monographs (Milliron 1971). In the southeastern extreme of its range B. terricola appears to be associated with higher elevations (Speight 1967). The western limit of B. terricola includes the eastern portion of Montana, U.S.A., possibly overlapping with the bioclimatic distribution of its sister species B. occidentalis (Milliron 1971, Thorp et al. 1983). It has also been described to be abundant on the northern end of Wisconsin, U.S.A. on the Apostle Islands Seashore (Medler & Carney 1963). Bombus terricola colonies have been documented to produce a mean of 390 workers/males and 32 queens in a single reproductive season (Macfarlane et al. 1994). Bombus franklini, Franklin’s bumble bee Bombus franklini (Figure 2-1) has the smallest bioclimatic range of all Bombus in North America, and arguably the smallest range of all bumble bee species globally (~27,000 km2; Thorp et al. 1983, Williams 1998, Thorp 2005). Historically, B. franklini was found in the northernmost portion of California and southernmost portion of Oregon west of the Sierra-Cascade Crest in the U.S.A. (Figure 2-6A; Thorp et al. 1982, Thorp 2005). This narrow range of B. franklini may have made it more vulnerable to genetic bottlenecks, although the hypothesis was never tested since robust populations have not been detected in the past decade. Bombus franklini has been observed visiting 27 genera of plant across five families (Thorp et al. 1983). Although not much is known about the nesting biology of B.
17 franklini, it has been documented to produce well over 100 individuals per colony (Plowright & Stephen 1980) and is likely to nest in abandoned rodent holes, both common characteristics of the subgenus Bombus s. str. (Hobbs 1968). Historically, B. franklini was treated as conspecific to B. occidentalis (Milliron 1971). However, Plowright & Stephen (1980) describe significant morphological differences in the male genitalia between B. franklini and B. occidentalis, as well as differences in wing venation. Molecular data also support separate species designations (Scholl et al. 1992, Cameron et al. 2007, Bertsch et al. 2010).
Bombus occidentalis, the western bumble bee As both the common and specific name implies, B. occidentalis (Figure 2-1) is distributed in western North America. Its latitudinal distribution includes Alaska, U.S.A. and the Aleutian Archipelago, south to the San Francisco and Sacramento Mountains of Arizona and New Mexico, U.S.A., respectively. The longitudinal distribution of B. occidentalis includes the Pacific coastline to the eastern foothills of the Rocky Mountains (Figure 2-8; Milliron 1971, Thorp et al. 1983). The most eastern distribution of B. occidentalis includes the geographically isolated Black Hills of South Dakota, U.S.A., possibly overlapping with the closely related B. terricola (Figure 2-4A; Milliron 1971). Bombus occidentalis records are typically associated with subalpine meadows, coastlines and high elevation valleys (NPIC 2010). Host plants of B. occidentalis include 661 different species of plant across 21 families and 54 genera (Thorp et al. 1983). Bombus occidentalis is a generalist forager and has been observed nectar robbing by biting holes in flower corollas such as the North American nonnative Linaria vulgaris (J. Koch pers. obs.).
18 Like B. affinis, B. occidentalis are known to produce relatively high colony outputs. The species has been documented to produce a mean of 1,007 workers/males and 146 queens in a single reproductive season (Macfarlane et al. 1994). At various times in the past B. occidentalis was presumed to be a subspecies of B. terricola (Milliron 1971). Although recent molecular evidence distinguishes B. occidentalis and B. terricola as distinct species (Cameron et al. 2007; Bertsch et al. 2010), others continue to treat B. occidentalis as a subspecies of B. terricola (Williams 1998). This review treats B. occidentalis as a unique species because of the treatment it has received based on taxonomic designation (Stephen 1957, Thorp et al. 1983) and molecular data (Cameron et al. 2007; Bertsch et al. 2010).
Materials & Methods To demonstrate the utility of SDM techniques in predicting the probable distribution of a species, two data sets are applied. The first data set was generated by compiling already available specimen locality records from two relational databases: (1) the United States Department of Agriculture- Agricultural Research Service National Pollinating Insect Collection (NPIC) and (2) the Global Biodiversity Information Facility (GBIF) available online at http://gbif.org. NPIC is housed in Logan, Utah U.S.A., and hosts a comprehensive collection of bees from western North America, whereas GBIF is an online repository of locality data for all forms of biodiversity. GBIF was accessed primarily to increase the number of locality records of B. terricola and B. affinis used in the construction of SDMs (Appendix A). To produce the SDMs for B. affinis, B. terricola and B. franklini, 90 (n = 360 specimens), 84 (n= 691 specimens) and 11 (n = 196 specimens) unique localities were applied, respectively. With the exception of B. franklini, the extremely low sample size of B.
19 affinis and B. terricola is an example of the lack of digitized specimen data available. Bombus franklini on the other hand is narrowly distributed naturally (Thorp et al. 1983, Thorp 2005), and thus the small sample size of the species is suggested to be a true representation of its known range. Because B. franklini data is extremely limited, possibly due to its natural distribution and paucity in collection history (two records in NPIC), specimens from the University of California at Davis were data based and included in the construction of its respective SDM. To evaluate the regional bias of NHC across a species distribution a second data set is applied in the construction of an SDM with B. occidentalis as the model species. The data set included a comprehensive digital collection of B. occidentalis specimens from 35 federal and state NHC in North America (Table 2-1). Species identification of B. occidentalis was reevaluated by myself, or a trusted bumble bee taxonomist, and entered into the NPIC relational database. Secondary species identification is necessary as the species status for B. occidentalis varies across bumble bee taxonomist and NHC (see above). For each specimen all metadata associated with the specimen label (e.g. date collected, collector, floral host, etc.) is digitized and related using a unique identifier number. The unique identifier number is printed onto a small label with a barcode and fixed on each specimen to avoid multiple entries. If specific latitude and longitude were not included on the label, localities were estimated with GoogleEarthTM (http://earth.google.com) using any locality information provided by the collector on the specimen label. By including material housed in multiple NHC, B. occidentalis locality records were increased from 764 specimens at NPIC to 9942 total specimens (1201% increase). These 9942 specimens represented 1302 unique localities and were utilized to construct the SDM of
20 B. occidentalis. To investigate the role of NHC in defining the distribution of B. occidentalis three NHC were investigated separately in SDM construction: (1) University of CaliforniaBerkeley (UCB), (2) Washington State University (WSU) and (3) NPIC. These regional collections were selected as they represent three regional categories within the distribution of B. occidentalis (UCB = Pacific West, WSU = Pacific Northwest and NPIC = Intermountain West) in the western U.S.A. Individual SDM for B. occidentalis are constructed for the three NHC and then visually compared to the Global SDM where all NHC are combined. Nineteen bioclimatic variables from the WorldClim 1.3 dataset (Hijmans et al. 2005) were initially explored to construct each bumble bee species SDM at a spatial resolution of 2.5 arc-minutes. To reduce SDM complexity, bioclimatic data associated with each species was evaluated for multicollinearity using pair-wise Pearson’s correlation coefficient r. To maintain uniformity across the three NHC B. occidentalis SDM comparisons, the bioclimatic variables evaluated in the Global B. occidentalis SDM were applied to all B. occidentalis SDM. The bioclimatic variables utilized in the B. affinis, B. terricola and B. franklini SDMs are evaluated separately (Table 2-2). ArcGIS 9.3 (ESRI 2007) was employed to clip all bioclimatic variables to the contiguous U.S.A., as well as process and visualize results from the SDMs constructed with MaxEnt 3.3 beta (Phillips et al. 2006). The modeling algorithm MaxEnt 3.3 beta (MaxEnt) applies entropy to information (data aggregated with a set of constraints) so as to produce a least biased result (model) relative to a probability distribution (Phillips et al. 2006). One limitation of MaxEnt is the need to have representative samples from across a species entire range to determine the most suitable habitat. However, MaxEnt has been tested to produce highly accurate SDM despite small samples sizes (Elith et al. 2007; Wisz et al. 2008). SDMs of the target Bombus are
21 Table 2-1. B. occidentalis specimen digitized across 35 Natural History Collections. Natural History Collection American Museum of Natural History Bernice Pauahi Bishop Museum Brigham Young University California Academy of Sciences College of Idaho Cornell University Harvard University Illinois Natural History Survey Iowa State University Montana State University National Pollination Insect Collection Oklahoma State Oregon State University Academy of Natural Sciences, Philadelphia Purdue University San Diego Natural History Museum Simon Fraser University Smithsonian Institution South Dakota State University University of Arkansas University of California, Berkeley University of California, Davis University of Colorado, Boulder University of Georgia University of Idaho University of Kansas University of Michigan University of Minnesota University of Nebraska Nevada Department of Agriculture University of Wisconsin, Madison Washington State University Yale University Canada Department of Agriculture University of British Columbia, Vancouver Grand Total and Maximum Age Range
# of specimens 504 12 261 648 45 10 42 451 6 85 764 4 640 551 27 37 13 1310 122 1 825 1085 4 1 78 402 4 196 73 4 153 678 754 49 103 9942
Year Range 1813-2008 1910-1991 1919-2007 1896-2006 1912-2003 1917-1954 1902-1982 1879-2007 1937-1973 1899-1985 1883-2010 1923-2004 1893-2007 1871-1990 1898-1976 1826-2007 1915-1960 1877-1993 1986-1988 1905-2004 1891-2003 1917-2007 1901-2009 1915-2006 1812-1997 1892-2003 1823-2000 1892-2004 1898-2000 1957-1990 1906-1980 1888-1998 1967-1992 1917-1963 1905-1986 1813-2010
22 Table 2-2. WorldClim bioclimatic variables utilized to construct each bumble bee SDM (Hijmans et al. 2005; A = B. affinis, F = B. franklini, O = B. occidentalis, T = B. terricola). Bioclimatic variable Annual Mean Temperature Mean Diurnal Range Isothermality (P2/P7) (* 100) Temperature Seasonality (standard deviation *100) Max Temperature of Warmest Month Min Temperature of Coldest Month Temperature Annual Range (P5-P6) Mean Temperature of Wettest Quarter Mean Temperature of Driest Quarter Mean Temperature of Warmest Quarter Mean Temperature of Coldest Quarter Annual Precipitation Precipitation of Wettest Month Precipitation of Driest Month Precipitation Seasonality (Coefficient of Variation) Precipitation of Wettest Quarter Precipitation of Driest Quarter Precipitation of Warmest Quarter Precipitation of Coldest Quarter
SDM application A, F, O, T A, O, T A, F, O, T A, T O, T T A, F, O, T A, O, T A, O, T A, O, T T F, O F, O, T F A, F, O O A, O, T A, O, T
constructed using the default parameters as prescribed by Phillips et al. (2006). Unlike algorithms that generate a SDM based on presence/absence or abundance data, MaxEnt requires only presence data. This approach is advantageous for organisms like bumble bees because they can be hard to detect, thus a recorded absence point may not be true absence. To evaluate likelihood of occurrence, MaxEnt calculates a habitat suitability index, where values closer to zero indicate areas with low habitat suitability, and values closer to one indicate areas with high habitat suitability (Phillips et al. 2006). Quantification of the habitat suitability index, hereafter defined as ‘habitat suitability’, is based on the model inputs, in this case the bioclimatic variables made available by Hijmans et al. (2005). Because maximum and minimum values associated habitat suitability vary across the SDMs
23 constructed in this study, the calculated habitat suitability for each model is reclassified and normalized in ArcGIS 9.3 using a 10-fold equal interval for relative comparison. This allowed an equal delineation of 10 distinct values of habitat suitability between zero and one. Each SDM was evaluated separately and averaged over 50 replicates using a random 80% subset of localities to train the model and 20% reserved for testing using the area under the receiver operating curve (AUC) statistic. AUC values closer to one suggest good predictive performances, whereas values closer to 0.5 suggest poor predictive performance (Fielding & Bell 1997). To assess the bioclimatic distribution of B. affinis, B. franklini, and B. terricola SDMs, as well as the role of NHC contribution in the B. occidentalis SDMs, relative proportions of habitat suitability in the contiguous U.S.A. are investigated. The bioclimatic space (i.e. 2.5 arc-seconds per bioclimatic pixel unit, hereafter defined as BPU) associated with each habitat suitability category is divided by the total BPU of the contiguous U.S.A. to represent the relative proportion of each habitat suitability category (Figures 2-3, 2- 5, 2-7, 210). This simple calculation allows a broad comparison of how habitat suitability across the 10 categories of habitat suitability classification changes with respect to species and NHC contribution. For example, in the B. affinis SDM, 9,318 BPU are associated with the habitat suitability category 0.41 – 0.50. As there are 470,613 BPUs in the contiguous U.S.A. in the current SDM framework, the relative contribution of the 0.41 – 0.50 habitat suitability category in the B. affinis SDM is approximately 2% (Figure 2-3). To demonstrate the difference in SDM resolution between a dataset from a single NHC and the Global dataset of B. occidentalis, z-tests of equal proportions are performed (Fleiss 1973). Each habitat suitability delineation (k = 10) of the B. occidentalis NPIC SDM
24 is directly compared to the respective BPU values in the B. occidentalis Global SDM. This provides a direct opportunity to determine how a single NHC contribution in constructing an SDM contributes to the predictive power and resolution of a species potential distribution in comparison to a dataset that includes multiple NHC data.
RESULTS For B. affinis, two maps of the probable historic range are given in Figure 2-2. Figure 2-2A is the traditional shaded-distribution map (Milliron 1971) showing the extremities of the species range. Figure 2-2B is generated using SDM techniques and depicts the probable distribution of B. affinis based on the bioclimatic variables selected for the SDM (Table 2-2). Despite limited NHC data utilized, the SDM performed relatively well in constructing the bioclimatic profile of B. affinis (AUC = 0.99 ± 0.008). Based on the B. affinis SDM, 78% of the BPUs in the contiguous U.S.A. are associated with habitat suitability values ≤ 0.10, suggesting a narrow bioclimatic niche. As this is a relatively large proportion, the 0.10 habitat suitability delineation is excluded from Figure 2-3 to ease interpretation. The remaining BPUs (22 %) characterizes habitat suitability values from 0.20 to 1.0 (Figure 2-3). However, none of the actual presence localities utilized in the B. affinis SDM is ≤ 0.20 habitat suitability. Thus, the total area characterized as suitable habitat based on the minimum habitat suitability associated with a true B. affinis presence record (≥ 0.30 habitat suitability) is approximately 7.2 x 10⁴ BPU. Figure 2-4 also depicts the extremity and predicted bioclimatic space of B. terricola. Both maps show similar probable historic distributions of B. terricola, particularly at the northern limit of its distribution. Like the B. affinis SDM, the B. terricola SDM (Figure 24B) performed relatively well (AUC = 0.96 ± 0.02) despite the limited amount of data
25 utilized in the model. However, unlike the B. affinis SDM, the B. terricola SDM suggest a larger probable distribution than B. affinis based on the bioclimatic variables utilized. Based on the minimum habitat suitability value (habitat suitability ≥ 0.20) associated with true B. terricola presence, the bioclimatic space characterized as suitable habitat is approximately 2.8 x 10⁵ BPU (Figure 2-5). Based on published monographs on the distribution of B. terricola (Milliron 1971), the broad distribution predicted by the SDM is not surprising (Figure 2-4A).Bioclimatic space associated with a habitat suitability ≤ 0.10 accounts for 53% of BPUs in the contiguous U.S.A. As in the B. affinis habitat delineation, this portion is excluded from Figure 2-5 to aid in interpretation of habitat suitability delineation. It appears that unlike B. affinis, B. terricola has a much more generalized bioclimatic profile as suggested by the SDM constructed in this study.
Figure 2-2. The range maps of B. affinis: (A) Traditional shaded-distribution map (Milliron 1971) and (B) SDM map. Points indicate NHC locality used to construct the SDM. Hot colors suggest high habitat suitability, whereas cool coolers suggest low habitat suitability.
Proportion of Contiguous U.S.A.
26
0.07 0.06 0.05
0.04 0.03 0.02 0.01 0 0.20 0.30 0.40 0.50 0.60 0.70 0.80 0.90 1.00 Habitat Suitability Values
Figure 2-3. Bombus affinis habitat suitability delineation across 0.20 – 1.00 in the contiguous U.S.A. Excludes habitat suitability value 0.10 (78% of the contiguous U.S.A.) to aid interpretation.
Figure 2-6 presents the traditional shaded distribution map and SDM of B. franklini. Figure 2-6B reflects the probable distribution of B. franklini as predicted by 196 specimens representing 11 unique localities within the Klamath Mountains ecoregion (citation). This ecoregion was employed in the depicted SDM, as the initial SDM generated from the available locality records and bioclimatic variables extended far beyond known distribution of B. franklini (Thorp et al. 1983). The B. franklini SDM performed well (AUC = 0.99 ± 0.0004), despite limited data that was particularly narrow to begin with (Figure 2-6A). Bioclimatic space characterized by the SDM as habitat suitability value 1.0 within the Klamath Mountain ecoregions amounted to 57% (3.0 x 10³ BPU) of the bioclimatic area (Figure 2-7). However, it should be noted that the distribution of B. franklini was modeled well outside of its known distribution (Figure 2-6B), suggesting that other abiotic or biotic factors may be limiting its distribution.
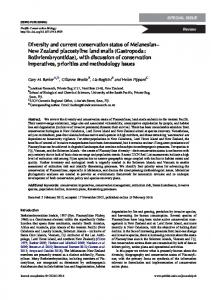
27 The traditional shaded extremity map of B. occidentalis (Figure 2-8) is closely reflected in the extremities of B. occidentalis distribution in the Global NHC SDM (Figure 29D). However, when SDMs are constructed from regional NHC, the bioclimatic bias in the probable distribution of the B. occidentalis is blatantly apparent, demonstrating the severity of only including a single NHC in SDM analysis (Figure 9A-C). A visual comparison of each NHC SDM shows that high habitat suitability is delineated regionally (e.g. Pacific Northwest), reflecting the geographic bias of B. occidentalis specimen holdings of the respective NHC. For example, the UCB generally houses specimens from within the state of California, U.S.A. and areas west of the Sierra-Cascade Crest (Figure 2-9A), whereas specimens housed at WSU are collected primarily in the Pacific Northwest (Figure 2-9B) and specimens housed at the NPIC are typically collected in the Intermountain West, specifically
Figure 2-4. The range maps of B. terricola: (A) Traditional shaded-distribution map (Milliron 1971) and (B) SDM map. Points indicate NHC locality used to construct the SDM. Hot colors suggest high habitat suitability, whereas cool coolers suggest low habitat suitability.
28
Proportion of Contiguous U.S.A.
0.18
0.16 0.14 0.12 0.10 0.08 0.06 0.04 0.02 0.00 0.20 0.30 0.40 0.50 0.60 0.70 0.80 0.90 1.00 Habitat Suitability Values
Figure 2-5. Bombus terricola habitat suitability delineation across 0.20 – 1.00 in the contiguous U.S.A. Excludes habitat suitability value 0.10 (53% of the contiguous U.S.A.) to aid interpretation.
Figure 2-6. The range maps of B. franklini: (A) Traditional shaded-distribution (Thorp et al. 1983), (B) SDM map and Klamath Mountains ecoregion. Points indicate NHC locality used to construct the SDM with 10 mi buffer. Hot colors suggest high habitat suitability, whereas cool coolers suggest low habitat suitability.
29
Proportion of Klamath Mountains
0.70 0.60 0.50 0.40 0.30 0.20 0.10
0.00 0.50
0.60
0.70
0.80
0.90
1.00
Habitat Suitability Values Figure 2-7. Bombus franklini habitat suitability delineation across 0.50 – 1.00 in the Klamath Mountains ecoregion.
Utah, U.S.A. (Figure 2-9C). Despite the narrow SDM constructed from the regional NHCs, each SDM performed extremely well (UCB: AUC = 0.98 ± 0.01; WSU: AUC = 0.99 ± 0.002; NPIC: AUC = 0.98 ± 0.005). The global B. occidentalis SDM performed equally well (AUC = 0.94 ± 0. 004). The fact that each SDM performed well is not surprising, as MaxEnt is able to successfully model a distribution with as little as 10 locality records (Wisz et al. 2008). To assess the changing resolution of an SDM with additional locality records I compare the BPUs assigned to each habitat suitability value by comparing the NPIC and Global B. occidentalis SDMs (Figure 2-10). In the B. occidentalis NPIC SDM, the proportion of bioclimatic space assigned to 0.10 habitat suitability comprised 62% of the bioclimatic space modeled, whereas in the B. occidentalis Global SDM the proportion increases to 55%. This suggests that the Global B. occidentalis SDM is refining bioclimatic space associated with the species distribution, and improving its calculation of habitat suitability relative to the
30 additional locality records utilized in the Global SDM. Of the 10 habitat suitability categories presented here, six show significant decreases in the proportion of BPU modeled, whereas three categories show significant increases in BPU (Figure 2-10). The habitat suitability value delineation to show the greatest increase from the B. occidentalis NPIC SDM to the B. occidentalis Global SDM are where habitat suitability value is 0.90 (118%, increase from 32,248 to 70,323 BPU), whereas the greatest decrease is observed when habitat suitability is 0.10 (11%, decrease from 289,508 to 258,045 BPU).
Figure 2-8. Traditional shaded-distribution of B. occidentalis (Milliron 1971).
DISCUSSION Constructing a relational database of historic specimens allows for a broad bioclimatic sample of species occurrence and may be useful when refining predictive maps using SDM techniques (Loiselle et al. 2003, Graham et al. 2004, Vollmar et al. 2010). While no practical SDM may fully represent the distribution of a species across a large bioclimatic landscape, it is possible to generate a SDM that captures the probable species distribution
31
Figure 2-9. The range maps of B. occidentalis across three NHC in western North America: (A) B. occidentalis UCB SDM (B) B. occidentalis WSU SDM, (C) B. occidentalis NPIC SDM and (D) B. occidentalis Global SDM. White points indicate NHC locality used to construct the SDM. Hot colors suggest high habitat suitability, whereas cool coolers suggest low habitat suitability.
based on known locality records (Scott et al. 2002, Vaughan & Ormerod 2005). This approach can be quite informative to the conservation biologist when investigating optimal habitats to survey for threatened or cryptic species (Oberhauser & Peterson 2003, Gonzalez et al. 2010). While applying SDM techniques to model the probable distribution of a species is not without problems (Shaffer et al. 1998, Bannerman 1999, Austin 2002, Loiselle et al. 2003), there certainly are many advantages to the methodology in conservation biology. For example, SDMs have the ability to take bioclimatic and climatic variance to account, while these characters are usually not reflected in traditional maps (Oberhauser & Peterson 2003).
32 In areas with high bioclimatic variance (e.g. the Great Basin) localities that are unlikely to be inhabited by a species are omitted from the predicted range. The inclusion or exclusion of species across a bioclimatic space is a reflection of the bioclimatic predictors selected when occurrence data is aggregated (Guisan & Zimmerman 2000, Austin 2002). This becomes clear when viewing the range map of B. occidentalis, where the species optimal habitat suitability occurs primarily in the isolated mountain ranges of the Great Basin (Figure 2-9). This phenomenon appears elsewhere in the range of a species and is, in fact, seen across the subgenus Bombus s. str. For example, B. affinis occurs along the crest of the Appalachian Mountains in the eastern U.S.A. much further south than it occurs in the lower lying plains. The areas of high elevation in the eastern U.S.A. appear to be likely habitat in the SDM (Figure 2-2B), whereas the low plains east of the crest do not appear particularly suitable. Furthermore, the distribution of B. terricola is suggested to be exceptionally broad in the eastern U.S.A. (Figure 2-4A). This natural history observation is well supported by the broad bioclimatic space associated with middle to high habitat suitability values illustrated in the SDM (0.50 – 1.0; Figure 2-4B). The intensity of shading as a reflection of habitat suitability provided in an SDM also helps to identify which sites are more likely inhabited by the study species (Guisan & Zimmerman 2000, Loiselle et al. 2003, Phillips et al. 2006). By focusing efforts to locate populations only in areas of high habitat suitability, time and resources can be allocated wisely (Oberhauser & Peterson 2003). However, caution must be placed when defining areas as either ‘suitable’ or ‘unsuitable’ when SDM techniques are utilized (Loiselle et al. 2003). This is especially true when designing conservation or agricultural zones. It is important to
33
Proportion of Contiguous U.S.A.
0.16 0.14
NPIC Global
0.12 0.10 0.08
0.06 0.04 0.02 0.00 0.20
0.30
0.40
0.50
0.60
0.70
0.80
0.90
1.00
Habitat Suitability Values Figure 2-10. NPIC and Global SDM comparison of B. occidentalis habitat suitability across 0.20 – 1.00 in the contiguous U.S.A using z-test of equal proportions. Excludes habitat suitability value 0.10 (NPIC = 62% and Global = 55% of the contiguous U.S.A., respectively) to aid in interpretation. Habitat suitability value comparison: 0.10: z = 65. 90, 11% BPU increase; 0.20: z = -71.84, 63% BPU increase; 0.30: z = -29.34, 39% BPU increase; 0.40: z = 11.07, 13% BPU decrease; 0.50: z = 19.66, 23% BPU decrease; 0.60: z = 36.73, 38% BPU decrease; 0.70: z = 35.86, 34% BPU decrease; 0.80: z = 21.30, 16% BPU decrease; 0.90: z = -127.02, 118% BPU increase; 1.00: z = 65.96, 59% BPU decrease; all p ≤ 0.05.
34 note that SDMs are only as good as the data and statistical models provided to construct them (Guisan & Zimmerman 2000, Austin 2002, Wisz et al. 2008). SDMs are susceptible to bias when predictor variables are arbitrarily selected, or when the bioclimatic spread of available data is regionally narrow (Figure 2-9A-C). Therefore, it is important to construct a concept model prior to applying any data or statistical models in analysis. Furthermore, an understanding of a species ecology, natural history and niche are essential when compiling predictor variables and locality data. Maps generated by SDM techniques are dynamic and can be refined with the addition of data from multiple NHC (Figure 2-9, Table 2-1). As researchers locate additional specimens, they can be incorporated into an existing relational database. Once historic data is in a database, it can be accessed easily and made available to a broad community of interested parties (Vollmar et al. 2010). Each subsequent addition of data only serves to refine the relational database, and in turn the respective SDM. This refinement is clearly demonstrated with the NPIC B. occidentalis SDM, where bioclimatic allocation of optimal habitat suitability increased a hundred fold with additional data (Figure 2-10). This was especially true in the Pacific Northwest portion of B. occidentalis’ range, where the lack of data provided by the NPIC dataset failed to model suitable habitat in the region (Figure 29C), despite the overwhelming data associated with this region from other NHC (Figure 29B, Table 2-1). Interestingly, the SDM of B. terricola and B. affinis in this study seem to reflect the distribution described by Milliron (1971) more accurately than observed with both B. occidentalis SDM. This phenomenon was observed despite the use of fewer specimens to generate the B. affinis and B. terricola SDM, suggesting that some SDM may require far less data to model than others. Research effort should be placed to determine how bioclimatic
35 spread and sample size affect the outcome of an SDM constructed using the MaxEnt 3.3 beta algorithm (but see Wisz et al. 2008). Despite the advantages of SDM techniques in generating maps of bumble bee ranges, it is important to remember that as with all models, they are only predictive and do not show with absolute certainty where a species will occur (Austin 2002, Scott et al. 2002, Loiselle et al. 2003). In some cases the SDM predicts suitable habitat in areas where there is no historical data to support the SDM. This phenomenon may best be explained by a species natural history of dispersal and competition. For example, one area of concern with the B. occidentalis SDM is that it predicts suitable habitat in the higher elevations of southern California and northern Mexico (Figure 9D). Despite this prediction by the model, there is no historic data to support this distribution (Figure 9D; Milliron 1971). However, NPIC does document a single B. occidentalis record in San Diego, California, U.S.A. This record suggests that (1) B. occidentalis was found in San Diego, (2) the specimen was incorrectly labeled, or (3) that the specimen was misidentified. While it is possible that the southern Sierra Mountains were historically colonized by B. occidentalis, given the intensity of collection in California (Thorp et al. 1983), it seems highly unlikely. Alternatively, this area may have never been colonized by B. occidentalis or colonized in the distant past but the species was extirpated prior to human collection (Hines 2008). Either way, the model predicts regions of suitable habitat for which historic records are not available to support the hypothesis. False presence prediction is further demonstrated in the B. franklini SDM which greatly exceeds the species known distribution (Figure 2-6B). However, like B. occidentalis, this species may be limited by other biotic and abiotic factors not utilized in the SDM. For
36 example, the highest diversity of bumble bees in North America occurs adjacent to the distribution of B. franklini in southwest Oregon, U.S.A. (Williams et al. 1998). Thus, one could hypothesize that the interplay between bumble bee diversity, nest size, and natural history may limit some species of bumble bee (e.g. B. franklini) that co-occur (Heinrich 1979, Macfarlane 1974, Hines 2008). Bumble bee community structure and resource competition has been well studied for the past several decades, so it is not surprising that some species may be limited by their distribution despite a favorable bioclimatic environment (Heinrich 1979, Inouye 1980). The generation of a SDM is useful for not only predicting the habitat occupied in both the recent past and present, but also informs research efforts for the future (Loiselle et al. 2003, Oberhauser & Peterson 2003). Comparisons of present distributions to recent past distributions may help scientist to understand the effects of landscape and climate changes on bumble bee populations. Predicting the future range geometry of a species distribution is possible only when a full understanding of the factors affecting the recent past and current distributions is achieved (Shaffer et al. 1998, Scott et al. 2002, Oberhauser & Peterson 2003, Vaughan & Ormerod 2005, Vollmar et al. 2010). This approach requires that the data sets used to generate the SDM are robust and draw from multiple NHC. In order for this to be accomplished, the construction of an updatable relational database of NHC data is an essential first step.
CONCLUSION Of the 467 described genera of bee, Bombus are one of the most charismatic and recognizable due to their typically bright, furry and robust appearance (Heinrich 1979, Michener 2007). Thus the decline and range contraction of the genus has been recognized by
37 both the scientific community and the general public. Although baseline data of historic bumble bee communities in North America is sorely lacking, current efforts to retroactively capture records from various publications and NHC (Colla & Packer 2008, Evans et al. 2008, Grixti et al. 2009) are underway. Here we demonstrated the utility of applying specimen label data across a relatively broad sample of NHC in constructing SDM. As in the case with B. occidentalis, increasing institutional databases with specimens from multiple NHC widens the bioclimatic scope of a species, and has the potential to build a more detailed SDM for determining distribution. This data also provides insight into the phenological variation of a species across its range. While retroactive data collection is time consuming, the benefits are clear.
Literature Cited Allen-Wardell, G., Bernhardt, P., Bitner, R., Burquez A., Buchmann, S., Cane, J., Cox, P.A. 1998. The potential consequences of pollinator declines on the conservation of biodiversity and stability of food crop yields. Conservation Biology 12:8-17. Austin, M.P. 2002. Spatial prediction of species distribution: an interface between ecological theory and statistical modeling. Ecological Modeling 157: 101-118. Banda, H. J., Paxton, R.J. 1991. Pollination of greenhouse tomatoes by bees. Acta Horticulturae 288: 193-198. Bannerman, B.S. 1999. Positional accuracy, error, and uncertainty in spatial information. Geoinnovations, Howard Springs, NT. Australia. (http://www.geoinnovations.com.au/posacc/patocc.htm) [Accessed 28 Apr. 2009]. Bertsch, A., Hrabé de Angelis, M., Przemeck, G.K.H. 2010. A phylogenetic framework for the North American bumble bee species of the subgenus Bombus sensu stricto (Bombus affinis, B. franklini, B. moderatus, B. occidentalis & B. terricola) based on mitochondrial DNA markers. Beitr äge zur Entomologie 60: 229 – 242. Cane, J. H., Schiffhauer, D. 2003. Dose-response relationships between pollination and fruiting refine pollinator comparisons for cranberry (Vaccinium macrocarpon). American Journal of Botany 90: 1425-1432.
38 Cameron, S. A., Hines, H.M., Williams, P.H. 2007. A comprehensive phylogeny of the bumble bees (Bombus). Biological Journal of the Linnaean Society 91: 161-188. Colla S.R., Otterstatter, M.C., Gegear, R.J., Thomson, J.D. 2006. Plight of the bumble bee: pathogen spillover from commercial to wild populations. Biological Conservation 129: 461467. Colla, S. R., Packer, L. 2008. Evidence for the decline of eastern North American bumble bees, with special focus on Bombus affinis Cresson. Biodiversity and Conservation 17: 13791391. Colla, S.R., Ratti, C.M. 2010. Evidence for the decline of the western bumble bee (Bombus occidentalis Greene) in British Columbia. Pan-Pacific Entomologist 86:32-34. Elith, J., Graham, C.H., Anderson, R.P., Dudík, M., Ferrier, S., Guisan, A., Hijmans, R.J., Huettmann, F., Leathwick, J.R., Lehmann, A., Li, J., Lohmann, L.G., Loiselle, B.A., Manion, G., Mortiz, C., Nakamura, M., Nakazawa, Y., Overton, J.M., Peterson, A.T., Phillips, S.J., Richardson, K., Scachetti-Pereira, R., Schapire, R.E., Soberón, J., Williams, S., Wisz, M.S., Zimmerman, N.E. 2007. Novel methods improve prediction of species’ distribution from occurrence and pseudo-absence data. Journal of Applied Ecology 41: 263-274. Evans, E., Thorp, R., Jepsen, S., Black, S.H. 2008. Status review of three formerly common species of bumble bee in the subgenus Bombus: Bombus affinis (the rusty patched bumble bee), B. terricola (the yellow banded bumble bee), and B. occidentalis (the western bumble bee). The Xerces Society of Invertebrate Conservation, Portland, OR. Fielding, A.H., Bell, J.F. 1997. A review of methods for the assessment of prediction errors in conservation presence/absence models. Biological Conservation 24:1:38-49 Fleiss, J.L. 1973. Statistical methods for rates and proportions. John Wiley and Sons Inc., Toronto, Canada. Gillespie, S. 2010. Factors affecting parasite prevalence among wild bumblebees. Ecological Entomology DOI: 10.1111/j.1365-2311.2010.01234.x Gonzalez, V.H., Koch, J.B., Griswold, T.L. 2010. Anthidium vigintiduopunctatum Friese (Hymenoptera: Megachilidae): the elusive ‘‘dwarf bee’’ of the Galápagos Archipelago? Biological Invasions 12:2381–2383 Goulson, D., Lye, G.C., Darvill, B. 2008. Decline and conservation of bumble bees. Annual Review of Entomology 53: 191-208. Graham, C.H., Ferrier, S., Huettman, F., Moritz, C., Peterson, A.T. 2004. New developments in museum-based informatics and applications in biodiversity analysis. Trends in Ecology and Evolution 19: 497-503.
39 Grixti, J.C., Wong, L.T., Cameron, S.A., Favret, C. 2009. Decline of bumble bees (Bombus) in the North American Midwest. Biological Conservation 142: 75-84. Guisan, A., Zimmermann, N.E. 2000. Predictive habitat distribution models in ecology. Ecological Modeling 135: 147–186. Heinrich B. 1979. Bumble bee Economics. Harvard University Press, Cambridge, MA and London, England. Hijmans, R.J., Cameron, S.E., Parra, J.L., Jones, P. G., Jarvis, A. 2005. Very high resolution interpolated climate surfaces for global land areas. International Journal of Climatology 25: 1965–1978 [available at www.worldclim.org]. Hines, H.M. 2008. Historical biogeography, divergence times, and diversification patterns of bumble bees (Hymenoptera: Apidae: Bombus). Systematic Biology 57: 58-75. Hobbs, G.A. 1968. Ecology of species of Bombus (Hymenoptera: Apidae) in southern Alberta VII. Subgenus Bombus. The Canadian Entomologist 100: 156-164. Inouye, D.W. 1980. The effect of proboscis and corolla tube lengths on patterns and rates of flower visitation by bumblebees. Oecologia 45: 197-201. Javorek, S.K., MacKenzie, K.E., Vander Kloet, S.P. 2002. Comparative pollination effectiveness among bees (Hymenoptera: Apoidea) on lowbush blueberry (Ericaceae: Vaccinium angustifolium). Annual Entomological Society of America 95: 345-351. Kearns, C., Inouye, D., Waser, N. 1998. Endangered mutualisms: The conservation of plantpollinator interactions. Annual Review of Ecology, Evolution, and Systematics 29: 83-112. Kosior, A., Celary, W., Olejniczak, P., Fijat, J., Krol, W., Solarz, W., Plonka, P. 2007. The decline of the bumble bees and cuckoo bees (Hymenoptera: Apidae: Bombini) of western and central Europe. Oryx 41: 79-88. Loiselle, B.A., Howell, C.A., Graham, C.H., Goerck, J.M., Brooks, T., Smith, K.G., Williams, P.H. 2003. Avoiding pitfalls of using species distribution models in conservation planning. Conservation Biology 17: 1591–1600. Macior, L.W. 1968. Pollination adaptation in Pedicularis groenlandica. American Journal Botany 558: 927-932. Macfarlane, R. P. 1974. Ecology of Bombinae (Hymenoptera: Apidae) of southern Ontario, with emphasis on their natural enemies and relationships with flowers. PhD Thesis, University of Guelph, Guelph, Canada. Macfarlane, R. P., Patten, K. D., Royce, L. A., Wyatt, B. K., Mayer, D. F. 1994. Management potential of sixteen North American bumble bee species. Melanderia 50: 1- 12.
40 McFrederick, Q. S., LeBuhn, G. 2006. Are urban parks refuges for bumble bees Bombus spp. (Hymenoptera: Apidae)? Biological Conservation 129: 372-382. Medler, J. T., Carney, D.W. 1963. Bumble bees of Wisconsin (Hymenoptera: Apidae). Research Bulletin, University of Wisconsin, Agricultural Experiment Station 240: 47 pp. Michener, C.D. 2007. The bees of the world. 2nd edition. The Johns Hopkins University Press, Baltimore, MD. Milliron, H.E. 1971. A monograph of the western hemisphere bumble bees (Hymenoptera: Apidae; Bombinae) I. The genera Bombus and Megabombus subgenus Bombias. Memoirs of the Entomological Society of Canada 82 pp 80. National Pollinating Insects Database 2010. United States Department of Agriculture, Agriculture Research Service, Bee Biology and Systematics Laboratory, Logan, UT (Accessed 2009-10-04). Oberhauser, K., Peterson, A.T. 2003. Modeling current and future potential wintering distributions of eastern North American monarch butterflies. PNAS 100: 14063-14068. Otterstatter M.C., Thomson, J.D. 2008. Does pathogen spillover from commercially reared bumble bees threaten wild pollinators? PLoS 1 3: e2771. Phillips S.J., Anderson R.P., Schapire, R.E. 2006. Maximum entropy modeling of species bioclimatic distribution. Ecological Modeling 190: 231-259. Plowright, R. C., Stephen, W.P. 1980. The taxonomic status of Bombus franklini (Hymenoptera: Apidae). Canadian Entomologist 112: 475-480. Shaffer, H.B., Fisher, R.N., Davidson, C. 1998. The role of natural history collections in documenting species declines. Trends in Ecology and Evolution 13: 27-30. Scholl, A., Thorp, R.W., Obrecht, E. 1992. The genetic relationship between Bombus franklini (Frison) and other taxa of the subgenus Bombus s.str. (Hymenoptera: Apidae). PanPacific Entomologist 68: 46–51. Scott, J.M., Heglund, P.J., Haufler, J.B., Morrison, M., Raphael, M.G., Wall, W.B. 2002. Predicting Species Occurrences: Issues of Accuracy and Scale. Island Press, Covelo, CA Shipp J.L., Whitfield G.H., Papadopoulos, A.P. 1994. Effectiveness of the bumble bee, Bombus impatiens Cr. (Hymenoptera: Apidae), as pollinator of greenhouse sweet pepper. Scientia Horticulturae 57: 29-39. Soberón, J., Arriaga, L., Lara, L. 2002. Issues of quality control in large mixed-origin entomological databases. In Saaremaa, H., Nielsen, E.S., editors. Towards a global biological
41 information infrastructure, challenges, opportunities, synergies, and the role of entomology. European Environment Agency, Copenhagen, Denmark. Speight, D. L. 1967. The bumble bees (Hymenoptera, Apidae, Bombinae) of east Tennessee. Master’s Thesis, University of Tennessee, Knoxville, TN. Stephen, W.P. 1957. Bumble bees of western America. Oregon State University Technical Bulletin 40, 162 pp. Thorp, R.W., Horning, D.S. Jr., Dunning, L.L. 1983. Bumble bees and cuckoo bumble bees of California (Hymenoptera: Apidae). Bulletin of California Insect Survey 23, viii-79. Thorp, R.W. 2003. Bumble Bees (Hymenoptera: Apidae): Commercial use and environmental concerns. pp. 21-40. In K. Strickler and J. H. Cane (eds.). For nonnative crops, whence pollinators of the future? Thomas Say Publications in Entomology: Proceedings. Entomological Society of America, Lanham, MD. Thorp, R. 2005. Bombus franklini Frison 1921 Franklin's bumble bee (Hymenoptera: Apidae: Apinae: Bombinae). In Shepherd, M.D. Vaughan, D.M., Black, S.H. (Eds.), Red List of Pollinator Insects of North America. CD-ROM Version 1 (May 2005). The Xerces Society of Invertebrate Conservation, Portland, OR. Volllmar, A., Macklin, J.A., Ford, L.S. 2010. Natural history specimen digitization: challenges and concerns. Biodiversity Informatics 7: 93-112. Williams, P.H. 1986. Environmental change and the distribution of British bumble bees (Bombus Latr.). Bee World 67: 50-61. Williams, P.H. 1998. An annotated checklist of bumble bees with an analysis of patterns of description (Hymenoptera: Apidae, Bombini). Bulletin of the Natural History Museum, London (Ent.) 67: 79-152. [updated at: www.nhm.ac.uk/research-curation/projects/Bombus/]. Williams, P.H., Araujo, M.B., Rasmont, P. 2007. Can vulnerability among British bumble bee Bombus species be explained by niche position and breadth? Biological Conservation 138: 493-505. Vaughan, I.P., Ormerod, S.J. 2005. The continuing challenges of testing species distribution models. Journal of Applied Ecology 42(4): 720-730. Wisz, M.S., R.J. Hijmans, J. Li, A.T. Peterson, C.H. Graham, A. Guisan, and NCEAS Predicting Species Distributions Working Group. 2008. Effects of sample size on the performance of species distribution models. Diversity and Distributions 14: 763-77
42 CHAPTER 3 STATUS OF BUMBLE BEE (BOMBUS) COMMUNITIES IN ALASKA WITH SPECIAL FOCUS ON B. OCCIDENTALIS, B. MODERATUS AND NOSEMA BOMBI PREVELENCE
Abstract In both Canada and the contiguous U.S.A., species of the subgenus Bombus sensu stricto are experiencing dramatic declines in abundance and range. However, virtually nothing is known of the status of the two species of Bombus s. str. that co-occur in the Alaskan Interior: B. moderatus and B. occidentalis. This study presents a status snapshot of both species by investigating their relative abundance, Nosema bombi pathogen loads and distribution in the Alaskan Interior. Bombus occidentalis and B. moderatus account for 36% and 11% of the bumble bee fauna surveyed, respectively. While B. occidentalis was the most abundant species in our survey, it also had the highest proportion of N. bombi infections (44% infected), whereas the proportion of infected B. moderatus did not differ significantly from co-occurring bumble bees. Despite N. bombi infections, our preliminary investigation suggests that both species are detectable in the Alaska Interior, particularly B. occidentalis, with our survey method. Introduction For the past decade, there has been concern that several North American bumble bee (Bombus Latreille) species have been experiencing dramatic range and population declines, as well as decreased genetic diversity (McFrederick and Lebuhn 2006, Colla and Packer 2008, Grixti et al. 2009, Lozier and Cameron 2009, Cameron et al. 2011). Globally, multiple hypotheses have been proposed concerning bumble bee decline, ranging from climate change to competition with non-native bee species (reviewed in Goulson et al. 2008). In North
43 America, the transmission of a novel strain of Nosema bombi, an obligate intracellular protozoan, from commercially reared congenerics to adjacent wild populations has been suggested as the main causal agent of bumble bee decline (Flanders et al. 2003, Thorp and Shepherd 2005, Colla et al. 2006). The species speculated to be experiencing the most dramatic decline, possibly due to a novel strain of N. bombi, are of the subgenus Bombus sensu stricto, and include the following: B. affinis, B. franklini, B. occidentalis and B. terricola (Thorp and Shepherd 2005, Colla and Packer 2008, Cameron et al. 2011). The conservation status of a sister species, B. moderatus, is less known, primarily due to the taxonomic treatment it has received in the past, and paucity in collection history (Milliron 1972, Thorp and Shepherd 2005, Bertsch et al. 2010). The microsporidium N. bombi is an obligate, intracellular protozoan that often becomes systemic in infected bumble bees (Macfarlane et al. 1995). In two field studies N. bombi was documented to infect more than 50% of colonies of B. terrestris, a European bumble bee widely used in commercial agriculture in and out of its native range (Fisher and Pomeroy 1989, Imhoof and Schmid-Hempel 1999). The principle mode of N. bombi transmission is from queen to offspring (vertical transmission), with the primary symptomatology of dysentery (Macfarlane et al. 1995). Bumble bee colonies infected with N. bombi generally produce more sexual offspring than uninfected colonies, relative to worker production (Imhoof and Schmid-Hempel 1999). Furthermore, gynes produced from N. bombi infected colonies have been found to have a lower probability of success in mating, winter survival and nest establishment (Macfarlane et al. 1995). While both narrow and broad investigations of bumble bee decline in the contiguous U.S.A. and Canada have been published (McFrederick and Lebuhn 2006, Evans et al. 2008,
44 Colla and Packer 2008, Grixti et al. 2009, Lozier and Cameron 2009, Colla and Ratti 2010, Cameron et al. 2011), virtually nothing is known on the current status of bumble bees in Alaska, U.S.A. Based on natural history collections and published monographs, Alaskan bumble bee species include about 40% of all North American taxa, of which six species are regionally endemic north of the 50°N latitude (Milliron 1971, 1973, Williams and Thomas 2005). In fact, one species, B. distinguendus is distributed throughout northern Europe and Asia in the Old World, and the Aleutian Islands in the New World (Williams and Thomas 2005). Of the bumble bees documented in Alaskan Interior, both B. occidentalis and B. moderatus appear to have broad geographic distributions, extending well above the Arctic Circle (Milliron 1971). Considering the current conservation status of B. occidentalis in Canada and the contiguous U.S.A. (Evans et al. 2008, Colla and Ratti 2010, Cameron et al. 2011,), and unknown status of B. moderatus (Cameron et al. 2011), it is critical to provide a conservation status snapshot of bumble bee abundance, health and range in the Alaskan Interior. First, I provide a simple report on bumble bee community composition based on standardized survey efforts. Second, I assess N. bombi infection frequency of five bumble bee communities in the Alaska Interior detected within a standardized framework. Infection frequencies of N. bombi in Alaskan B. occidentalis are also compared to frequencies in several populations of B. occidentalis surveyed in the contiguous U.S.A. using the same survey protocol. Finally, to elucidate the geographic distribution of B. moderatus and B. occidentalis in the Alaskan Interior, species distribution models (SDM) are constructed by aggregating species locality records and bioclimatic variables in a maximum entropy framework.
45 Methods Standardized surveys were conducted near Allen Army Airfield (1271 m, 63.93°W, 145.54°N), Arctic Circle (1039 m, 66.71°W, 150.67°N), Big Jim Creek (1039 m, 66.71°W, 150.67°N), Sourdough Creek (1940 m, 62.52°W, 145.51°N) and Tiekel Cache (1487 m, 61.39°W, 145.23°N) from 28 July to 6 August 2010. Surveys are timed, and characterized as a haphazard collection of the entire bumble bee community on the dominant flower patches within a radius of ~100 m regardless of species or sex. The survey protocol initiated in this study follows that of Cameron et al. (2011). Across all sites, foraging bumble bees were collected on the following plant genera: Epilobium (37%), Melilotus (23%), Trifolium (19%), Potentilla (11%), Vicia (7%), and the family Asteraceae (3%). Surveys took place during both sunny and cloudy conditions, with temperatures at 24.8 ± 4.05°C and relative humidity at 41.3 ± 13.7 % R.H. All bees captured were immediately killed and put on ice for species determination and dissection. Species richness, evenness and dominance are calculated for each site to characterize the bumble bee community using EcoSim 7.72 (2010). Estimates were corrected for the site with the lowest sample size (n = 29; Table 3-1). These results were used in a correlation analysis with N. bombi infection frequency across sites. Pathogen Load Analysis To assay for N. bombi infections, the midgut of each bee was dissected by first making an incision on the ventral portion of the abdomen, then pulling out the gut tissue with forceps. Both B. moderatus and B. occidentalis were dissected in the field and gut samples were placed into 95% EtOH, while the remaining species co-detected during the survey were later rehydrated and dissected (see below). Gut contents of B. moderatus and B. occidentalis (n = 89) were placed into an Eppendorf Vacufuge® at 60°C to evaporate excess EtOH.
46 Midgut tissues were rehydrated and macerated with 50 μL of distilled water. A 5 μL aliquot of each sample was then examined under using phase contrast microscopy at 400x magnification. Each sample was screened for three minutes to determine presence/absence of the microsporidium N. bombi. During pathogen screening, I detected relatively high N. bombi infections in both B. occidentalis and B. moderatus. Due to these findings, I thought it pertinent to determine the frequency of N. bombi infections from other bumble bees in the communities surveyed. To assess pathogen loads in the dried specimens, all bumble bee specimens co-detected with B. occidentalis and B. moderatus were rehydrated (n = 168). Specimens were relaxed in a relaxing chamber for 72 hours for pliability. Each abdomen was cut along the ventral midline and 30 μL of distilled water deposited into the cavity to suspend existing midgut tissues. Once suspended, midgut tissues were extracted and macerated in 50 μL of water. Samples were then screened for pathogens using the survey and microscopy methods described above. Pairwise Fisher Exact tests were used to compare frequencies of N. bombi infections across species, sex and collection locations. Statistical analyses were conducted in the open source software package R 2.9.2. (2009). Species Distribution Models SDMs are constructed for B. occidentalis and B. moderatus in the Alaska Interior by aggregating locality data available from our survey efforts and several specimens housed at the National Pollinating Insect Database with WorldClim bioclimatic variables (Hijmans et al. 2005). To reduce model complexity, multicollinearity in the bioclimatic variables is examined using Pearson correlation coefficients (r) for both species. One variable from a pair of highly correlated variables (|r| ≤ 0.90) was removed for the final SDM. The algorithm
47 MaxEnt v3.3 (Phillips et al. 2006) was employed to construct the respective SDM, as it has been highly successful at SDM when limited presence data is available (Wisz et al. 2008). Background points (default = 10,000 points) to be utilized as pseudo-absence in the construction of each SDM were extracted from a maximum convex polygon (MCP) of the associated species’ locality data. To validate each SDM, a 20% subsample of the available data was withheld across 50 replicates and tested against the remaining 80%. Model performance is reported with an AUC statistic, where values closer to 1 indicate good performance, and values closer to 0.5 indicate poor performance (Fielding and Bell 1997). Models and MCPs were visualized in an ArcGIS 9.3 (ESRI 2006) environment and standardized to demonstrate areas of both high (1.0) and low habitat suitability (0) in the Alaskan Interior. Results Bombus occidentalis was detected in four of five survey sites, and was the dominant species (> 50%) at two sites, while B. moderatus was dominant in only one survey (Table 31). Species richness across sites was relatively similar, with the exception of the Arctic Circle, where B. occidentalis made up 87% of the bumble bee fauna detected (Table 3-1). Estimates of dominance and evenness were roughly mirrored across all sites as well, with the exception of the B. occidentalis being the dominate species at the Arctic Circle site. Bombus bifarius was the dominant species at the Allen Army site, while B. mixtus was the dominant species at Tiekel Cache site. Pathogen Load Analysis A total of 257 bumble bees (female = 165, male = 92) belonging to nine species were collected and screened for N. bombi. Workers and queens were grouped together as ‘female
48 Table 3-1. Bumble bee fauna composition across five survey sites in the Alaska Interior.
B. bifarius B. fernaldae B. flavifrons B. insularis B. jonellus B. mixtus B. moderatus B. occidentalis B. sylvicola Species Richness (± σ2) Evenness (± σ2) Dominance (± σ2)
Allen Army (n = 66) 58% 21% 14% 3% 5% -
Arctic Circle (n = 60) 2% 10% 87% 2%
Big Jim Creek (n = 29) 7% 7% 3% 79% 3%
Sourdough Creek (n = 46) 22% 2% 15% 4% 57% -
Tiekel Cache (n =56) 2% 4% 64% 21% 9%
4.54±0.580 0.60±0.003 0.59±0.005
2.95±0.480 0.24±0.010 0.87±0.002
5.00 0.37 0.79
4.50±0.340 0.62±0.002 0.56±0.003
4.24±0.420 0.54±0.004 0.64±0.004
bumble bees’, as very few queens (n=10) were collected during our survey period. At all five study locations, the frequency of N. bombi infection did not differ across male and female bumble bees (Fisher’s exact test, all p > 0.19). There is weak to no correlation between species richness, evenness or similarity with infection frequency across survey sites (|r|= 0.61, 0.20 and 0.15, respectively; Table 3-1). Furthermore, with the exception of infection frequencies between the Allen Army Airfield and Big Jim Creek (Fisher’s exact test, p < 0.05), there is no significant difference in infection frequency across survey sites (Fisher’s exact test, all p > 0.05). In the pairwise comparison of bumble bees infected with N. bombi, B. occidentalis had the highest frequency of infection (44%), except when compared to B. jonellus (Fisher’s exact test, B. occidentalis vs. B. jonellus: p = 0.12; Figure 3-1). Infection frequency is significantly higher in B. mixtus than in B. bifarius (Fisher’s exact test, B. mixtus vs. B. bifarius: p = 0.05; Figure 3-1). However when individually compared with other species
49 (except B. occidentalis), there is no significant difference in infection frequencies (Fisher’s exact test, p > 0.05). While 10% of the B. moderatus screened for N. bombi were infected, there was no significant difference in infection frequency when compared to other bumble bee species (excluding B. occidentalis). Species Distribution Models After testing for multicollinearity, 10 of the 19 bioclimatic variables were utilized for B. moderatus and eight variables for B. occidentalis. The bioclimatic variables utilized for the respective B. moderatus and B. occidentalis SDM included the following: annual mean temperature (°C), mean temperature of warmest quarter (°C), precipitation of seasonality (mm), precipitation of wettest quarter (mm), precipitation of driest quarter (mm), precipitation of warmest quarter (mm), mean diurnal range (°C), isothermality (°C), temperature seasonality (°C) and mean temperature of driest quarter (°C). From the available locality data of B. moderatus (n= 16) and B. occidentalis (n=95), I constructed a relatively poor model for B. moderatus (AUC = 0.49 ± 0.15) and a good model for B. occidentalis (AUC = 0.78 ± 0.06). The poor model performance for B. moderatus is not surprising considering the lack of data available in the SDM construction (Figure 3-2). To determine the geographic extent of favorable habitat, the minimum HSI value associated with the locality data utilized in an SDM qualified as the presence threshold value. The presence threshold value associated with B. moderatus and B. occidentalis are HSI ≥ 0.40 and HSI ≥ 0.30, respectively. Based on these threshold values, B. moderatus had the largest potential distribution (14,520 km2) of favorable bioclimatic space (HSI = 0.62 ± 0.11; Figure 3-2); whereas the potential distribution of B. occidentalis amounted to 4,816 km2 of bioclimatic space (HSI = 0.77 ± 0.18; Figure 3-2).
Nosema bombi infection frequency
50
0.50 0.45 0.40 0.35 0.30 0.25 0.20 0.15 0.10 0.05 0.00
B. bifarius (n=38)
B. flavifrons (n=26)
B. insularis (n=12)
B. jonellus B. mixtus (n=12) (n=39) Species
B. moderatus B. occidentalis B. sylvicola (n=29) (n=93) (n=7)
Figure 3-1. Proportion of bumble bees (Bombus spp.) infected with N. bombi pooled across five survey sites in the Alaska Interior. (Excludes B. fernaldae due to small sample size, n=1).
50
51
A.
B.
Figure 3-2. Potential distribution of (A) B. moderatus and (B) B. occidentalis in Alaska based on maximum entropy. Yellow markers are current survey records and white markers are natural history collection records. Darker colors indicate high HSI, whereas light colors indicate low HSI.
Discussion Bumble bees provide valuable pollination services to a wide variety of food crops and wild flowers (Goulson et al. 2008). Thus, the decline of bumble bee pollinators sparks great concern for ecological, economic and ethical reasons (Flanders et al. 2003, Whittington et al. 2004, Colla et al. 2006). While trends of decline have been observed in the United Kingdom for over 50 years, a baseline assessment of bumble bee distribution, abundance and health has only been recently accomplished in the U.S.A. (Goulson et al. 2008, Cameron et al. 2011). Cameron et al. (2011) documents decline of several bumble bee species across their native range using historic abundance estimates from natural history collections and species
52 distribution modeling techniques. Furthermore, common correlates of declining species include high N. bombi infection frequencies and intensities, and decreased genetic diversity (Cameron et al. 2011). In Alaska, B. occidentalis appears to be both a widely distributed and relatively common species (Figure 3-2; Table 3-1). In the current survey, B. occidentalis accounted for 36% of the bumble bees surveyed, while a recent exhaustive three year survey found B. occidentalis to account for < 1% of the bumble bee fauna in the contiguous USA (Cameron et al. 2011). Despite the species relatively high abundance in Alaska, B. occidentalis also appears to have the highest N. bombi infection rates (44% of 93 specimens), similar to that of conspecifics in the contiguous U.S.A. (37% of 129 specimens, Cameron et al. 2011). While commercially reared bumble bees have been documented to forage outside of greenhouses (Whittington et al. 2004), which may explain the transmission of pathogens to wild populations (Colla et al. 2006), the populations surveyed in Alaska are relatively isolated from any agriculture utilizing commercially reared bumble bee pollinators. Therefore, it is possible that the infection levels associated with B. occidentalis in Alaska reflect environmental pathogen dynamics and are not the result of pathogen spillover from commercial operations. In the current study, B. moderatus was detected in two of the five survey sites, and was the dominant species in one site (Table 3-1). Of the nine bumble bees detected in our surveys, B. moderatus was the third most common species (11%), but did not differ in infection frequency from most species, but was significantly less infected than B. occidentalis (Figure 3-1). These results are not particularly alarming, as N. bombi infection rates are highly variable across bumble bee species globally (Fisher and Pomeroy 1989,
53 Whittington and Winston 2003, Colla et al. 2006). However, considering the trajectory of decline in phylogentically related species in Canada and the contiguous U.S.A. a further investigation is necessary to determine what biological correlates may exist in facilitating robust populations of Bombus s. str. Alaska is needed (Colla and Packer 2008, Grixti et al. 2009, Cameron et al. 2011). Furthermore, while B. moderatus is distributed in western Canada, no study has evaluated its current status in light of North American bumble bee decline. Nosema bombi is suggested as the pathogen leading to the collapse of commercial populations in rearing facilities (Flanders et al. 2003), and has been speculated, along with other pathogens, to have ‘spilled over’ into adjacent wild populations (Whittington et al. 2004, Colla et al. 2006) from commercial operations. However, several studies have shown that a heavy N. bombi infection is not detrimental to colony survival in B. occidentalis (Whittington and Winston 2003) and the closely related European species B. terrestris (Fisher and Pomeroy 1989). While N. bombi has been the focus of investigations of bumble bee decline in North America (Cameron et al. 2011), there are a host of other pathogens that afflict bumble bees (Macfarlane et al. 1995). Pathogens that have been studied as they relate to impaired bumble bee foraging ability and nest failure include the protozoans Crithida bombi and Apicystis bombi, as well as the tracheal mite Locustacarus buchneri (Durrer and Schmid-Hempel 1994, Imhoof and Schmid-Hempel 1999, Colla et al. 2006). For example, the pathogen C. bombi can be successfully transmitted through a floral vector by foraging bumble bees and cause novel infections (Durrer and Schmid-Hempel 1994), leading to decreasing the ability to forage on morphologically complex flowers (Otterstatter et al. 2005).
54 While our study assesses a narrow window in bumble bee summer phenology, it has been suggested that pathogen infection frequencies in foraging workers may not differ substantially within a season (Colla et al. 2006). Furthermore, it has been found that the delay to pathogen infection within a nest decreases over time (Imhoof and Schmid-Hempel 2006). Therefore our narrow sampling effort, which was considerably late in the season for some species like B. bifarius, as mostly males were detected, may reflect the highest infection frequency in wild populations for the year. However, in the Arctic Circle site, the majority of the bumble bees detected were workers, of which 33% were found to be infected with N. bombi. It is possible that these workers all came from a single nest, which may explain why many were infected (Imhoof and Schmid-Hempel 2006), but perhaps unlikely considering current estimates of nest contribution of foraging workers to a floral patch (Strange unpublished data). As very few males were found in our northern survey sites, and the worker bumble bees observed had pollen loads in their corbicula (J. Koch, pers. obs.), it can be suggested that nests were still producing gynes (unmated queens), males and possibly workers. Current molecular data suggests that the N. bombi detected in North American bumble bees is the same species as the N. bombi found in Europe (Cameron et al. 2011). However, whether the N. bombi detected in Alaskan Bombus s. str. is the same strain detected in both North America and Europe remains to be studied. The abundance of Alaskan B. occidentalis and B. moderatus, as well as high pathogen prevalence associated with B. occidentalis may provide insight on the potential role N. bombi plays in population dynamics and nest success. More studies are necessary to determine whether finer genetic difference may exist in the N. bombi detected in North American bumble bees, as well as a discussion
55 on what levels of virulence, pathogenicity and dispersal ability are required to cause a massive extinction of phylogentically related species. Literature Cited Bertsch, A., M. Hrabé de Angelis, and G.K.H. Przemeck. 2010. A phylogenetic framework for the North American bumble bee species of the subgenus Bombus sensu stricto (Bombus affinis, B. franklini, B. moderatus, B. occidentalis & B. terricola) based on mitochondrial DNA markers. Beitr äge zur Entomologie 60: 229 – 242. Cameron, S.A., J.D. Lozier, J.P. Strange, J.B. Koch, N. Cordes, L.F. Solter, and T.L. Griswold. (2011) Patterns of widespread decline in North American bumble bees. PNAS doi:10.1073/pnas.1014743108. Colla, S.R., and C.M. Ratti. 2010. Evidence for the decline of the Western Bumble bee (Bombus occidentalis Greene) in British Columbia. Pan. Pac. Entomol. 86:32-34. Colla, S. R., and L. Packer. 2008. Evidence for the decline of Eastern North American Bumble bees, with special focus on Bombus affinis Cresson. Biodivers. Conserv. 17: 13791391. Colla S.R., M.C. Otterstatter, R.J. Gegear, and J.D. Thomson. 2006. Plight of the bumble bee: pathogen spillover from commercial to wild populations. Biol. Conserv. 129: 461-467. Durrer, S., and P. Schmid-Hempel. 1994. Shared use of flowers leads to horizontal pathogen transmission. P. Roy. Soc. Lond. B. Bio. 258: 299-302. Evans, E., R. Thorp, S. Jepsen, and S.H. Black. 2008. Status Review of Three Formerly Common Species of Bumble bee in the Subgenus Bombus: Bombus affinis (the rusty patched bumble bee), B. terricola (the yellow banded bumble bee), and B. occidentalis (the western bumble bee). The Xerces Society of Invertebrate Conservation, Portland, Oregon. ESRI. 2006. ArcGIS 9. 2. ESRI, Redlands, California. Fielding, A.H., and J.F. Bell. 1997. A review of methods for the assessment of prediction errors in conservation presence/absence models. Environ. Conserv. 24:1:38-49 Fisher, R.M., and N. Pomeroy 1989. Incipient colony manipulation, Nosema incidence and colony productivity of the bumble bee Bombus terrestris (Hymenoptera: Apidae). J. Kansas Entomol. Soc. 62: 581-589. Flanders, R.V., W. F. Wehling, and A. L. Craghead. 2003. Laws and regulations on the import, movement, and release of bees in the United States. In K. Strickler and J. H. Cane (eds.) For Nonnative Crops, Whence Pollinators of the Future? Thomas Say Publications in Entomology: Proceedings. Entomological Society of America,
56 Lanham, Maryland. Pp. 99-111. Grixti, J.C., L.T. Wong, S.A. Cameron, and C. Favret. 2009. Decline of bumble bees (Bombus) in the North American Midwest. Biol. Conserv. 142: 75-84. Gotelli, N.J., and G.L. Entsminger. 2010. EcoSim: Null models software for ecology. Version 7. Acquired Intelligence Inc. & Kesey-Bear. Jericho, VT 05465. http://garyentsminger.com/ecosim.htm. Goulson, D., G.C. Lye, and B. Darvill. 2008. Decline and conservation of bumble bees. Annu. Rev. Entomol. 53: 191-208. Hijmans, R.J., S.E. Cameron, J.L. Parra, P.G. Jones, and A. Jarvis. 2005. Very high resolution interpolated climate surfaces for global land areas. Int. J. Climatol. 25: 1965–1978 [available at www.worldclim.org]. Imhoof, B., and P. Schmid-Hempel. 1999. Colony success of the bumble bee, Bombus terrestris, in relation to infections by two protozoan parasites, Crithidia bombi and Nosema bombi. Insectes Sociaux 46: 233-238. Lozier J.D., and S.C. Cameron. 2009. Comparative genetic analyses of historical and contemporary collections highlight contrasting demographic histories for the bumble bees Bombus pensylvanicus and B. impatiens in Illinois. Mol. Ecol. 18: 1875-1886. MacFarlane, R.P., J.J. Lipa, and H.J. Liu, 1995. Bumble bee pathogens and internal enemies. Bee World 76: 130–148. McFrederick, Q. S., and G. LeBuhn. 2006. Are urban parks refuges for bumble bees Bombus spp. (Hymenoptera: Apidae)? Biol. Conserv. 129: 372-382. Milliron, H.E. 1971. A monograph of the western hemisphere bumble bees (Hymenoptera: Apidae; Bombinae) I. The genera Bombus and Megabombus subgenus Bombias. Mem. Entomol. Soc. Can. 82: iii- 80. Milliron, H.E. 1973. A monograph of the western hemisphere bumble bees (Hymenoptera: Apidae; Bombinae) II. The genus Megabombus subgenus Megabombus. Mem. Entomol. Soc. Can. 89: 81-237. Otterstatter, M.C., R.J. Geager, S.R. Colla, and J.D. Thomson. 2005. Effects of parasitic mites and protozoa on the flower constancy and foraging rate of bumble bees. Behav. Ecol. Sociobiol. 58(4): 383-389. Phillips S.J., R.P. Anderson, and R.E. Schapire. 2006. Maximum entropy modeling of species geographic distribution. Ecol. Model. 190: 231-259.
57 Thorp, R. W., and M. D. Shepherd. 2005. Profile: Subgenus Bombus. In M.D. Shepherd, D. M. Vaughan, and S. H. Black (eds.) Red List of Pollinator Insects of North America. CDROM Version 1 (May 2005). The Xerces Society for Invertebrate Conservation, Portland, Oregon. Whittington, R., M.L. Winston, C. Tucker, and A.L. Parachnowitsch. 2004. Plant-species identity of pollen collected by bumblebees placed in greenhouses for tomato pollination. Can. J. Plant Sci. 84: 599-602. Whittington, R., and M.L. Winston. 2003. Effects of Nosema bombi and its treatment fumagillin on bumble bee (Bombus occidentalis) colonies. J. Invertebr. Pathol. 84: 54-58. Williams, P.H., M.B. Araujo, and P. Rasmont. 2007 Can vulnerability among British bumblebee Bombus species be explained by niche position and breadth? Biol. Conserv. 138: 493-505. Williams, P.H., and J.C. Thomas. 2005. A bumblebee new to the New World: Bombus distinguendus (Hymenoptera: Apidae). Can. Entomol. 137: 158–1. Wisz, M.S., R.J. Hijmans, J. Li, A.T. Peterson, C.H. Graham, A. Guisan, and NCEAS Predicting Species Distributions Working Group. 2008. Effects of sample size on the performance of species distribution models. Divers. Distrib. 14: 763-77.
58 CHAPTER 4 SUMMARY AND CONCLUSIONS
Despite the ecological and economic importance of bumble bee pollinators, several species across the globe have been documented to be declining across their native distribution. Declines of bumble bees were first documented in the United Kingdom, and more recently in North America and Japan. The geographic size of North America makes it difficult to assess bumble bee declines, and until recently, have been limited to a handful of localized studies. However, this study illustrates the wealth of historic specimen data housed in multiple Natural History Collections (NHC) across the U.S. to estimate the historic distribution and abundance of North American bumble bees. This study documents for the first time the U.S. national decline and conservation status of several North American bumble bees at a large geographic scale. While survey efforts were limited to 3 years, and may not capture local bumble bee community dynamics, it does provide alarming evidence that bumble bees that were historically abundant are not being detected in the numbers previously reported in several studies from the 1960s to 1990s. The results of this study are consistent with patterns of local declines across the North American continent (e.g. San Francisco, CA; Mt. Ashland, OR; Ontario, Canada). Furthermore, based on the ecoregions associated with bumble bees, there appears to be a geographic pattern in their decline. Bombus occidentalis has not been detected in its historic distribution and modeled habitat west of the Sierra-Cascade Crest, while B. affinis and B. terricola appear to be isolated to a very small part of their historic range. Finally, B. pensylvanicus, which is abundant where currently detected, appears to be absent in its native habitat in the northeast U.S.
59 While several species of bumble bee are declining across their native distribution, others remain fairly abundant, B. vosnesenskii and B. bifarius in the west, and B. impatiens and B. bimaculatus in the east. Two of these species, B. vosnesenskii and B. impatiens are promising bumble bee pollinators of agricultural crops, with the latter species being currently used in agriculture. However, with the pressure to develop a western bumble bee pollinator in the absence of the once commercially reared B. occidentalis, B. impatiens is currently being shipped into the western U.S. and Canada, outside of its native habitat. Considering the ecological ramifications of competitors and the spread of invasive pathogens, it is critical that a western bumble bee pollinator, like B. vosnesenskii is developed for agricultural purposes. Finally, since that the prevailing theory on the decline and localized extinction of B. occidentalis suggests pathogen transmission of Nosema bombi across wild populations, further work is needed to assess possible differences in the genetic strain of N. bombi associated with Alaskan B. occidentalis. In the Alaskan study, B. occidentalis was arguably the most abundant bumble bee, despite it having the highest prevalence of N. bombi. Furthermore, a sister species B. moderatus is also relatively abundant, and appears to be associated with N. bombi as well. As B. occidentalis, B. affinis, B. terricola and B. moderatus are closely related sister taxa, with the former four declining in the contiguous U.S., a further assessment is recommend to determine whether there is a genetic correlate of N. bombi susceptibility. This study provides a model in which to assess the historic distributions, abundance and conservation status of bee species using NHCs. While the data is usually inaccessible, as they are on pins in insect drawers, there is a great deal of effort across multiple institutions in the U.S.A. and Canada to digitize NHCs. The database of >73,000 specimens constructed in
60 part over the course of this study is housed at the National Pollinating Insect Collection (NPIC) in Logan, Utah. Pleases contact the NPIC curator to access the relational database compiled in this study.
61
APPENDICES
62
APPENDIX A
63 GBIF records utilized to construct the SDM of B. affinis (A) and B. terricola (T). Institution Bombus of Canada Insects Knerer collection/Gschwendtner property Entomology Collection Illinois Natural History Survey New Mexico Biodiversity Collections Consortium database Borror Laboratory of Bioacoustics Morandin PhD Thesis/La Crete, Alberta
GBIF Link http://data.gbif.org/data sets/resource/525 http://data.gbif.org/data sets/resource/625 http://data.gbif.org/data sets/resource/1945 http://data.gbif.org/data sets/resource/7911 http://data.gbif.org/data sets/resource/225 http://data.gbif.org/data sets/resource/7856 http://data.gbif.org/data sets/resource/1767 http://data.gbif.org/data sets/resource/1946
Date accessed
Species
31/03/2009
A
31/03/2009
A,T
6/4/2009
A
6/4/2009
A,T
6/4/2009
A,T
6/4/2009
T
6/4/2009
T
6/4/2009
T
64
APPENDIX B
65 February 2, 2011 Jonathan B. Koch Department of Biology Utah State University 5305 Old Main Hill Logan, UT 84322-5305 Phone: 435-757-4025 Email:
[email protected] Uludag Bee Journal Gazcılar Cad. No. 9 / 2 16220 BURSA Tel: 0 224 223 8085 Fax: 0 224 224 3964 To Managing Editor: I am preparing my thesis in the Biology department at Utah State University. I hope to complete me degree in the Spring of 2011. An article, Constructing a species database and historic range maps for North American bumble bees (Bombus sensu stricto Latrielle) to inform conservation decisions, of which I am first author, and which appeared in your journal (2009, 9(3): 97-108), reports an essential part of my thesis research. I would like permission to reprint it as part of a chapter in my thesis. Please note that USU sends theses to Bell & Howell Dissertation Services to be made available for reproduction. I will include an acknowledgment to the article on the first page of the chapter, as shown below. Copyright and permission information will be included in a special appendix. If you would like a different acknowledgment, please so indicate. Please indicate your approval of this request by signing in the space provided, and attach any other form necessary to confirm permission. If you charge a reprint fee for use of an article by the author, please indicate that as well. If you have any questions, please call me at the number above or send me an e-mail message at the above address. Thank you for your assistance. Jonathan Berenguer Koch
66
67
APPENDIX C
68 THE DECLINE AND CONSERVATION STATUS OF NORTH AMERICAN BUMBLE BEES1
Abstract Bumble bees (Bombus) deliver important ecosystem services as insect pollinators of numerous wild and managed flowering plants. However, within the past decade several regional studies have reported decreased bumble bee community richness, and localized extinction. Despite rising concerns on the ecological and economic implications of bumble bee decline in both natural and agricultural ecosystems, no study has fully assessed the geographic scope of North American bumble bee decline. The present study investigates the distribution, relative abundance and conservation status of eight historically abundant bumble bee species. Historic data is acquired by constructing a relational database of >73,000 specimen records of the study species from 48 Natural History Collections, while current abundance and distribution is assessed with an intensive, 3-year nationwide survey of >16,000 specimens. The results show that the relative abundance of four species of bumble bees have declined by up to 96%, and are estimated to no longer persist in up to 62% of ecoregions where they were historically present. This investigation is consistent with several North American studies reporting declines and localized extinctions, and significantly contributes to the alarming trend of bumble bee decline worldwide. Introduction Despite the conservation goals set for the year 2010 by the United Nations Convention of Biological Diversity, biodiversity decline continues to be exacerbated by 1
Appendix C has been published in part in the Proceedings of the National Academy of Sciences. As a major coauthor I have retained the copyright for this work so no release was necessary. Please cite as Cameron, S.A., Lozier, J.D., Strange, J.P., Koch, J.B., Cordes, N., Solter, L.F., Griswold, T.G. 2011. Patterns of widespread decline in North American bumble bees. PNAS 108: 662-667.
69 human activities (1). The major threats to biodiversity include habitat degradation, pathogen introduction, climate change and overharvesting. While major cultural strides have been made in the past decade to maximize ecologically guided policies, approximately 38% of the 45,000 species evaluated by the International Union for the Conservation of Nature (IUCN) continue to be threatened with extinction (2). Insects comprise only 3% of the biodiversity evaluated by the IUCN, yet they account for 57% of described species globally (2), and are one of the most species rich taxonomic groups on earth (3). Numerous species of insect have also been found to provide critical ecosystem services (4, 5). Ecosystem services are resources (e.g. clean water, soil regeneration, nutrient cycle) produced by biotic and abiotic interactions in the natural environment. Notable examples of ecosystem services include nitrogen volatilization by dung beetles, pollination of flowering plants by an assortment of bees, and pest control by predatory beetles and parasitic wasps. Insects also serve as indicators of ecosystem health, and have provided a foundation for monitoring and mitigation protocols (6). While the provision of ecosystem services by insects is not the sole reason why their conservation should be enacted, the quantification of ecological or economic loss is certainly helpful in directing policy that seeks to conserve the environments required by insects to support their services (4, 5). Bumble bees (Bombus) are important insect pollinators of numerous wild and managed flowering plants. Their morphological and behavioral adaptations have set them apart from the European honey bee (Apis mellifera) for commercial pollination, establishing them as the second most important managed pollinator globally (7). Of the
70 20 agricultural food crops they are documented to pollinate, they are most efficient at pollinating greenhouse tomatoes, an agricultural crop valued at $15.4 billion annually (7). Aside from the economic and agricultural benefits, bumble bees are also known to facilitate successful reproduction of a variety of different wild flowering plants globally. In fact, the decline of generalized bumble bee pollinators may have catastrophic implications on the proliferation of flowering plants (8), the herbivores that consume them and overall ecosystem function (9). However, in the past several decades, bumble bees and many other bee pollinators have been documented to be declining throughout various portions of their range in both Europe and North America (8, 10, 11, 12). The most well supported correlate of bumble bee decline is human urbanization and agricultural intensification (13, 14, 15), as it reduces the availability of both floral and habitat resources (5). A more recent hypothesis of bumble bee decline in North America suggests that a novel strain of Nosema bombi, an obligate intracellular gut pathogen, may have been transmitted from commercial to wild populations facilitating localized extirpations (16, 17). Whether the cause of bumble bee decline is due to a single factor, or interacting factors at various spatial and temporal scales (11), the extent of bumble bee decline, especially in North America, is known only from narrow regional studies (13, 14, 18, 19). A major impediment in assessing the geographic extent of bumble bee decline in North America is the lack of baseline historic data (11). However, several studies have shown the effectiveness of applying data associated with pinned specimens in Natural History Collections (NHC) to document changes in community richness and abundance (e.g. 8, 13, 14). Furthermore, recent advances in species distribution modeling techniques
71 have allowed accurate constructions of the potential distribution of species in both their native and non-native ranges using NHC data (20). The goals of this study is to assess the changing distributions and relative abundances of declining North American bumble bees in contrast to bumble bees considered stable using NHC and contemporary surveys. Compilation of these two data sources will also allow for an estimation of the conservation status of the target bumble bee species in accordance with the goals set by the United Nations Convention of Biological Diversity to establish the extent of geographic decline of imperiled species (1). Methods Study Species. As there are approximately 50 bumble bee species in North America alone (21), it would be unfeasible to compile historic data on all the species given the pressing concerns of bumble bee decline by organizations like the National Academy of Sciences (22) and Xerces Society for Invertebrate Conservation (23). Thus, this study focuses primarily on species that were considered abundant historically, with special attention to species documented to be declining in regional studies (e.g. 13, 14, 18, 24). To better understand the differential dynamics affecting various species, putatively declining species were studies alongside putatively stable species. Stable species were chosen based on published reports of species abundance and the availability of large numbers of specimens in NHCs. In the western U.S.A., the bumble bee research targets are B. bifarius (stable), B. occidentalis (declining) and B. vosnesenskii (stable). In the eastern U.S.A., the bumble bee research targets are B. affinis (declining), B. bimaculatus (stable), B. impatiens (stable), B. pensylvanicus (declining) and B. terricola (declining).
72 Natural History Collections. NHCs are repositories that house thousands, sometimes millions of insect specimens, some collected as far back as the late 17th century (20). However, the data associated with these specimens are often difficult to analyze as they are not digitized. To elucidate the general patterns of distribution and historic relative abundance of the target bumble bee species, specimens were examined, and all data from the label (e.g. collection data, collection location, collector, etc.) were compiled and digitized from multiple NHC across the U.S.A (Appendix E). Each specimen was affixed with a barcode ID, and the label data and species identification associated with the specimen were entered into a relational database. Because the majority of specimen labels lack actual geographic coordinates, localities were estimated using a variety of different digital tools including GoogleEarth (http://earth.google.com), TopoQuest (http://topoquest.com/), Earth Point (http://earthpoint.us) and Lat-Long.com (http://latlong.com/). Associating geographic coordinates with bumble bee locality data was contingent on the quality of the locality information supplied (e.g. county-level versus distances and directions from a populated place). Georeferenced data were utilized in the construction of each species‟ SDM, and in the analyses of relative abundance and conservation status. The specimens digitized in this study represent much of the known distribution of the target species in the continental U.S.A., the southern region of Canada, and populated areas of Alaska. However, in this study, specimen records outside of the contiguous U.S.A. were excluded in the final analyses. Contemporary Standardized Surveys of U.S. Bumble Bees. During the spring-fall seasons (April - October) from 2007-2010, bumble bee communities were surveyed across the contiguous U.S.A. Bumble bees were surveyed opportunistically as it is
73 difficult to assess bumble bee abundance a priori. The survey locations were selected using a variety of different methods including NHC specimen labels, publications and SDM. The survey effort was divided into a „western‟ and „eastern‟ group as the distribution of many North American bumble bees in the contiguous U.S.A. are roughly divided along the 104th western longitude. Furthermore, this geographic delineation appears to have evolutionary significance considering the distribution of color patterns associated with North American bumble bees (21). After identifying a potential survey site, a brief informal observation was made to confirm the presence of bumble bees, and an adequate floral patch from which bumble bees were visiting. Each site was surveyed for 1 ± 0.5 SD survey hours with aerial insect nets. Surveys were conducted by walking through floral patches and collecting all observed bumble bees regardless of species or sex. At each survey site the average wind speed (kph), temperature (°C), relative humidity (%), cloud cover (%) and floral hosts were recorded. Processing of specimens was conducted differently for both the western and eastern collaborators. In the east, bumble bee were placed in plastic vials and chilled on ice until the end of the collection period. Chilled specimens were then identified to species and sex using several different identification tools, color guides and pinned reference collections. After species identification, specimens of non-targets were released, while targets were kept for concurrent studies. In the west, bumble bees were placed into potassium cyanide and later identified in the lab. See Appendix D for a summary of the current survey. Species Distribution Models. To predict the historic distribution of the target bumble bee species the statistical niche modeling program MaxEnt v3.3 was employed (25). The
74 principle of maximum entropy exploits the application of entropy to information (i.e. data aggregated with a set of constraints) so as to produce the least biased result relative to a probability distribution. The MaxEnt algorithm assumes the Gibbs probability distribution, which is the sum of the exponential functions of the independent variables utilized (i.e. bioclimatic variables) normalized to sum to one over the geographic space being modeled, where one suggests presence and zero suggests absence (25). Unlike the 16 available algorithms utilized in SDM that require presence/absence datasets, MaxEnt is able to construct a SDM with presence-only datasets. As most NHC rarely document the absence of a species, this approach is particularly advantageous for the type of data currently available (20). To build an SDM for each bumble bee species, occurrence records were first aggregated with 19 WorldClim bioclimatic variables (26) in ArcGIS 9.3 (27). These bioclimatic variables summarize annual averages, seasonality and extremes of temperature and precipitation that have been interpolated from global weather stations and are averaged over a period ranging from ~1950-2000. To limit the number of bioclimatic variables used in SDM construction, pair-wise Pearson‟s correlation coefficient (r) were calculated using 1,000 random points within the western and eastern geographic extent separately. In each pair-wise comparison, one bioclimatic variable was retained to construct SDMs when the comparisons yielded a |r| ≥ 0.90. Pearson‟s correlation coefficients were calculated in R v2.11.1 (28). Once the bioclimatic variable data set was simplified for the western and eastern U.S.A., SDMs were executed using default parameters as prescribed by Phillips et al. (2006). In the MaxEnt package, the prescribed 10,000 background points (25) used to
75 generate pseudo absence were selected only from the geographic region where bumble bee targets were historically known to occur (29, 30) so as to not inflate model evaluation statistics (31). If multiple records occurred within the same bioclimatic grid cell (5minute resolution) or fell outside of the geographic extent considered in this study, they were excluded in the analysis. In the MaxEnt framework, presence/absence is defined by habitat suitability, where values closer to zero suggest low habitat suitability, and values closer to one suggest high habitat suitability. For comparative purposes across species, habitat suitability values for each SDM were reclassified using a 10-fold equal interval between zero and one. Thus, in the reclassified SDM, the maximum habitat suitability value was set to one and minimum habitat suitability value set to zero. The SDMs were evaluated for each species separately and averaged over 50 replicates using a random 80% subset of localities to train the model and 20% reserved for testing using the area under the receiver operating curve (AUC) statistic. The AUC is a model evaluation statistic that estimates the predictive performance of an SDM. AUC values closer to one suggest good predictive performances, whereas values closer to 0.5 suggest poor predictive performance (32). Relative Abundance Analysis. Spatial and temporal biases may occur when inferring relative changes in species abundance and distribution using NHC records (20). However, robust NHC datasets of bumble bees have proven to be both informative and accurate in documenting localized extinction, especially when coupled with robust standardized surveys (13, 18, 19). In this study the relative abundances of the eight target species, as detected with the standardized survey (2007-2009), are compared to their historical relative abundances based on the NHC bumble bee database. Non-target
76 species that were identified in the surveys were not included in the total species counts used in the relative abundance analysis. Finally, to minimize any species collector bias, bumble bee data was assessed only at broad geographic and temporal scales. Specimen data was pooled from 1900-1999 from the U.S. bumble bee NHC database to represent historical abundances for the six target species. Data from 20002006 was excluded due to generally low collection efforts documented in NHC during this time frame. It should also be noted that between 2000 and 2006, declines of some western bumble bees were being documented in North America (Thorp 2005) so including data from this period could confound estimates of historical abundances. Specimen data prior to the 1900s was excluded because of sporadic collection histories and overly generalized locality information (e.g. “Utah”, “Northwest Territory”). Considering the temporal depth (100 years) and geographic breadth (~10,000 historic collection locations) representing the abundance of each target species, this study makes the assumption that the collection history of each NHC is not strongly biased toward any one species (Appendix E). While the current survey was geographically broad, eight eastern states were not visited and are excluded in the final analysis (i.e. Delaware, Florida, Maryland, Michigan, New Hampshire, New Jersey, Rhode Island, and West Virginia). The relative abundance analysis was portioned into four regional categories because three of the eight target bumble bee species have narrow geographic distributions: Global west = B. bifarius and B. occidentalis; Pacific west = B. bifarius, B. occidentalis and B. vosnesenskii; Global east = B. bimaculatus, B. impatiens and B. pensylvanicus; Northern/coastal east = B. affinis, B. bimaculatus, B. impatiens, B.
77 pensylvanicus and B. terricola. The states included in each geographic category are listed in Fig. 4. Relative abundance was calculated for each regional category as the number of individuals collected for each target species, divided by the total number of all targets collected in a given region. Z-tests of equal proportions (33) were applied to compare changes in historic and current relative abundances across the four regional categories (Eq. 1). This statistic was applied as it is has been useful in inferring relative changes in species composition of bumble bee communities (18).
where ph = estimated historic relative abundance, pc = estimated current relative abundance, nh = total historic abundance across all target bumble bee species and nc = total current abundance of all target bumble bee species. Non-statistical comparisons of relative abundance were also made for each decade. Conservation Status. To estimate the conservation status of the target bumble bee species, parametric (Eq. 2; 34) and non-parametric (Eq. 3; 35) conservation indices were applied to data from the NHC database effort and contemporary survey. The parametric conservation index utilized in this study assumes that the observation of a species at a given point and location in time is stationary and random, whereas the non-parametric index assumes the Weibull extreme value distribution. The assumption of an extreme value distribution is useful when estimating maximum or minimum values from a large dataset (35). Both indices calculate the probability of persistence (P) at given time T (usually the present), based on historic occurrences (34).
78 Because the decline of bumble bees in North America appears to have a geographic pattern (13, 14, 18), the conservation status of each species was delineated across ecoregions (36; Appendix F). Applying ecoregions to this analysis not only provides ecologically meaningful inference, but may also identify geographic patterns of decline that other geographic delineations may not capture (i.e. „county‟ or „state‟ geographic units). Only data that was georeferenced was utilized in the final assessment and then aggregated to ecoregion polygons.
where tn = the difference between the first and last documented occurrence, T = the difference between the first occurrence and most recent effort to establish occurrence (i.e. contemporary survey) and n is the total amount of documented occurrences (i.e. specimens) during tn. Large values of P suggests high persistence, whereas small values of P suggests low persistence. Both P1 and P2 were calculated for each ecoregion and species, then projected onto a map and associated with a colored ramp. Results Natural History Collections. In total, 73,759 individual specimens of the target species were digitized from 48 federal, state, private and public NHC (Figure C-1; Appendix E).This retroactive data capture represents the largest attempt to digitize historic bumble bee specimens across a broad sample of NHC to date. Digitization of historic specimens for each species is as follows: 2,516 B. affinis, 19,115 B. bifarius, 3,027 B. bimaculatus, 8,913 B. impatiens, 10,151 B. occidentalis, 9,544 B. pensylvanicus, 6,282 B. terricola and
79 14,211 B. vosnesenskii. Approximately 86% of specimens were associated with a location description that had enough information to be georeferenced. Data is served on the National Pollinating Insect Database, housed at the National Pollinating Insect Collection in Logan, UT U.S.A. Data will be shared on the Global Biodiversity Information Facility website (http://gbif.org), an open access biodiversity database. Contemporary Standardized Surveys of U.S. Bumble Bees. In total, 9,006 and 7,832 bumble bees across 37 different bumble bee species were netted west and east of the 104th western longitude, respectively, at 382 locations (Figure C-2). In the western U.S. we detected 2,760 B. bifarius (stable, 30% of total western fauna surveyed), 129 B. occidentalis (declining, 2% of western fauna surveyed), and 902 B. vosnesenskii (stable, 10% of western fauna surveyed). In the eastern U.S. we detected 22 B. affinis (declining, < 1% of eastern fauna surveyed), 1,033 B. bimaculatus (stable, 13% of eastern fauna surveyed), 3,128 B. impatiens (stable, 40% of eastern fauna surveyed), 532 B. pensylvanicus (declining, 7% of eastern fauna surveyed) and 31 B. terricola (declining, < 1% of eastern fauna surveyed) (Appendix 2). An additional survey by the author in 2010 did not yield B. occidentalis in the Pacific Northwest or in San Francisco, CA despite locally intensive collection efforts (Appendix H). All 2010 surveys were not included in this analysis. See Chapter 4 for a discussion of the 2010 survey effort in Alaska, where B. occidentalis was detected in relatively high abundance. Species Distribution Models. To construct each SDM 2,063 B. affinis, 2,546 B. bimaculatus, 6,822 B. impatiens, 5,903 B. pensylvanicus, 3,667 B. terricola, 4,262 B. bifarius, 3,302 B. occidentalis and 1,960 B. vosnesenskii historic locality records were applied (Figure C-1). This data represents the known distribution of these species in the
80 contiguous U.S.A., corresponding to classic extremity maps of the species (e.g. 29, 30). The reduced bioclimatic variable dataset used in SDM construction for eastern species were annual mean temperature, mean diurnal range, isothermality, maximum temperature of the warmest month, temperature annual range, mean temperature of the wettest quarter, mean precipitation seasonality, and precipitation of the warmest quarter. For the western species, the bioclimatic variables used in SDM construction were annual mean temperature, mean diurnal range, isothermality, temperature seasonality, maximum temperature of the warmest month, minimum temperature of the coldest month, mean temperature of the wettest quarter, mean temperature of the driest quarter, annual precipitation, precipitation of the driest month, precipitation seasonality, and precipitation of the warmest quarter. Overall, the niche models (Figure C-3) produced by MaxEnt reflect what is known of the historical range of these species in the contiguous U.S.A. AUC values generally indicated good model performance (all test AUC values > 0.80 averaged over 50 subsampled MaxEnt runs) except for B. pensylvanicus (AUC = 0.731 ± 0.015 SD) (Appendix G). However, the distribution of B. pensylvanicus covers the vast majority of the geographic extent used for modeling. Thus the observed AUC for B. pensylvanicus likely reflects the very large area of occurrence for this bumble bee as observed in the NHC data themselves (Figure C-1), rather than poor model performance. The SDM should therefore represent good approximations for areas where we would expect the target species to occur given historical information about their occurrences. Relative Abundance Analysis. Comparisons of the historical and current data revealed extensive range reductions (Figure C-3A, D, G, H) and significant decreases in relative
81
Figure C-1. Digitized natural history collection records for the eight target Bombus species. See Appendix for detailed summary.
Figure C-2 Map of the 382 sites surveyed for Bombus from 2007-2009. See Appendix D for detailed summary.
82 abundance in all four species suspected of population decline (all P < 0.001; Figure C-4); each was absent from significantly more sites predicted to have high occurrence probabilities than were stable species. Declines in relative abundance appear only within the last 20-30 years, with relative abundance values from current surveys lower than in any decade of the last century (Figure C-5). The four purportedly stable species showed no clear patterns of range reduction (Figure C-3) or consistent declines in relative abundance (Figure C-4). Historically, B. occidentalis and B. pensylvanicus had among the broadest geographic ranges of any bumble bee species in North America (Figure C-1, C-3A, D). Yet the current surveys detected B. occidentalis only throughout the intermountain west and Rocky Mountains; it was largely absent from the western portion of its range (Figure C-3A, 4). Bombus pensylvanicus (Figure C-3D, C-4) was not observed across most of its historical northern and eastern range and was abundant only in the south across the Gulf States and in the western portion of the Midwest. Similarly, B. affinis (Figure C-3G, C-4), which was once found throughout the eastern U.S.A and northern Midwest, was detected only in small numbers (N = 22) at three locations in Illinois and one in Indiana. Bombus terricola (sister species to B. occidentalis [21]), which formerly occupied northern and upland regions of the east and Midwest (Figure C-3H, C-4), was less abundant relative to the historical data (Figure C-4) but still detectable at a number of northeastern and highelevation Appalachian Mountain sites (N = 31). Conservation Status. Estimating the probability of persistence (P) of declining bumble bee species across ecoregions revealed interesting geographic patterns (Figure C6). Both parametric and non-parametric indices converge on similar trends in persistence
Figure C-3. Summary of Bombus individuals surveyed from 382 collection locations for eight target species, including hypothesized declining (B. occidentalis, B. pensylvanicus, B. affinis and B. terricola) and stable (B. bifarius, B. vosnesenskii, B. bimaculatus and B. impatiens) species. Sizes of pie charts indicate total number of individuals surveyed at each location; size of the orange segment indicates the fraction of the respective target species collected at that site (some locations pooled across sites for visual clarity; for detailed data refer to Appendix 2). Underlying grayscale shading represents the modeled potential distribution of each species from 6,544 unique presence localities obtained from natural history collections.
83
Figure C-4. Four regional comparisons of pooled historical (1900-1999; black bars) and current relative abundances (2007-2009; gray bars) for six North American bumble bee species using z-tests of equal proportions. (A) Global west = AZ, CA, CO, ID, MT, NM, NV, OR, SD, UT, WA, WY; B. bifarius: z = -61.71, P < 0.001; B. occidentalis: z = 61.71, P < 0.001. (B) Pacific west = CA, OR, WA; B. bifarius: z = -15.09, P < 0.001; B. occidentalis: z = 56.26, P < 0.001; B. vosnesenskii: z = 10.40, P < 0.001. (C) Global east = AL, AR, CO, CT, GA, IA, IL, IN, KS, KY, LA, MA, ME, MN, MO, MS, NC, ND, NE, NY, OH, OK, PA, SC, SD, TN, TX, VA, WI; B. bimaculatus: z = -15.70, P < 0.001; B. impatiens: z = -31.27, P < 0.001; B. pensylvanicus: z = -56.57, P < 0.001. (D) Northern/coastal east = CT, GA, IA, IL, IN, MA, ME, MN, NC, NY, OH, PA, TN, VT, VA, WI; B. affinis: z = 35.57, P < 0.001; B. bimaculatus: z = -18.40, P < 0.001; B. impatiens: z = -37.19, P < 0.001; B. pensylvanicus: z = 46.01, P < 0.001; B. terricola: z = 38.40, P < 0.001. All df = 1.
84
85
Figure C-5 Temporal trends in relative abundance for each target Bombus species in four regional comparisons (Fig. 3). Data for 1900-1999 (black axis labels; specimens pooled by decade) were taken from the Bombus natural history collections database (Fig. 1, Appendix 1), and for 2007-2009 (red axis labels) from field surveys (Fig. 2, Appendix 2). Plots of historical and contemporary relative abundances are consistent with recent declines for the less abundant bumble bee species over the last 20-30 years, with our 2007-2009 surveys recovering proportionally fewer specimens of B. affinis, B. occidentalis, B. pensylvanicus and B. terricola than in any decade of the 20th century.
86 across ecoregions, with the exception of magnitude in the P value estimated. In the parametric index, the P values were highly inflated relative to the P values estimated in the non-parametric index. This is a relic of the number of specimens associated with the value of n in the parametric index. Regardless of this statistical artifact, both conservation indices revealed similar geographic patterns in species persistence across their respective historic distribution. Bombus occidentalis persistence is estimated to be absolute (P = 1.0) in 48% of ecoregions within its historic distribution in the contiguous U.S.A (Figure C-6A). Ecoregions associated with low P are primarily west of the Sierra-Cascade Crest (e.g. Puget Lowland = P1 < 0.001, P2 = 0.06, Coast Range = P1 < 0.001, P2 = 0.06, Central California Valley = P1 < 0.001, P2 = 0.03; Appendix F), whereas ecoregions associated with absolute persistence are found in the Inter-Mountain West and Rocky Mountains. These ecological patterns are consistent with published reports (14), and the prevailing hypothesis that the subgenus Bombus (i.e. B. occidentalis and B. franklini) is declining west of the Sierra-Cascade Crest in North America (19). Estimated absolute persistence (P = 1.0) of B. affinis and B. terricola is associated with 9% and 11% of ecoregions within their respective historic range, respectively (Figure C-6G, H). Estimated absolute persistence of B. affinis is associated with ecoregions at the central portion of its historic range (i.e. Central Corn Belt Plains, Eastern Corn Belt Plains, and Interior River Valleys and Hills ecoregions). However, estimated absolute persistence of B. terricola is associated with ecoregions at the western and eastern extremities of its historic range (i.e. North Central Appalachians, Northeastern Highlands, Piedmont ecoregions). While these two species historically
87 overlapped in distribution (Figure C-1, C-3G, H), it is apparent that their current distributions no longer overlap (Figure C-2, C-6G, H). Historically, B. pensylvanicus was associated with 54 unique ecoregions in the contiguous U.S.A (Appendix F). However, based on current estimates of P, it is currently present in 37% of ecoregions within its historic distribution (Figure C-3D, C-6D). The geographic pattern suggest that B. pensylvanicus is absent primarily in ecoregions in the northeast portion of its range, as it is associated with low P values. While the current distribution of B. pensylvanicus appears to have contracted, more individuals of the species were detected in the current surveys relative to other declining species (Figure C4). Estimates of P associated with stable bumble bee species are consistent with previous results of relative abundance (Figure C-4, C-6). Stable species are associated with absolute persistence in 81 – 100% of ecoregions within their respective distributions (Figure C-6B, C, E, F). Ecoregions with estimated values of P < 0.50 are limited to the geographic edges of their historic distributions. For example, in the Northern Lakes and Forests ecoregions of northern Michigan, both B. bimaculatus and B. impatiens P is estimated to be 0.13 and 0.05 (Figure C-6E, F). However, current survey efforts were not robust in this ecoregion (Figure C-3), and future studies should expand to assess the status of bumble bees in this ecoregion. While estimates of P associated with B. bifarius are low in coastal ecoregions (e.g. Coastal Range, Puget Sound, Figure C-6B), these findings are consistent with a narrow geographic study in San Francisco, CA (14). Furthermore, based on SDM of its historic range, B. bifarius habitat suitability is not exceptionally high
Figure C-6. Probability of persistence (P) of North American bumble bees across ecoregions (EPA Ecoregions) using parametric and non-parametric conservation indices. See Supplementary Figure 1 for a description of the ecoregions applied.
88
89 in coastal ecoregions in the western U.S.A (Figure C-3B) and more extensive sampling may be required for species detection. Discussion By combing historic specimen data and broad scale surveys of bumble bee communities across the U.S.A, this study provides quantitative evidence of dramatic range-wide population declines of B. occidentalis, B. pensylvanicus, B. affinis and B. terricola (Figure3- 3A, D, G, H). The historic data suggests that these declines have occurred within the last two decades (Figure C-5), and are consistent with narrow geographic studies of bumble bee community richness and abundance (e.g. 13, 14, 18). The geographic patterns of decline of imperiled bumble bees are variable (Figure C-6A, D, G, H), suggesting that multiple stressors may be facilitating their decline (reviewed in Goulson 2008). While these species have become rare or absent throughout large areas of their historical ranges, co-occurring species, such as B. bifarius, B. vosnesenskii, B. impatiens, and B. bimaculatus, remain relatively abundant and widespread (Figure C-3B, C, E, F; C-4). Although dramatic declines of bumble bee abundance are observed across the broad national landscape, establishing absolute local extinction would require greater sampling than possible within the constraints of a 3-year nationwide study. However, by quantifying the probability of persistence (P) across biologically informative polygons like ecoregions, a view of the type of environments associated with bumble bee decline is elucidated (Figure C-6; Appendix F). This study‟s conservative interpretation of the data is that, based on historical information and the large numbers of sites and specimens surveyed, declining species have become sufficiently rare in parts of their ranges that
90 they are now difficult to detect. The persistence of residual populations beyond the geographic scope of this study is fully expected, as documented species extinction have been rare to date in both North America and Europe (11). Rather than absolute extinctions, bumble bee abundance and community richness has declined across multiple species at different spatial scales (24). In both Europe and North America, it appears that bumble bee decline is more rapid at margins of their historic distribution. However, unlike the decline of bumble bees at climatic margins of their historic distribution in Europe, North American decline is occurring at margins where historic abundance was relatively high (e.g. B. occidentalis decline is greatest west of the Sierra-Cascade crest, whereas decline of B. pensylvanicus is greatest in the north and northeast). Additional surveys of Bombus in 2010 continue to not yield B. occidentalis west of the Sierra-Cascade crest despite spatially targeted collections (Appendix H). Furthermore decline of B. affinis and B. terricola, which historically overlapped in distribution are estimated to be persistent in different ecoregions in the U.S.A. Based on the patterns of decline in imperiled North American bumble bees, multiple causes appear to be at play, possibly interacting at different spatial and temporal scales. Prior to this study, circumstantial evidence linking the timing of Bombus population declines in the Pacific west to the collapse of commercial bumble bee production in California following N. bombi infection (12, 16, 17) led to the hypothesis that N. bombi had escaped into wild populations and was responsible for the declines (16). This temporal correlation was not verified by collection of N. bombi infection data in wild bees. Nevertheless, the hypothesis became widely reported (e.g., 16, 17, 37).
91 While this study does not assess pathogen frequency, a concurrent study has found elevated N. bombi infections in imperiled North American bumble bees. Furthermore, the geographic pattern of B. occidentalis decline in the Pacific West described in this study does correlate with the prevailing hypothesis that wild populations may have been infected by contact with commercial populations of B. occidentalis (16). Further investigation of the pathogenicity, transmissibility and prevalence of N. bombi in wild populations is necessary to investigate the ecology of infection in bumble bee communities. The decline of pollinators has become a worldwide issue across managed and natural landscapes. The economic and ecological repercussions of pollinator extinction and decreased community richness raise great concern on the stability of global food production and disruption of plant-pollinator networks (7, 8). As the European honey bee (Apis mellifera) continues to face problems of disease and management (37), native pollinators, most notably bumble bees are becoming increasingly important in sustaining an agricultural niche that is beginning to see collapse (5, 10, 11. 22). In response to native bee declines, as well as the need to diversity pollinator assemblages within agricultural landscapes, coordinated, large scale efforts to mitigate further losses are necessary across multiple government and non-government agencies. Literature Cited 1. Butchart SHM, et al. (2010) Global Biodiversity: Indicators of Recent Declines. Science 5982:1164-1168.
92 2. Vié JC, Hilton-Taylor C, Stuart SN (eds.) (2009) Wildlife in a Changing World – An Analysis of the 2008 IUCN Red List of Threatened Species. Gland, Switzerland: IUCN. 180 pp. 3. Gaston KJ (1991) The Magnitude of Global Insect Species Richness. Conserv Biol 5: 28C-296. 4. Losey JE, Vaughan M (2006) The Economic Value of Ecological Services Provided by Insects. Bioscience 56: 311–323. 5. Kremen C, et al. (2007) Pollination and other ecosystem services produced by mobile organisms: a conceptual framework for the effects of land-use change. Ecol Lett 10:299-314. 6. Hilty J, Merenlender A (2000) Faunal indicator taxa selection for monitoring ecosystem health. Biol Conserv 92: 185-197. 7. Velthuis HHW, van Doorn A (2006) A century of advances in bumble bee domestication and the economic and environmental aspects of its commercialization for pollination. Apidologie 37: 421-451. 8. Biesmeijer JC, et al. (2006) Parallel Declines in Pollinators and Insect-Pollinated Plants in Britain and the Netherlands. Science 5785:351-354. 9. Allen-Wardell G, et al. (1998) The potential consequences of pollinator declines on the conservation of biodiversity and stability of food crop yields. Conserv Biol 12:8-17. 10. Potts SG, et al. (2010) Global pollinator declines: trends, impacts and drivers. Trends Ecol Evol 25:345-353.
93 11. Goulson D, Lye GC, Darvill B (2008) Decline and conservation of bumble bees. Annu Rev Entomol 53:191-208. 12. Federman A (2009) Plight of the bumble bee. Earth Island Journal 24: 34-39. 13. Grixti JC, Wong LT, Cameron SA, Favret C (2009) Decline of bumble bees (Bombus) in the North American Midwest. Biol Conserv 142: 75-84. 14. McFrederick QS, LeBuhn G (2006) Are urban parks refuges for bumble bees Bombus spp. (Hymenoptera: Apidae)? Biol Conserv 129: 372-382. 15. Goulson D, Hanley ME, Darvill B, Ellis JS, Knight ME (2005) Causes of rarity in bumble bees. Biol Conserv 122: 1-8. 16. Flanders, R. V., W. F. Wehling, and A. L. Craghead. 2003. Laws and regulations on the import, movement and release of bees in the United States, in For nonnative crops, whence pollinators of the future?, eds Strickler K, Cane JH (Thomas Say Publications in Entomology, Lanham, MD), pp 99-111. 17. Colla SR, Otterstatter MC, Gegear RJ, Thomson JD (2006) Plight of the bumble bee: pathogen spillover from commercial to wild populations. Biol Conserv 129:461-467. 18. Colla SR, Packer L (2008) Evidence for the decline of eastern North American bumble bees, with special focus on Bombus affinis Cresson. Biodivers Conserv 17: 1379-1391. 19. Thorp RW, Shepherd MD (2005) Subgenus Bombus. Latreille, 1802 (Apidae: Apinae: Bombini). Preprint available at www.xerces.org/Pollinator_Red_List/Bees/Bombus_Bombus.pdf.
94 20. Graham CH, Ferrier S, Huettman F, Moritz C, Peterson AT (2004) New developments in museum-based informatics and applications in biodiversity analysis. Trends Ecol Evol 19: 497-503. 21. Cameron SA, Hines HM, Williams PH (2007) A comprehensive phylogeny of the bumble bees (Bombus). Biol J Linn Soc 91:161-188. 22. Committee on the Status of Pollinators in North America, National Research Council (2007) Status of Pollinators in North America (National Academies Press, Washington, DC). 23. Evans, E., Thorp, R., Jepsen, S., Black, S.H. 2008. Status Review of Three Formerly Common Species of Bumble Bee in the Subgenus Bombus: Bombus affinis (the rusty patched bumble bee), B. terricola (the yellow banded bumble bee), and B. occidentalis (the western bumble bee). The Xerces Society of Invertebrate Conservation, Portland, OR. 24. Williams P, Colla S, Xie Z (2009) Bumblebee vulnerability: Common correlates of winners and losers across three continents. Conserv Biol 23:931-940. 25. Phillips SJ, Anderson RP, Scapire RE (2006) Maximum entropy modeling of species geographic distributions. Ecol Model 190:231-259. 26. Hijmans RJ, Cameron SE, Parra JL, Jones, PG, Jarvis A (2005) Very high resolution interpolated climate surfaces for global land areas. Int J Climatol 25: 1965–1978 [available at www.worldclim.org]. 27. ESRI (2007) ArcGIS 9. 3. ESRI, Redlands, California. 28. R Development Core Team (2009) R: A language and environment for statistical computing (R Foundation for Statistical Computing, Vienna, Austria).
95 29. Milliron HE (1971) A monograph of the western hemisphere bumblebees (Hymenoptera: Apidae; Bombinae). I. The genera Bombus and Megabombus subgenus Bombias. Mem Entomol Soc Canada 82:1-80. 30. Milliron HE (1973) A monograph of the western hemisphere bumblebees (Hymenoptera: Apidae; Bombinae). II. The genus Megabombus subgenus Megabombus. Mem Entomol Soc Canada 89:81-237. 31. vanDerWall JL, Shoo LP, Graham C, William SE (2009) Selecting pseudoabsence data from presence-only distribution modeling: How far should you stray from what you know? Ecol Model 220:589-594. 32. Fielding AH, Bell JF (1997) A review of methods for the assessment of prediction errors in conservation presence/absence models. Biol Conserv 24:1:38-49. 33. Fleiss JL (1973) Statistical methods for rates and proportions. John Wiley and Sons Inc., Toronto, Canada. 34. Solow AR (1993) Inferring extinction from sighting data. Ecology 74: 962-964. 35. Solow AR, Roberts DL (2003) A nonparametric test for extinction based on a sighting record. Ecology 84: 1329-1332. 36. U.S. Environmental Protection Agency (2010) Level III ecoregions of the continental United States (revision of Omernik 1987). U.S. Environmental Protection Agency, National Health and Environmental Effects Research Laboratory, Western Ecology Division, Corvallis, Oregon 37. Watanabe ME (2008) Colony collapse disorder: Many suspects, no smoking gun. BioScience 58: 384-388.
96
APPENDIX D
Summary of target Bombus species (B. affinis, B. bifarius, B. bimaculatus, B. impatiens, B. occidentalis, B. pensylvanicus, B. terricola, and B. vosnesenskii) surveyed from 2007 to 2009. Survey State
County
Locality
Date
Latitude
Longitude
Total aff
bif
bim
imp
occ
pen
ter
vos
minutes Alabama
Bibb
County Rd 65 NW of Rt25 nr Six Mile
specimens†
Jun-29-2009
33.04519
-87.00591
60
-
-
2
4
-
1
-
-
25
Jun-29-2009
31.85426
-86.64129
90
-
-
-
14
-
-
-
-
14
Jun-29-2009
32.21282
-86.97015
90
-
-
-
-
-
1
-
-
23
Jun-28-2009
30.25479
-88.11223
90
-
-
-
20
-
-
-
-
31
(AL09.site04) Alabama
Butler
Comfort Inn, Greenvile, Fort Dale Rd (AL09.site02)
Alabama
Dallas
County Rd 85 2.5 mi SW of Hwy41 (AL09.site03)
Alabama
Mobile
Dauphin Isl, Hwy 193 just at entrance to island (AL09.site01)
Arizona
Apache
Alpine, 14.5 mi S
Aug-22-2008
33.69101
-109.2155
34
-
-
-
-
-
-
-
-
29
Arkansas
Arkansas
Hwy79 2mi N of Stuttgart
Jul-25-2009
34.54717
-91.49578
90
-
-
-
9
-
-
-
-
41
Jul-13-2008
36.10147
-94.43522
90
-
-
4
4
-
7
-
-
55
Jun-24-2009
34.84627
-90.636
90
-
-
-
1
-
-
-
-
7
Jul-13-2008
35.8207
-94.15895
60
-
-
-
65
-
1
-
-
84
Jul-8-2007
40.87766
-121.56048
50
-
-
-
-
-
-
-
58
60
(AR09.site02) Arkansas
Benton
West of Ozark NF (Hwy 16) (AR08.site01)
Arkansas
Lee
Rt79 at St. Francis River, 1mi N of Soudan (AR09.site01)
Arkansas
Washington
near Devil's Den State Park (Hwy 74) (AR08.site02)
California
Shasta
Lassen NF, 5.80mi E by S of Burney
97
California
Shasta
West Cassel Road
Jul-10-2009
40.87766
-121.56048
30
-
-
-
-
-
-
-
78
78
California
Sierra
1.52 km SSW Sierraville
Jul-6-2007
39.57604
-120.36991
35
-
-
-
-
-
-
-
1
38
California
Sierra
2.33 km WNW Sierraville
Jul-6-2007
39.59517
-120.39332
20
-
-
-
-
-
-
-
1
12
California
Siskiyou
10.16 km SSW of Mt. Shasta
Jul-9-2007
41.32741
-122.26211
85
-
1
-
-
-
-
-
11
18
California
Siskiyou
10.26 km SW of Mt. Shasta
Jul-9-2007
41.32861
-122.26733
20
-
-
-
-
-
-
-
6
6
California
Siskiyou
9.04 km SW Mt. Shasta
Jul-9-2007
41.34877
-122.27846
35
-
-
-
-
-
-
-
36
41
California
Siskiyou
9.63 km SSW Mt. Shasta
Jul-9-2007
41.32992
-122.25453
15
-
-
-
-
-
-
-
-
2
California
Siskiyou
Indian Creek Rd, 1.47mi of Silver
Jul-25-2008
41.96575
-123.50289
30
-
2
-
-
-
-
-
69
153
Jul-12-2007
41.96575
-123.50289
60
-
-
-
-
-
-
-
8
58
Gulch California
Siskiyou
Indian Creek Rd, 1.47mi of Silver Gulch
California
Trinity
Callahan, 7.73 km ESE, Klamath NF
Jul-12-2009
41.29979
-122.74858
30
-
-
-
-
-
-
-
51
70
California
Trinity
Trinity NP, 0.34mi SW Store Gulch
Jul-13-2007
40.81017
-123.12021
40
-
-
-
-
-
-
-
45
60
Colorado
Boulder
Beaver Meadow, Rocky Mountain NP
Aug-8-2009
40.36812
-105.61791
30
-
9
-
-
-
-
-
-
31
Colorado
Boulder
Eldora Lake, 0.65 km ENE, Arapaho
Aug-9-2009
39.94036
-105.5595
30
-
52
-
-
1
-
-
-
87
NF Colorado
Boulder
North of Nederland (CO08.site03)
Jul-29-2008
40.02302
-105.51353
120
-
1
-
-
-
-
-
-
8
Colorado
Boulder
Willow Park, Rocky Mountain NP
Aug-8-2009
40.43041
-105.73381
30
-
-
-
-
-
-
-
-
29
Colorado
Chaffee
Daley Gulch, San Isabel NF
Aug-10-2009
38.83969
-105.98926
30
-
20
-
-
16
-
-
-
56
Colorado
Douglas
Off of Platte River Road (CO08.site02)
Jul-29-2008
39.37745
-105.17249
90
-
10
-
-
1
-
-
-
29
98
Colorado
Douglas
Rt 67 (CO08.site04)
Jul-29-2008
39.15588
-105.15589
90
-
46
-
-
-
-
-
-
87
Colorado
ElPaso
Marys Peak, 0.96 km ESE, Pike NF
Aug-9-2009
38.79776
-104.88625
30
-
6
-
-
-
-
-
-
27
Colorado
Fremont
Oak Creek Campground, 1.07 km NE,
Aug-10-2009
38.30141
-105.25665
30
-
7
-
-
-
-
-
-
31
San Isabel NF Colorado
Gunnison
1.20 km NNE Mount Crested Butte
Aug-13-2008
38.9186
-106.9599
30
-
34
-
-
1
-
-
-
91
Colorado
Gunnison
1.20 km NNE Mount Crested Butte
Aug-10-2009
38.9186
-106.9599
30
-
32
-
-
23
-
-
-
66
Colorado
Gunnison
7.13 km NW Gothic
Aug-14-2008
39.9948
-107.0588
30
-
9
-
-
-
-
-
-
42
Colorado
Gunnison
7.93 km NW Gothic
Aug-14-2008
39.0116
-107.0526
30
-
5
-
-
-
-
-
-
16
Colorado
Larimer
Dry Gulch Rd, Estes Park
Aug-7-2009
40.39179
-105.48759
30
-
25
-
-
5
-
-
-
61
Colorado
Montrose
Swanson Lake, 2.59 km NW
Aug-11-2009
38.32304
-107.4761
30
-
29
-
-
1
-
-
-
57
Colorado
Ouray
Angel Creek Camp, Uncompahgre NF
Aug-11-2009
38.00169
-107.69428
30
-
27
-
-
-
-
-
-
61
Colorado
Ouray
Ouray
Aug-12-2009
38.0395
-107.68045
30
-
-
-
-
-
-
-
-
3
Colorado
Summit
9.54 km NW Silverthorne
Aug-15-2008
39.7184
-106.1513
45
-
13
-
-
1
-
-
-
34
Colorado
Teller
Pike NF, Painted Rock Camp
Jul-29-2008
39.08366
-105.10474
30
-
13
-
-
-
-
-
-
13
Jul-16-2009
41.76643
-72.89947
90
-
-
2
100
-
-
-
-
104
Jul-17-2009
41.86087
-72.48312
90
-
-
9
46
-
-
-
-
60
Jul-9-2009
34.26571
-84.27237
90
-
-
3
29
-
-
-
-
50
(CO08.site01) Connecticut
Hartford
Farmington River trail NW of Unionville (CT09.site01)
Connecticut
Tolland
Hwy 83 0.5 mi W of Rockville (CT09.site02)
Georgia
Cherokee
Newt Green Rd near Edwards Mill Road (GA09.site03)
99
Georgia
Clarke
Near Athens, off Luke Rd+Fowler Mill
Jul-9-2009
33.96253
-83.53266
90
-
-
-
6
-
-
-
-
10
Jul-9-2009
34.66514
-84.71028
90
-
-
-
5
-
-
-
-
15
Rd (GA09.site04) Georgia
Murray
old Hwy 411 near Ramhurst (GA09.site02)
Georgia
Walker
Hwy136 near Villanow (GA09.site01)
Jul-8-2009
34.67863
-85.12742
90
-
-
1
8
-
-
-
-
23
Idaho
Adams
7.55 km ENE New Meadows
Jul-10-2008
44.98977
-116.18861
90
-
16
-
-
1
-
-
-
63
Idaho
Adams
McCall, 11 air km N NE
Jul-10-2008
45.00276
-116.15892
30
-
10
-
-
-
-
-
-
13
Idaho
Boundary
Brush Lake, 5.69 km NNW, Kanisku
Aug-1-2009
48.85286
-116.27901
30
-
39
-
-
1
-
-
-
78
NF Idaho
Fremont
Harriman State Park
Jul-28-2009
44.30858
-111.45519
15
-
-
-
-
-
-
-
-
5
Idaho
Idaho
16.59 km N Riggins
Jul-9-2008
45.5712
-116.3048
30
-
7
-
-
-
-
-
-
15
Idaho
Kootenai
Happy Gap Fork
Aug-1-2009
48.29945
-116.70358
30
-
11
-
-
1
-
-
-
28
Illinois
Champaign
Meadowbrook Park, Urbana
Jul-22-2008
40.083333
-88.2025
30
-
-
2
15
-
-
-
-
36
Aug-11-2009
39.93715
-88.27055
90
-
-
-
14
-
10
-
-
32
Jul-28-2009
39.51112
-89.3416
90
-
-
-
10
-
2
-
-
46
Aug-11-2008
39.52481
-89.32839
30
-
-
-
12
-
6
-
-
22
Aug-11-2008
39.51112
-89.3416
30
-
-
-
5
-
11
-
-
19
(IL08.site10) Illinois
Champaign
Roadside 1.5 mi N of Pesotum (IL09.site06)
Illinois
Christian
Hwy 48 near Hewittville/Taylorville (IL09.site03)
Illinois
Christian
near Hewitville/Taylorville (patch 1) (IL08.site13A)
Illinois
Christian
near Hewitville/Taylorville (patch 2) (IL08.site13B)
100
Illinois
Cook
Bluff Spring Fen (IL09.site05)
Jul-29-2009
42.01375
-88.25199
120
2
-
6
26
-
-
-
-
59
Illinois
Cook
Bluff Spring Fen, Elgin (IL08.site11)
Jul-23-2008
42.01375
-88.25199
90
2
-
3
32
-
-
-
-
78
Illinois
Cook
Bluff Spring Fen, Elgin (IL08.site11B)
Aug-21-2008
42.01375
-88.25199
120
1
-
-
106
-
-
-
-
128
Illinois
Douglas
near Galton (IL08.site15)
Aug-27-2008
39.76056
-88.29737
90
-
-
-
4
-
22
-
-
35
Illinois
Jackson
Murphysboro (IL08.site01)
Jun-10-2008
37.77345
-89.41856
90
-
-
9
9
-
-
-
-
53
Illinois
Jackson
Murphysboro (IL08.site01B)
Aug-28-2008
37.77345
-89.41856
60
-
-
-
51
-
11
-
-
63
Illinois
Lake
Chain O'Lakes State Park (IL08.site03)
Jun-30-2008
42.460477
-88.192242
76
-
-
5
8
-
-
-
-
28
Illinois
Lake
Illinois Beach State Park (IL08.site04)
Jul-1-2008
42.4253
-87.80558
100
-
-
7
6
-
-
-
-
18
Illinois
Macoupin
Carlinville, Alton Rd (IL08.site14)
Jun-9-2008
39.26545
-89.89844
90
-
-
-
-
-
-
-
-
8
Illinois
Mason
Havanna (IL08.site08)
Jul-15-2008
40.25329
-90.08789
60
-
-
20
4
-
2
-
-
32
Illinois
Mason
Sand Ridge SF (IL09.site01)
Jul-14-2009
40.39017
-89.85842
60
-
-
1
6
-
-
-
-
40
Illinois
Mason
Sand Ridge SF (IL08.site07)
Jul-15-2008
40.39017
-89.85842
60
-
-
-
1
-
-
-
-
30
Illinois
Mason
Sand Ridge SF (IL08.site07B)
Aug-29-2008
40.39017
-89.85842
60
-
-
-
26
-
-
-
-
27
Illinois
Ogle
Castle Rock SP (IL08.site02)
Jun-19-2008
41.97828
-89.357038
60
-
-
7
4
-
-
-
-
24
Illinois
Ogle
Castle Rock SP (IL09.site04)
Jul-28-2009
41.97828
-89.357038
90
12
-
20
4
-
-
-
-
66
Illinois
Peoria
Jubilee College SP, Valley View picnic
Aug-14-2009
40.82507
-89.80296
90
3
-
-
54
-
-
-
-
72
Jul-25-2008
40.916516
-89.803093
90
-
-
2
9
-
-
-
-
42
Jul-15-2008
40.00772
-88.64484
60
-
-
23
-
-
-
-
-
24
area (IL09.site08) Illinois
Peoria
Research Plot (ARS) 8 mi off I-74 (IL08.site09)
Illinois
Piatt
Allerton Park (Entrance Prairie)
101
(IL08.site05) Illinois
Piatt
Allerton Park (Sunsinger Statue)
Jul-15-2008
39.99363
-88.66714
60
-
-
29
-
-
-
-
-
33
Jul-28-2009
40.00772
-88.64484
90
-
-
1
11
-
1
-
-
20
(IL08.site06) Illinois
Piatt
Allerton Park (Entrance Prairie) (IL09.site02B)
Illinois
Piatt
Allerton Park (IL08.site12)
Aug-11-2008
40.00772
-88.64484
60
-
-
-
2
-
-
-
-
33
Illinois
Piatt
Allerton Park (Sunsinger Statue)
Jul-28-2009
39.99363
-88.66714
60
-
-
21
2
-
1
-
-
25
Aug-28-2008
37.37934
-88.59228
60
-
-
-
17
-
9
-
-
28
Aug-12-2009
37.4471
-89.11745
90
-
-
-
46
-
4
-
-
52
Aug-13-2009
38.40926
-86.73048
90
-
-
-
56
-
4
-
-
61
(IL09.site02A) Illinois
Pope
Shawnee NF 4 mi. west of Dixon Springs S.P. (IL08.site16)
Illinois
Union
Hwy 146 1.5 mi east of I57 (IL09.site07)
Indiana
Dubois
Hoosier NF west of Pakota Lake (IN09.site04)
Indiana
Montgomery
Alamo (Hwy 234) (IN08.site01)
Jun-23-2008
39.9602
-87.0686
120
-
-
6
15
-
-
-
-
39
Indiana
Montgomery
Alamo (Hwy 234) (IN09.site02)
Jul-9-2009
39.95995
-87.06641
90
2
-
11
61
-
-
-
-
88
Indiana
Montgomery
Forested roadside on hwy234, Shades
Aug-13-2009
39.94875
-87.05757
90
-
-
-
71
-
-
-
-
78
SP (IN09.site06) Indiana
Orange
Highway 145N (IN08.site03)
Jun-24-2008
38.4575
-86.6028
120
-
-
2
20
-
-
-
-
36
Indiana
Orange
Newton-Stewart S.R.A. (IN08.site02)
Jun-24-2008
38.404
-86.6613
120
-
-
4
28
-
-
-
-
49
Indiana
Pulaski
4 mi NW Star City, Hwy 35 nr 225
Jul-9-2009
41.02274
-86.85357
90
-
-
6
11
-
-
-
-
59
(IN09.site03)
102
Indiana
Pulaski
Winamac (US35) (IN08.site05)
Jun-25-2008
41.02308
-86.58348
120
-
-
30
40
-
-
-
-
76
Indiana
Ripley
Abandoned School, Holton
Aug-13-2009
39.0728
-85.3885
90
-
-
-
47
-
-
-
-
66
(IN09.site05) Indiana
Ripley
Nebraska (US50) (IN08.site04)
Jun-24-2008
39.06533
-85.43764
120
-
-
9
38
-
-
-
-
96
Indiana
Ripley
nr Nebraska (IN09.site01)
Jul-7-2009
39.06533
-85.43764
90
-
-
1
93
-
-
-
-
97
Iowa
Clayton
Bixby State Park (IA08.site02)
Jul-6-2008
42.66992
-91.402
45
-
-
1
-
-
-
-
-
5
Iowa
Crawford
South Hillside SW of Denison
Jul-1-2009
41.99105
-95.39279
90
-
-
6
35
-
3
-
-
59
(IA09.site01) Iowa
Floyd
W of Charles City (IA08.site04)
Sep-18-2008
43.06555
-92.6489
40
-
-
-
10
-
-
-
-
25
Iowa
Keokuk
Sigourney (Hwy 92) (IA08.site01)
Jul-10-2008
41.33614
-92.33661
110
-
-
-
2
-
-
-
-
47
Iowa
Mahaska
Hwy 63 N of Oskaloosa (IA08.site03)
Sep-18-2008
41.32979
-92.64732
45
-
-
-
24
-
6
-
-
33
Iowa
Marion
orchard on SW corner of Adams Ave +
Jul-1-2009
41.4071
-92.87099
90
-
-
17
11
-
1
-
-
60
Jun-28-2009
38.75328
-95.26876
90
-
-
1
1
-
1
-
-
25
Jul-25-2008
39.14434
-95.50159
60
-
-
-
-
-
36
-
-
41
Jul-27-2008
38.47591
-97.45812
60
-
-
-
-
-
-
-
-
13
Hwy 102 (IA09.site02) Kansas
Douglas
Corner of US 59, 2 mi S of US 56 (KS09.site01)
Kansas
Jefferson
5 mi. North of Williamstown (Hwy 59) (KS08.site01)
Kansas
McPherson
Maxwell Wildlife Refuge (nr. Observation tower) (KS08.site03)
Kansas
Morris
Council Grove Lake (KS09.site03)
Jun-29-2009
38.68715
-96.49283
90
-
-
-
-
-
3
-
-
38
Kansas
Nowata
Hwy 268, turn into Pomona St Park
Jun-28-2009
38.63811
-95.60114
90
-
-
-
2
-
-
-
-
45
(KS09.site02)
103
Kansas
Rush
8 mi. east of Rush Center (Hwy 96)
Jul-27-2008
38.46469
-99.16946
60
-
-
-
-
-
5
-
-
20
(KS08.site04) Kentucky
Clay
Hwy 421 + US11 (KY09. site05)
Jul-15-2009
37.2303
-83.78448
45
-
-
3
2
-
-
-
-
8
Kentucky
Franklin
Hwy 60 just west of Frankfort (KY09.
Jul-15-2009
38.16413
-84.94415
90
-
-
13
8
-
-
-
-
97
Jul-15-2009
36.76313
-83.1837
90
-
-
3
43
-
-
-
-
98
site06) Kentucky
Harlan
10mi W KY/VA border nr Cranks (KY09. site04)
Kentucky
McCrackin
2mi west of Paducah (KY09. site02)
Jul-7-2009
37.025278
-88.762222
90
-
-
1
16
-
7
-
-
68
Kentucky
Trigg
Hwy68 (KY09. site03)
Jul-7-2009
36.83592
-87.86253
90
-
-
2
14
-
1
-
-
92
Louisiana
Bienville
Jcn Hwy4 @ Davis Loop
Jun-26-2009
32.26892
-93.02177
90
-
-
-
5
-
38
-
-
50
Jun-26-2009
32.52578
-93.67943
60
-
-
-
-
-
7
-
-
7
Aug-6-2009
44.667355
-68.270784
60
-
-
-
-
-
-
-
-
36
Jul-28-2009
44.4006
-68.5192
60
-
-
1
-
-
-
-
-
50
Aug-1-2009
44.410503
-68.64705
60
-
-
-
-
-
-
-
-
52
Jul-31-2009
44.126801
-68.350615
60
-
-
1
-
-
-
1
-
13
Aug-7-2009
44.155752
-68.66653
60
-
-
3
-
-
-
4
-
38
(LA09.site02) Louisiana
Bossier
Barksdale AF Base 1mi NW of Lucky (LA09.site01)
Maine
Hancock
Corning Rd nr Eastbrook (ME09.site06)
Maine
Hancock
Darling Island, E. Blue Hill Area (ME09.site01)
Maine
Hancock
Kingdom Woods (off Hwy 177) (ME09.site03)
Maine
Hancock
Long Island, North Tip, ~2mi from Mainland (ME09.site02)
Maine
Hancock
Stonington, Johnson Cottage, Main
104
Street (ME09.site07) Massachusetts
Berkshire
Rt 7 on CT/MA border (MA09.site03)
Jul-16-2009
42.06543
-73.32829
90
-
-
29
7
-
-
-
-
55
Massachusetts
Hampshire
East Hampton (MA09.site04)
Jul-16-2009
42.24344
-72.7183
90
-
-
13
49
-
-
-
-
72
Massachusetts
Middlesex
Ashby Fire Dept (MA09.site01)
Jul-15-2009
42.679747
-71.82805
90
-
-
17
13
-
-
-
-
74
Massachusetts
Norfolk
Pond Road, Wellesley (MA09.site02)
Jul-15-2009
42.29117
-71.31905
90
-
-
1
29
-
-
-
-
34
Minnesota
Goodhue
Red Wing (MN08.site01)
Jun-25-2008
44.557736
-92.488344
90
-
-
41
5
-
-
-
-
70
Minnesota
Houston
Houston (Hwy 16) (MN08.site02)
Jun-26-2008
43.76343
-91.43555
90
-
-
50
6
-
-
-
-
75
Minnesota
Houston
1/2 mi S of Caledonia(MN09.site02)
Jul-31-2009
43.62854
-91.50724
90
-
-
4
47
-
-
-
-
58
Minnesota
Lake
Kawishiwi, nr. Lake One
Aug-18-2008
47.94125
-91.461389
60
-
-
-
-
-
-
-
-
27
(MN08.site07) Minnesota
Le Sueur
Sakatah SP (MN08.site05)
Aug-6-2008
44.21959
-93.2283
120
-
-
37
12
-
-
-
-
82
Minnesota
Lyon
Hwy 59 on border of Lyon and Murray
Aug-6-2008
44.19908
-95.75491
120
-
-
3
1
-
-
-
-
49
Counties (MN08.site03) Minnesota
Nicollet
Hwy 14 and TWP173 (MN08.site04)
Aug-6-2008
44.27375
-94.2115
60
-
-
2
1
-
-
-
-
22
Minnesota
Nicollet
off 99W, ~2mi NE of North Star
Jul-30-2009
44.30375
-94.03598
90
-
-
22
1
-
-
-
-
34
Aug-7-2008
43.97524
-91.4277
60
-
-
10
21
-
-
-
-
58
Jun-28-2009
30.42013
-89.13692
60
-
-
-
2
-
-
-
-
17
Jun-30-2009
33.55438
-88.64165
90
-
-
-
63
-
27
-
-
97
(MN09.site01) Minnesota
Winnona
Great River Bluff State Park, Scenic Overlook Hwy 61 (MN08.site06)
Mississippi
Harrison
Legacy Inn Canal Rd, Gulfport (MS09.site01)
Mississippi
Loundes
Old Tibbee Rd nr. border of Loundes
105
and Oktibbeha Co (MS09.site03) Missouri
Adair
Hwy53 just S of Kirksville
Aug-16-2009
40.16584
-92.57161
90
-
-
-
27
-
2
-
-
40
Aug-17-2009
38.98974
-92.51566
90
-
-
-
20
-
14
-
-
57
(MO09.site05) Missouri
Boone
Hwy40 bet. Rocheport & Prathersville (MO09.site04)
Missouri
Callaway
Tucker Prairie (MO08.site05)
Jul-16-2008
38.94897
-91.98984
60
-
-
-
1
-
-
-
-
27
Missouri
Christian
Hwy 60, 1 mi past Billings
Jul-12-2008
37.05655
-93.56777
60
-
-
8
1
-
2
-
-
57
(MO08.site08) Missouri
Franklin
Shaw Nature Preserve (MO09.site01)
Jun-9-2009
38.46823
-90.81744
120
-
-
44
1
-
1
-
-
78
Missouri
Franklin
Shaw Nature Preserve (MO09.site02)
Aug-3-2009
38.48037
-90.823385
90
-
-
-
26
-
2
-
-
67
Missouri
Franklin
Shaw Nature Reserve (MO08.site02A)
Jun-11-2008
38.48341
-90.82303
90
-
-
5
-
-
1
-
-
52
Missouri
Franklin
Shaw Nature Reserve 2
Jul-10-2008
38.47112
-90.81139
135
-
-
6
-
-
-
-
-
62
Aug-3-2009
36.96193
-93.68428
60
-
-
1
-
-
26
-
-
31
(MO08.site02B) Missouri
Lawrence
Hwy 60 10 mi SW of Billings (MO09.site03)
Missouri
Linn
Brookfield (Route 11) (MO08.site06)
Jul-16-2008
39.7526
-93.08075
30
-
-
-
8
-
-
-
-
16
Missouri
Macon
Atlanta (MO08.site07)
Jul-17-2008
39.89866
-92.47369
120
-
-
-
14
-
2
-
-
30
Missouri
Scotland
Hwy 15 near Iowa border
Sep-17-2008
40.50023
-92.16366
30
-
-
-
6
-
6
-
-
13
Jun-10-2008
38.70967
-90.74902
90
-
-
-
1
-
5
-
-
16
Jul-10-2008
38.62258
-90.37707
90
-
-
11
-
-
3
-
-
40
(MO08.site09) Missouri
St. Charles
Busch Conservation Area (MO08.site01)
Missouri
St. Louis
Litzsinger Prairie (MO08.site04)
106
Montana
Cascade
Silver Crest Ski Area, Lewis NF
Aug-3-2009
46.85804
-110.67823
30
-
17
-
-
2
-
-
-
64
Montana
Deer Lodge
Pintlar Lake, Deer Lodge NF
Jul-30-2009
45.83865
-113.43752
30
-
44
-
-
-
-
-
-
64
Montana
Flathead
Hungry Horse Dam, Lost Johnny Point,
Aug-2-2009
48.30446
-113.98406
30
-
29
-
-
6
-
-
-
89
1.60 NNE Montana
Gallatin
21.64 km S of Big Sky
Aug-7-2008
45.0618
-111.2555
30
-
8
-
-
-
-
-
-
38
Montana
Gallatin
Cherry Creek Campground, Hebgen
Jul-28-2009
44.75118
-111.26383
60
-
12
-
-
2
-
-
-
74
Aug-17-2008
44.7438
-111.259
30
-
20
-
-
8
-
-
-
90
Lake, Beaverhead NF Montana
Gallatin
Hebgen Lake, 15.22km NW of West Yellowstone
Montana
Lake
Fish Lake Trailhead, Glacier NP
Aug-2-2009
48.61515
-113.87173
30
-
-
-
-
-
-
-
-
7
Montana
Lincoln
Lower Thompson Lake, 1.60 km ENE
Aug-1-2009
48.02376
-115.01229
30
-
15
-
-
1
-
-
-
16
Montana
Missoula
Lolo Hot Springs, 2.18 NW
Jul-31-2009
46.70816
-114.52659
30
-
49
-
-
1
-
-
-
51
Montana
Park
Clyde Park, 1.88 km W
Aug-3-2009
45.88314
-110.62844
30
-
4
-
-
-
-
-
-
57
Montana
Park
Mill Creek Campground, Gallatin NF
Jul-30-2009
45.31757
-110.56695
30
-
16
-
-
1
-
-
-
36
Montana
Park
Montanapolis Springs, Gallatin NF
Jul-30-2009
45.2879
-110.53631
30
-
2
-
-
-
-
-
-
8
Montana
Ravalli
Como Lake Campground, Bitteroot NF
Jul-31-2009
46.06763
-114.24847
30
-
24
-
-
1
-
-
-
36
Montana
Ravalli
Lost Trail Ski Area, Bitteroot NF
Jul-30-2009
45.69219
-113.95238
30
-
27
-
-
-
-
-
-
49
Nebraska
Cass
Plattsmouth (NE08.site02)
Jul-9-2008
40.99976
-95.87263
170
-
-
6
4
-
-
-
-
42
Nebraska
Garfield
Hwy 70, 3 mi S of 91 (NE09.site02)
Jun-30-2009
41.7404
-98.8093
90
-
-
4
1
-
9
-
-
55
Nebraska
Howard
Rt11 .5 mi S of 58 intersection
Jun-30-2009
41.1255
-98.5542
90
-
-
17
1
-
1
-
-
28
(NE09.site01)
107
Nebraska
Lancaster
Branched Oak Lake RA (NE08.site01)
Jul-8-2008
40.95999
-96.86378
160
-
-
-
6
-
1
-
-
32
Nebraska
Lancaster
Branched Oak Rd + Hwy 79
Jun-30-2009
40.97433
-96.79512
90
-
-
1
7
-
-
-
-
40
(NE09.site03) Nevada
Elko
Charleston Resevoir
Jul-9-2009
41.57888
-115.50135
30
-
-
-
-
-
-
-
-
5
Nevada
Elko
Humboldt NF, 0.15mi S by E of head
Aug-26-2008
40.66422
-115.44721
60
-
131
-
-
1
-
-
-
149
Aug-16-2007
40.66422
-115.44721
70
-
47
-
-
1
-
-
-
60
Jul-8-2009
40.66422
-115.44721
30
-
6
-
-
-
-
-
-
12
Aug-16-2007
40.60437
-115.37538
60
-
25
-
-
-
-
-
-
64
Aug-17-2007
40.6252
-115.36742
30
-
5
-
-
-
-
-
-
66
Aug-26-2008
41.79013
-115.47797
30
-
5
-
-
1
-
-
-
7
of NFD 122 Road Nevada
Elko
Humboldt NF, 0.15mi S by E of head of NFD 122 Road
Nevada
Elko
Humboldt NF, 0.15mi S by E of head of NFD 122 Road
Nevada
Elko
Humboldt NF, 0.79mi SE of Island Lake
Nevada
Elko
Humboldt NF, 1.00mi NE of Island Lake
Nevada
Elko
Jarbidge Mtns., 1.33 Mi SWbyS Coon Cr Pk
Nevada
Elko
Jarbidge Mtns., 1.4 Mi SW Coon Cr Pk
Aug-26-2008
41.79484
-115.4893
30
-
12
-
-
-
-
-
-
25
Nevada
Elko
Owyhee River, Humboldt NF
Jul-9-2009
41.72003
-115.88476
30
-
3
-
-
-
-
-
-
23
Nevada
Elko
Powerhouse Picnic Area, Humboldt NF
Jul-9-2009
40.69176
-115.47589
30
-
4
-
-
-
-
-
-
12
Nevada
Elko
Ruby Mountains, Lamoille Canyon
Aug-25-2008
40.5983
-115.3824
30
-
-
-
-
-
-
-
-
77
New Mexico
Lincoln
Buck Mtn., 0.86 air km SW
Jul-28-2009
33.3994
-105.7895
30
-
-
-
-
-
-
-
-
29
New Mexico
Lincoln
Kraut Canyon, nr. Bonito Lake
Jul-28-2009
33.4609
-105.7356
30
-
-
-
-
-
-
-
-
34
108
New Mexico
Lincoln
Robinson Canyon
Jul-28-2009
33.4605
-105.7636
30
-
-
-
-
-
-
-
-
53
New Mexico
Otero
Cloudcroft, 12 km SSW
Jul-29-2009
32.878
-105.7836
15
-
-
-
-
-
-
-
-
27
New Mexico
Otero
Cloudcroft, 5.2 km N
Jul-29-2009
32.9883
-105.7304
45
-
-
-
-
-
-
-
-
51
New Mexico
Otero
Cloudcroft, 5.4 km S
Jul-29-2009
32.9229
-105.7577
15
-
-
-
-
-
-
-
-
45
New Mexico
Otero
Water Canyon, Rio Penasco
Jul-29-2009
32.8288
-105.7651
15
-
-
-
-
-
-
-
-
33
New Mexico
Sandoval
Valle Grande
Jul-31-2009
35.8783
-106.5014
30
-
4
-
-
-
-
-
-
13
New Mexico
Sandoval
Valle San Antonio
Jul-31-2009
35.9749
-106.5408
15
-
-
-
-
-
-
-
-
28
New Mexico
Sandoval
Valle Santa Rosa
Jul-31-2009
35.9747
-106.5228
15
-
4
-
-
-
-
-
-
8
New Mexico
Sandoval
Valle Toledo
Jul-31-2009
35.9578
-106.4813
15
-
9
-
-
-
-
-
-
29
New Mexico
Socorro
San Mateo Mtns, Eagle Spring, Bear
Jul-30-2009
33.8786
-107.5229
15
-
-
-
-
-
-
-
-
13
Canyon New Mexico
Torrance
Canon de Tajique, 4 air km NW
Jul-27-2009
34.7689
-106.3285
30
-
-
-
-
-
-
-
-
54
New Mexico
Torrance
Manzano, 1.8 km NW; Canon Nuevo
Jul-27-2009
34.666
-106.3549
30
-
-
-
-
-
-
-
-
19
New York
Dutchess
Hwy 9 (NY09.site06)
Jul-18-2009
41.60235
-73.9116
90
-
-
2
51
-
-
-
-
56
New York
Essex
28North ~6 mi N of North Creek
Jul-13-2009
43.777
-73.96591
90
-
-
-
1
-
-
2
-
33
Jul-12-2009
43.2022
-78.82959
90
-
-
5
22
-
-
-
-
43
Jul-12-2009
42.68171
-76.85107
90
-
-
11
24
-
-
-
-
48
Jul-18-2009
40.94435
-72.83605
90
-
-
7
56
-
-
-
-
63
(NY09.site03) New York
Niagara
Rt 104 ~15 mi E of Niagra Falls (NY09.site01)
New York
Seneca
Rt 96A, off of Seneca Lake (NY09.site02)
New York
Suffolk
25A just west of Wading River (Long
109
Island) (NY09.site04) New York
Suffolk
SUNY Stony Brook (Long Island)
Jul-18-2009
40.923923
-73.12382
90
-
-
6
48
-
-
-
-
60
Jul-11-2009
35.043611
-80.025
90
-
-
3
37
-
1
-
-
52
Jul-13-2009
35.95826
-81.86559
90
-
-
-
26
-
-
-
-
58
(NY09.site05) North
Anson
Carolina North
(NC09.site01) Burke
Carolina North
Hwy 109 just N of Wadesboro
Hwy 181 nr Cold Springs (NC09.site04)
Guilford
Hwy 62, near Alamance (NC09.site03)
Jul-13-2009
35.9806
-79.55724
90
-
-
2
8
-
1
-
-
26
McDowell
US221 north of Marion (NC09.site05)
Jul-13-2009
35.89348
-81.93666
90
-
-
10
5
-
-
-
-
32
Stokes
Hwy 66. 10 mi E of Mt Airy
Jul-11-2009
36.47038
-80.3947
90
-
-
6
9
-
-
-
-
41
Carolina North Carolina North Carolina North
(NC09.site02) Yancey
Mt Mitchell (NC09.site06)
Jul-14-2009
35.74497
-82.2776
90
-
-
3
35
-
-
13
-
83
North Dakota
Emmons
Hwy 83 near SD border (ND08.site01)
Aug-3-2008
46.01404
-100.06829
60
-
1
-
-
-
-
-
-
14
North Dakota
Foster
Off of Hwy 200 near Glenfield
Aug-4-2008
47.45722
-98.64908
120
-
-
-
-
-
-
-
-
26
Aug-4-2008
47.59407
-101.42668
60
-
9
9
-
-
-
-
-
31
Carolina
(ND08.site04) North Dakota
Mclean
Fort Stevenson State Park (ND08.site02)
North Dakota
Mclean
N of Hwy 200 (ND08.site03)
Aug-4-2008
47.49606
-100.8227
60
-
2
2
-
-
-
-
-
24
Ohio
Belmont
Just east of Tacoma (OH09.site04)
Jul-20-2009
40.00154
-81.14311
90
-
-
1
14
-
-
-
-
66
110
Ohio
Miami
S of Fletcher (OH09.site05)
Jul-20-2009
40.09789
-84.11588
60
-
-
1
20
-
-
-
-
33
Ohio
Ottawa
105 South, Junction of 590
Jul-10-2009
41.49377
-83.21989
90
-
-
52
-
-
1
-
-
56
(OH09.site02) Ohio
Putnam
Hwy 190 (OH09.site01)
Jul-10-2009
40.89222
-84.31576
90
-
-
16
12
-
-
-
-
31
Ohio
Wayne
5mi North of Wooster (OH09.site03)
Jul-10-2009
40.90823
-81.97922
90
-
-
20
41
-
-
-
-
64
Oklahoma
Bryan
Mead OK (OK09.site01)
Aug-4-2009
33.9987
-96.53535
60
-
-
-
-
-
8
-
-
10
Oklahoma
Cleveland
1 mi. E of Norman (OK08.site02)
Jul-20-2008
35.18917
-97.36465
30
-
-
-
-
-
16
-
-
16
Oklahoma
Cleveland
nr Lake Thunderbird SP (OK09.site02)
Aug-5-2009
35.25402
-97.2653
90
-
-
-
-
-
8
-
-
12
Oklahoma
Comanche
nr Meers and Wichita Mts NWR
Jul-20-2008
34.7842
-98.51345
60
-
-
-
-
-
9
-
-
26
(OK08.site01) Oregon
Baker
32.5 km NE Baker City
Jul-23-2009
45.00649
-117.57936
30
-
3
-
-
1
-
-
-
53
Oregon
Baker
32.5 km NE Baker City
Jul-6-2008
45.00649
-117.57936
60
-
39
-
-
-
-
-
-
65
Oregon
Baker
Conundrum Creek, Wallowa-Whitman
Jul-23-2009
45.00633
-117.51675
15
-
16
-
-
-
-
-
-
30
NF Oregon
Baker
Richland, 30.3 air km NW
Jul-6-2008
44.96838
-117.43202
120
-
28
-
-
-
-
-
-
63
Oregon
Clackamas
Brighthead, 0.78 km NW
Jul-18-2009
45.36788
-122.00958
30
-
-
-
-
-
-
-
4
43
Oregon
Clackamas
Ski Bowl West, Mt Hood NF
Jul-18-2009
45.30253
-121.77001
20
-
-
-
-
-
-
-
-
23
Oregon
Coos
10.43 km SSW of Bunker Hill
Jul-26-2008
43.27169
-124.26156
30
-
-
-
-
-
-
-
56
98
Oregon
Deschutes
11.54 km WSW Sisters
Jul-22-2008
44.25608
-121.69052
30
-
5
-
-
-
-
-
1
13
Oregon
Deschutes
12.53 km WSW of Sisters
Jul-21-2008
44.24362
-121.69646
30
-
-
-
-
-
-
-
45
49
111
Oregon
Douglas
Lemolo Lake, Umpqua NF
Jul-16-2009
43.3194
-122.18837
30
-
48
-
-
-
-
-
4
56
Oregon
Hood River
0.35 km ESE of Wyeth
Jul-21-2008
45.69103
-121.76563
30
-
-
-
-
-
-
-
18
30
Oregon
Hood River
7.16 km SSE Mt. Hood
Jul-21-2008
45.32514
-121.63603
30
-
25
-
-
-
-
-
6
53
Oregon
Hood River
Mt Hood Meadows Lodge, 0.77 km
Jul-18-2009
45.32592
-121.65996
30
-
24
-
-
-
-
-
5
82
WNW, Mt. Hood NF Oregon
Jackson
1.15 km WNW Mt. Ashland
Jul-10-2007
42.08349
-122.73063
60
-
19
-
-
-
-
-
53
85
Oregon
Jackson
1.15 km WNW Mt. Ashland
Jul-13-2009
42.08349
-122.73063
30
-
11
-
-
1
-
-
20
35
Oregon
Jackson
1.15 km WNW Mt. Ashland
Jul-24-2008
42.08349
-122.73063
30
-
35
-
-
-
-
-
81
127
Oregon
Jackson
Castle Point, 6.0 km NW, Rogue River
Jul-15-2009
42.90313
-122.30127
30
-
34
-
-
1
-
-
5
62
Jul-13-2009
42.27179
-122.6074
30
-
-
-
-
1
-
-
-
52
NF Oregon
Jackson
Grizzly Peak Trailhead, Rogue River NF
Oregon
Josephine
Selmak Lake
Jul-25-2008
42.26207
-123.58508
30
-
-
-
-
-
-
-
19
30
Oregon
Klamath
Diamond Lake, Umpqua NF
Jul-16-2009
43.13683
-122.14285
40
-
22
-
-
-
-
-
1
33
Oregon
Klamath
Lake of the Woods Meadow, 5.33 km
Jul-14-2009
42.38925
-122.21477
60
-
58
-
-
2
-
-
5
75
Jul-23-2008
42.38925
-122.21477
30
-
17
-
-
4
-
-
19
95
NE Mt. McLoughlin Oregon
Klamath
Lake of the Woods Meadow, 5.33 km NE Mt. McLoughlin
Oregon
Klamath
Pinnacles, Crater Lake NP
Jul-15-2009
42.85447
-122.01797
30
-
14
-
-
-
-
-
-
16
Oregon
Lake
Lakeview
Jul-9-2009
42.1836
-120.349
80
-
12
-
-
5
-
-
38
83
Oregon
Lane
Coyote Mtn, 2.78 mi SW, Willamette
Jul-17-2009
43.67344
-122.23879
20
-
-
-
-
-
-
-
5
7
112
NF Oregon
Lane
McCredie Springs, 5.60 km NW,
Jul-16-2009
43.67347
-122.23874
30
-
-
-
-
-
-
-
10
34
Jul-27-2008
45.61957
-123.422
30
-
-
-
-
-
-
-
2
24
Willamette NF Oregon
Tillamook
Tillamook State Forest, 0.77km SE of Idiot Creek Falls
Oregon
Umatilla
Langdon Lake
Jul-23-2009
45.7788
-118.0876
30
-
4
-
-
-
-
-
-
7
Oregon
Umatilla
Langdon Lake, 0.97 km ESE, Umatilla
Jul-23-2009
45.77617
-118.08175
30
-
30
-
-
-
-
-
-
47
NF Oregon
Union
18.73 km SSE LaGrande
Jul-7-2008
45.15691
-118.06347
56
-
4
-
-
-
-
-
-
7
Oregon
Union
Huckleberry Mtn, 4.76 km NNE,
Jul-23-2009
45.65833
-118.02528
10
-
-
-
-
-
-
-
-
15
Jul-8-2008
45.69974
-117.2947
45
-
4
-
-
-
-
-
-
27
Jul-8-2008
45.70638
-117.29303
50
-
15
-
-
-
-
-
-
49
Jul-8-2008
45.33339
-117.29992
30
-
-
-
-
-
-
-
-
4
Jul-11-2009
41.40279
-78.02639
90
-
-
30
38
-
-
1
-
72
Jul-19-2009
40.76025
-77.83848
90
-
-
10
61
-
-
-
-
78
Jul-19-2009
41.37778
-76.83675
90
-
-
1
19
-
-
-
-
49
Umatilla NF Oregon
Wallowa
Wallowa-Whitman NF, 0.89km NW of Hidaway Spring
Oregon
Wallowa
Wallowa-Whitman NF, 1.42km NNW of Hidaway Spring
Oregon
Wallowa
Wallowa-Whitman NF, 2.11km W of Hurricane Point
Pennsylvania
Cameron
Susquehannock Forest, Rt872 (PA09.site01)
Pennsylvania
Centre
Hwy 45 SW of State College (PA09.site03)
Pennsylvania
Lycoming
Wyoming St. Forest (PA09.site02)
113
South
Chesterfield
Chesterfield (SC09.site04)
Jul-11-2009
34.72643
-80.09062
90
-
-
-
45
-
-
-
-
47
Kershaw
N of Boykin (SC09.site03)
Jul-10-2009
34.15635
-80.574271
90
-
-
-
1
-
2
-
-
4
Laurens
Sumter NF (SC09.site02)
Jul-10-2009
34.44358
-81.75544
90
-
-
-
20
-
1
-
-
28
McCormick
nr Buffalo, Sumter Nat Forest
Jul-10-2009
33.94193
-82.36272
90
-
-
-
51
-
-
-
-
52
Carolina South Carolina South Carolina South Carolina
(SC09.site01)
South Dakota
Custer
Santor, 3 mi E, Black Hills NF
Jul-30-2009
43.7072
-103.5605
30
-
4
-
-
-
-
-
-
28
South Dakota
Custer
Hwy 385 Junction with Sidney Park Rd
Aug-1-2008
43.66438
-103.58942
60
-
40
1
-
-
-
-
-
80
(SD08.site02A) South Dakota
Kingsbury
nr DeSmet (SD08.site04)
Aug-5-2008
44.37173
-97.5246
120
-
1
22
1
-
1
-
-
33
South Dakota
Lawrence
between Sturgis & Deadwood
Aug-1-2008
44.38871
-103.6221
60
-
-
-
-
-
-
1
-
15
(SD08.site01) South Dakota
Stanley
nr Pierre (SD08.site03)
Aug-2-2008
44.29068
-100.33306
120
-
-
-
-
-
14
-
-
70
South Dakota
Turner
Hwy 19 nr 289th St (SD08.site05)
Aug-5-2008
43.19209
-97.08081
120
-
-
1
-
-
15
-
-
30
Tennessee
Benton
Hwy 70 near Blackburn Rd
Jul-8-2009
36.01198
-88.06058
90
-
-
-
58
-
1
-
-
77
Jul-14-2009
35.60898
-83.93521
90
-
-
11
11
-
-
-
-
40
(TN09.site02) Tennessee
Blount
Smokey Mtn NP, Abrams Creek camp (TN09.site05)
Tennessee
Cocke
Cherokee NF (TN09.site04)
Jul-14-2009
35.92276
-82.97717
90
-
-
25
5
-
-
-
-
55
Tennessee
Monroe
3mi S of Coker Creek (TN09.site06)
Jul-14-2009
35.24102
-84.31819
90
-
-
15
14
-
-
-
-
33
114
Tennessee
Williamson
S of Nashville (TN09.site03)
Jul-8-2009
35.91622
-86.84485
90
-
-
-
11
-
-
-
-
16
Texas
Bastrop
Hwy290 Elgin (TX09.site03)
Aug-6-2009
30.34797
-97.38469
90
-
-
-
-
-
8
-
-
8
Texas
Eastland
Rising Star (TX09.site02)
Aug-5-2009
32.09948
-98.96429
90
-
-
-
-
-
14
-
-
14
Texas
Galveston
Galveston Island, 1 mi NW of Toll
Jul-16-2008
29.094994
-95.104178
60
-
-
-
-
-
24
-
-
24
Jul-18-2008
29.08681
-95.116798
90
-
-
-
-
-
9
-
-
9
Jul-17-2008
30.67105
-94.71843
90
-
-
-
12
-
5
-
-
47
Jul-14-2008
30.18556
-97.870514
60
-
-
-
-
-
24
-
-
24
Bridge near San Louis Pass (TX08.site03) Texas
Galveston
Galveston Island near Toll Bridge (TX08.site05)
Texas
Polk
Big Sandy Creek, Big Thicket National Preserve (TX08.site04)
Texas
Travis
Austin-Ladybird Johnson Wildflower Center (TX08.site01)
Texas
Travis
1.5 mi west of Elgin (TX08.site02)
Jul-15-2008
30.35093
-97.45035
60
-
-
-
-
-
67
-
-
67
Utah
Box Elder
Clear Creek
aug-29-2007
41.94909
-113.34954
60
-
78
-
-
8
-
-
-
95
Utah
Box Elder
Clear Creek
Jul-1-2008
41.94909
-113.34954
50
-
7
-
-
-
-
-
-
39
Utah
Box Elder
One Mile Fork
Aug-30-2007
41.96012
-113.44881
60
-
36
-
-
1
-
-
-
62
Utah
Box Elder
Sawtooth NF, nr N Mouth of Bull
Aug-15-2008
41.95429
-113.31967
30
-
7
-
-
-
-
-
-
11
Canyon Utah
Cache
Tony Grove Parking Lot
Aug-14-2008
41.89436
-111.64246
30
-
63
-
-
3
-
-
-
80
Utah
Cache
Tony Grove, 0.5 mi N Parking Lot
Aug-10-2007
41.90102
-111.64016
60
-
16
-
-
-
-
-
-
44
Utah
Daggett
3.77 km ESE Sheep Creek Lake
Aug-11-2008
40.8836
-109.8066
30
-
30
-
-
-
-
-
-
54
115
Utah
Daggett
Spirit Lake
Aug-12-2008
40.8429
-109.9965
30
-
3
-
-
-
-
-
-
18
Utah
Garfield
Box Death Hollow Wilderness
Jul-29-2008
37.9648
-111.6546
15
-
-
-
-
-
-
-
-
8
Trailhead Utah
Garfield
Cyclone Lake, 0.9 km S
Jul-29-2008
37.9737
-111.7241
60
-
40
-
-
1
-
-
-
52
Utah
Garfield
Death Hollow, above
Jul-29-2008
37.9794
-111.6059
20
-
44
-
-
8
-
-
-
78
Utah
Garfield
Escalante, 25 km N
Jul-29-2008
37.9344
-111.6924
25
-
9
-
-
-
-
-
-
14
Utah
Garfield
Henry Mountains, Bull Creek Pass
Jul-30-2008
38.0861
-110.8019
60
-
1
-
-
-
-
-
-
50
Utah
Garfield
Henry Mountains, Nasty Flat, 1.1mi
Jul-30-2008
38.0769
-110.8034
40
-
19
-
-
-
-
-
-
66
NE Utah
Garfield
Henry Mountains, Pearl Flat
Jul-30-2008
38.0883
-110.7864
60
-
21
-
-
-
-
-
-
55
Utah
Garfield
Henry Mountains, Pearl Flat, .8 mi
Jul-30-2008
38.1013
-110.7811
40
-
36
-
-
-
-
-
-
51
Jul-30-2008
38.0657
-110.8185
65
-
12
-
-
-
-
-
-
65
NNE Utah
Garfield
Henry Mtns., 0.64km SE of Durfy Butte
Utah
Garfield
Pine Creek
Jul-28-2009
37.9049
-111.6686
25
-
6
-
-
-
-
-
-
9
Utah
Garfield
Posey Lake, 0.5 mi SSE
Jul-29-2008
37.9313
-111.6912
25
-
2
-
-
-
-
-
-
7
Utah
Garfield
The Gap Spring, 0.3 km NW
Jul-29-2008
37.9638
-111.7195
20
-
56
-
-
-
-
-
-
65
Utah
Garfield
Tropic, 16.1 km W
Jul-28-2008
37.5913
-112.2575
64
-
10
-
-
-
-
-
-
43
Utah
SaltLake
Clayton Peak, 1.7 mi NNW
Jul-31-2008
40.6148
-111.5721
20
-
53
-
-
-
-
-
-
60
Utah
Summit
Prospector Avenue, 1.10km E of Park
Aug-26-2008
40.6619
-111.496
30
-
22
-
-
1
-
-
-
69
City
116
Utah
Utah
Soldier Summit, 4.35 km S
Jul-30-2008
39.8938
-111.0527
35
-
19
-
-
4
-
-
-
62
Utah
Wasatch
Guardsman Pass, 0.4 km E
Jul-31-2008
40.6084
-111.5507
20
-
24
-
-
-
-
-
-
54
Utah
Wasatch
Guardsman Pass, 6.06km SSW of Park
Aug-26-2008
40.6099
-111.537
30
-
40
-
-
-
-
-
-
67
Aug-26-2008
40.6065
-111.555
15
-
1
-
-
-
-
-
-
48
Aug-17-2009
40.6065
-111.555
30
-
4
-
-
-
-
-
-
46
City Utah
Wasatch
Guardsman Pass, 7.09km SSW of Park City
Utah
Wasatch
Guardsman Pass, 7.09km SSW of Park City
Utah
Wasatch
Park City, 3.8 mi S
Jul-31-2008
40.6065
-111.5242
16
-
25
-
-
-
-
-
-
49
Utah
Wasatch
Timber Canyon, 3.8 km E Soldier
Jul-31-2008
39.9302
-111.0338
30
-
13
-
-
-
-
-
-
32
Jul-14-2009
42.88843
-72.8616
90
-
-
16
2
-
-
8
-
68
Summit Vermont
Windham
Deerfield Valley Elementary School (VT09.site02)
Vermont
Windsor
0.5 Mi SW of Ludlow (VT09.site01)
Jul-14-2009
43.41441
-72.70551
90
-
-
9
5
-
-
1
-
81
Virginia
Appomattox
Hwy 47 near jcn Hwy 460
Jul-12-2009
37.25568
-78.68094
90
-
-
2
73
-
-
-
-
83
Jul-12-2009
37.51511
-79.70235
90
-
-
5
65
-
-
-
-
102
Jul-12-2009
36.72294
-80.58092
90
-
-
7
53
-
-
-
-
90
(VA09.site04) Virginia
Bodetourt
George Wash NF nr Buchanan (VA09.site03)
Virginia
Carroll
nr Big Reed Island Creek (VA09.site02)
Virginia
Henry
nr Martinsville (VA09.site01a)
Jul-12-2009
36.69
-79.928056
60
-
-
2
39
-
-
-
-
44
Virginia
Scott
Hwy 65 just N or intersection with
Jul-15-2009
36.67487
-82.74692
90
-
-
3
9
-
-
-
-
28
117
US23 (VA09.site05) Washington
Asotin
Anatone, 17 km SE
Jul-8-2008
46.10825
-117.2458
40
-
3
-
-
-
-
-
-
24
Washington
Asotin
Anatone, 18.3 km SE
Jul-8-2008
46.11186
-117.25697
30
-
22
-
-
-
-
-
-
35
Washington
Chelan
Cascade Pass Rd, North Cascades NP
Jul-20-2009
48.48593
-121.0843
30
-
-
-
-
-
-
-
-
13
Washington
Chelan
Cashmere, 18 km N
Aug-2-2008
47.63764
-120.44181
30
-
54
-
-
-
-
-
-
70
Washington
Chelan
Stevens Pass, Cascade Mts.
Aug-1-2008
47.74601
-121.08798
20
-
2
-
-
-
-
-
-
14
Washington
Clallam
Buck Knoll, 0.92 km WNW
Jun-27-2009
48.02908
-123.3351
30
-
-
-
-
-
-
-
-
110
Washington
Clallam
Waterhole
Jun-26-2009
47.94269
-123.42516
25
-
-
-
-
-
-
-
-
10
Washington
Clallam
Weedy Meadow, nr Peninsula College
Jun-27-2009
48.09788
-123.41248
30
-
-
-
-
-
-
-
1
148
Washington
Columbia
Clayton Springs, Umatilla NF
Jul-22-2009
46.09337
-117.87672
15
-
13
-
-
-
-
-
-
35
Washington
King
Radio Hill, 12.17 km WNW,
Jul-19-2009
47.16485
-121.74509
30
-
-
-
-
-
-
-
-
26
Snoqualmie NF Washington
Lewis
Glenoma, 4.92 km ENE
Jul-19-2009
46.53815
-122.10821
30
-
-
-
-
-
-
-
32
41
Washington
Lewis
Silver Creek, 3.2 km W
Jul-31-2008
46.52201
-122.55806
30
-
-
-
-
-
-
-
7
18
Washington
Lewis
White Pass Ski Area, Snoqualimie NF
Jul-20-2009
46.63835
-121.38967
30
-
33
-
-
-
-
-
-
42
Washington
Lincoln
Bachelor Prarie
Jul-21-2009
47.73174
-118.3755
15
-
36
-
-
-
-
-
-
46
Washington
Mason
Lilliwaup, 2.50 km NE
Jun-26-2009
47.4775
-123.08805
10
-
-
-
-
-
-
-
10
17
Washington
Mason
Skokomish, 19 km E
Jul-30-2008
47.35185
-123.32477
25
-
-
-
-
-
-
-
4
13
Washington
Mason
Skokomish, 24 km NE
Jul-30-2008
47.387
-123.3113
30
-
-
-
-
-
-
-
42
60
Washington
Okanogan
Harts Pass 0.5 mi N
Jul-21-2009
48.7247
-120.6636
30
-
17
-
-
-
-
-
-
18
118
Washington
Okanogan
Loup Loup Ski Area, Okanogan NF
Jul-21-2009
48.39298
-119.90317
15
-
36
-
-
-
-
-
-
52
Washington
Pacific
Naselle, .75 km S
Jul-28-2008
46.36125
-123.81525
15
-
-
-
-
-
-
-
1
6
Washington
San Juan
Beaverton Marsh Preserve
Jun-30-2009
48.55015
-123.03194
30
-
5
-
-
-
-
-
-
15
Washington
San Juan
Deer Harbor Preserve
Jun-29-2009
48.62174
-123.00058
30
-
36
-
-
-
-
-
-
51
Washington
San Juan
Hummel Lake
Jun-29-2009
48.51715
-122.89218
30
-
-
-
-
-
-
-
-
41
Washington
San Juan
Lime Kiln Meadows
Jun-30-2009
48.51947
-123.14733
30
-
32
-
-
-
-
-
-
46
Washington
San Juan
Turtleback, Westsound 1.52 km NW
Jun-29-2009
48.64107
-122.97676
30
-
11
-
-
-
-
-
-
57
Washington
San Juan
Weeks Wetland Preserve
Jun-29-2009
48.52285
-122.9149
30
-
-
-
-
-
-
-
-
49
Washington
San Juan
Westside Preserve
Jun-30-2009
48.50639
-123.14064
30
-
25
-
-
-
-
-
1
54
Washington
Skagit
Careys Lake, 0.42 km SE
Jul-20-2009
48.5272
-121.97182
30
-
-
-
-
-
-
-
1
26
Washington
Skagit
Easy Pass Campground, Wenatchee NF
Jul-20-2009
48.58761
-120.8037
20
-
-
-
-
-
-
-
-
13
Washington
Skagit
Golden Horn, 7.96 km ESE,
Jul-20-2009
48.62165
-120.83583
30
-
3
-
-
-
-
-
-
28
Wenatchee NF Washington
Skagit
Rainy Pass, Wenatchee NF
Jul-21-2009
48.51906
-120.73407
30
-
5
-
-
-
-
-
-
38
Washington
Skagit
Silver Star Mtn, 6.53 km SSW
Jul-20-2009
48.59934
-120.54421
20
-
4
-
-
-
-
-
-
28
Washington
Snohomish
Index, 8 km NW
Aug-1-2008
47.86216
-121.49251
30
-
-
-
-
-
-
-
-
30
Washington
Spokane
Hazelwood, 1.27 km ENE
Jul-24-2009
47.63734
-117.56119
15
-
-
-
-
-
-
-
-
11
Washington
Thurston
Delphi, 6.5 air km SE
Jul-30-2008
46.96064
-123.10229
60
-
-
-
-
-
-
-
38
89
Washington
Thurston
Loony House
Jun-25-2009
47.05577
-122.92571
30
-
-
-
-
-
-
-
4
32
Washington
Whitman
Pullman
Jul-22-2009
46.73
-117.17
30
-
-
-
-
-
-
-
-
32
119
Washington
Whitman
Smoot Hill
Jul-9-2008
46.82963
-117.24027
30
-
-
-
-
-
-
-
-
10
Washington
Whitman
Smoot Hill
Jul-22-2009
46.82963
-117.24027
15
-
-
-
-
-
-
-
-
4
Washington
Whitman
Wawawai Bay
Jul-9-2008
46.63453
-117.37771
24
-
-
-
-
-
-
-
-
28
Wisconsin
Dane
Madison (WI08.site01)
Jun-19-2008
43.04103
-89.43149
60
-
-
6
17
-
-
-
-
24
Wisconsin
Dane
University of WI, Madison Arboretum
Aug-7-2008
43.04103
-89.43149
80
-
-
4
57
-
-
-
-
104
Jul-29-2009
43.04103
-89.43149
90
-
-
18
22
-
-
-
-
98
(WI08.site06) Wisconsin
Dane
University of WI, Madison Arboretum (WI09.site01)
Wisconsin
Grant
3 mi W of Hazel Green (WI09.site04)
Jul-30-2009
42.52891
-90.49508
90
-
-
25
29
-
-
-
-
70
Wisconsin
Monroe
2 km w of Wyeville (WI08.site02)
Jun-26-2008
44.02995
-90.42028
90
-
-
13
25
-
-
-
-
60
Wisconsin
Monroe
Hwy 16 east of Sparta (WI08.site04)
Aug-7-2008
43.94267
-90.74896
60
-
-
1
27
-
-
-
-
47
Wisconsin
Monroe
Hwy 16, 1.8 mi W of Sparta
Jul-31-2009
43.9347
-90.84694
90
-
-
4
21
-
-
-
-
82
(WI09.site03) Wisconsin
Sauk
Hwy 13 near I90 (WI08.site05)
Aug-7-2008
43.62648
-89.80605
60
-
-
1
35
-
-
-
-
42
Wisconsin
Sauk
Wisconsin Dells, behingd Polynesian
Jul-29-2009
43.6267
-89.80411
90
-
-
4
60
-
-
-
-
80
Jun-25-2008
43.64215
-89.81106
60
-
-
11
4
-
-
-
-
23
Jul-30-2008
41.32129
-106.15729
120
-
42
-
-
1
-
-
-
73
Aug-7-2009
41.32207
-106.41233
30
-
1
-
-
1
-
-
-
9
Hotel (WI09.site02) Wisconsin
Sauk
Wisconsin Dells, behind Comfort Inn (WI08.site03)
Wyoming
Albany
Medicine Bow NF, Corner Mountain Trailhead (WY08.site01)
Wyoming
Albany
Ryan Park, 7.69 km E, Medicine Bow
120
NF
Wyoming
Albany
Snowy Range, Medicine Bow NF
Aug-7-2009
41.34644
-106.18425
30
-
24
-
-
7
-
-
-
68
Wyoming
Albany
Tuttle Road (WY08.site04)
Jul-31-2008
41.91245
-105.32037
60
-
4
-
-
-
-
-
-
65
Wyoming
Big Horn
Little Bald Mtn, 2.20 km NW
Aug-4-2009
44.76362
-107.75322
15
-
-
-
-
-
-
-
-
17
Wyoming
Big Horn
Medicine Mtn, 1.60 km N, Big Horn
Aug-4-2009
44.80227
-107.90035
30
-
11
-
-
-
-
-
-
103
NF Wyoming
Fremont
Frye Lake, 6.08 km NE
Aug-6-2009
42.74415
-108.81688
30
-
14
-
-
-
-
-
-
34
Wyoming
Fremont
Sinks Canyon Campground, Shoshone
Aug-6-2009
42.73656
-108.83656
30
-
5
-
-
1
-
-
-
8
NF Wyoming
Johnson
Cow Camp Spring, Big Horn NF
Aug-5-2009
44.31898
-106.94241
30
-
9
-
-
-
-
-
-
27
Wyoming
Johnson
Sourdough Creek
Aug-15-2008
44.2413
-106.9864
30
-
24
-
-
-
-
-
-
32
Wyoming
Platte
Glendo State Park (WY08.site02)
Jul-31-2008
42.4831
-105.00698
90
-
-
-
-
-
-
-
-
46
Wyoming
Sheridan
12.39 km WSW of Mutts Meadow
Aug-16-2008
44.7603
-107.5948
15
-
-
-
-
-
-
-
-
21
Wyoming
Sheridan
17.36 km SE Porcupine Falls
Aug-16-2008
44.7595
-107.7414
15
-
-
-
-
-
-
-
-
7
Wyoming
Sheridan
Mutts Meadow
Aug-3-2009
44.7763
-107.4396
30
-
1
-
-
-
-
-
-
5
Wyoming
Teton
0.98 km SSW Grand Targhee Resort
Aug-17-2008
43.7801
-110.963
30
-
65
-
-
-
-
-
-
90
Wyoming
Teton
Harlequin Lake, Yellowstone NP
Jul-29-2009
44.64296
-110.89222
60
-
2
-
-
-
-
-
-
12
Wyoming
Teton
Riddle Lake, Yellowstone NP
Jul-29-2009
44.35918
-110.578
30
-
2
-
-
1
-
-
-
37
Wyoming
Washakie
Bull Creek Campground, Big Horn NF
Aug-5-2009
44.1681
-107.2109
15
-
3
-
-
-
-
-
-
12
Wyoming
Washakie
Powder Ski Area, Big Horn NF
Aug-5-2009
44.16488
-107.2138
30
-
24
-
-
-
-
-
-
37
Wyoming
Washakie
Ten Sleep, 6.87 km W
Aug-5-2009
44.06658
-107.37811
30
-
-
-
-
-
-
-
-
39
121
Wyoming
Weston
Thunder Basin National Grassland
Jul-31-2008
43.75231
-104.58529
30
-
-
-
-
-
-
-
-
17
Jul-31-2008
44.13633
-104.10657
120
-
25
-
-
-
-
-
-
36
Total
22
2760
1033
3128
129
532
31
902
16788
(WY08.site05) Wyoming
Weston
Hwy 85 near SD border (WY08.site06)
Specimens
† Total specimens surveyed at each site for all Bombus species, including non-targets.
122
123
APPENDIX E
Summary of Bombus natural history collection data obtained for analysis of historical distributions and relative abundance. B.
B.
B.
B.
B.
B.
B.
B.
Age range of
No.
Curator(s)
affinis
bifarius
bimaculatus
impatiens
occidentalis
pensylvanicus
terricola
vosnesenskii
specimens
localities
John Ascher
-
1057
-
-
504
-
-
209
1814-2008
326
Shepherd Myer
-
26
-
-
12
-
-
35
1910-1991
28
3
203
-
-
261
-
4
67
1919-2007
269
-
1188
-
-
648
-
847
795
1896-2006
730
-
61
6
1
45
-
-
7
1912-2003
73
E. Richard Hoebeke
309
0
196
990
10
536
953
-
1917-1954
4
Stephen Hendrix
-
-
74
38
-
127
-
-
2002-2005
32
Florida State University
James Wiley
48
-
66
713
-
403
103
-
1905-2007
350
Harvard University
Stefan Cover
203
0
-
-
42
-
250
-
1902-1982
16
Illinois Natural History Survey
Paul Tinnerella
89
453
482
1833
451
1353
-
148
1879-2007
312
Iowa State University
Greg Courtney
8
0
36
127
6
-
3
-
1937-1973
3
Michigan State University
Rufus Isaacs
343
-
259
444
-
392
703
-
1881-1979
473
Mississippi State University
Terence Schiefer
127
-
174
270
-
371
16
-
1909-2008
177
Mike Arduser
-
-
86
238
-
418
-
-
1900-2004
189
Natural history collection American Museum of Natural History† Bernice Pauahi Bishop Museum
Sean Clark, Kimberly Brigham Young University Huntzinger California Academy of Sciences
Norm Penny, Vince Lee David Ward Jr.,
College of Idaho William Clark Cornell University Dr. Stephen Hendrix (University of Iowa)†‡
Missouri Department of Conservation†
124
Montana State University, Bozeman USDA-ARS, National Pollinating Insect Collection Nicole Miller (Washington University, St. Louis)†‡
Michael Rose, Michael -
0
-
-
85
-
-
-
1899-1985
20
10
2265
17
91
764
57
20
2555
1883-2009
1187
-
-
7
-
-
13
-
-
2008
9
Ivie Terry Griswold, Harold Ikerd Nicole Miller, Mike Arduser
North Carolina State University
Andy Deans
95
-
82
543
-
106
-
-
1900-2007
192
Ohio State University†
Andy Michaels
128
-
147
575
-
267
363
-
1902-1995
184
Brenda Smith-Patten
-
-
2
4
-
169
-
-
1926-2004
14
Don Arnold
-
-
4
5
4
222
-
-
1924-1998
65
Christopher Marshall
-
1297
-
-
790
2
23
708
1893-2007
447
-
622
-
-
551
-
-
578
1871-1990
454
47
0
72
301
27
332
202
-
1898-1976
13
-
14
-
-
37
-
-
141
1920-1997
59
Oklahoma Museum of Natural History Oklahoma State Oregon State Arthropod Collection♦ Academy of Naural Sciences, Philadelphia†
Jason Weintraub, Rosemary Malfi
Purdue University
Arwin Provonsha
San Diego Natural History
Pamela Horsley,
Museum
Micahel Wall
San Diego State University
Marshal Hedin
-
2
-
-
-
-
-
23
1926-2007
20
Simon Fraser University
Elizabeth Elle
-
-
-
-
13
-
-
-
1915-1960
9
218
590
40
368
1310
255
314
384
1877-1993
339
8
209
42
91
122
354
28
-
1988-1986
102
Smithsonian Institution♦
David Furth, Sèan Brady
South Dakota State University
Paul Johnson
125
Texas A&M
Ed Riley
-
-
1
9
-
790
-
-
1914-1999
58
University of Arkansas
Jeffrey K. Barnes
-
-
60
81
1
158
-
1
1905-2004
34
University of California,
Cheryl Barr, Robert 135
1202
-
-
825
4
580
3407
1891-2003
572
-
1501
-
-
1085
-
-
2659
1917-2007
1038
Berkeley♦
Zuparko Robbin Thorp, Steve
University of California, Davis Heydon University of Colorado, Boulder♦
Virginia Scott
-
1965
-
-
4
-
-
496
1901-2009
312
University of Georgia
Cecil Smith
92
-
-
-
1
346
36
-
1915-2006
126
University of Idaho
Frank Merickel
-
601
-
-
78
8
2
37
1812-1997
255
-
798
52
43
402
874
-
342
1892-2003
414
281
-
314
510
4
554
856
-
1824-2000
397
145
-
272
246
196
277
669
-
1892-2004
369
Mike Arduser
3
-
121
377
-
159
-
-
1900-2006
107
Kristin Simpson
-
-
15
18
-
52
-
-
1935-1969
48
David Golick
-
0
90
416
73
851
-
-
1898-2000
37
Jeff Knight
-
1
-
-
4
-
-
18
1957-1990
6
Steven Krauth, Dan
209
175
279
533
153
54
294
73
1906-1980
109
University of Kansas†
Michael Engel, Jennifer Thomas
University of Michigan
Mark O'Brien Phillip J. Clausen,
University of Minnesota
Ralph Holzenthal, Elaine Evans
University of Missouri, St. Louis† University of Missouri, Columbia University of Nebraska Plant Industry Division, Nevada Dept of Agriculture University of Wisconsin,
126
Madison
Young
Washington State University
Richard Zack
4
504
-
-
203
-
7
133
1888-1998
255
Yale University†
Lawrence Gall
-
1007
-
-
754
-
-
191
1967-1992
268
2516
19115
3027
8913
10151
9544
6282
14211
Total # of specimens ♦
Specimen records for some species are currently being added into our comprehensive bumble bee database efforts. These museums were not included in our
analysis of historic and current relative abundances. † ‡
Specimen records compiled at least in part from pre-existing databases Personal collection.
127
128
APPENDIX F
Figure F-1. U.S. Environmental Protection Agency (2010) Level III ecoregions of the continental United States (revision of Omernik 1987). U.S. Environmental Protection Agency, National Health and Environmental Effects Research Laboratory, Western Ecology Division, Corvallis, Oregon. (Available in high resolution at ftp://ftp.epa.gov/wed/ecoregions/us/Eco_Level_III_US.pdf).
129
129
130
APPENDIX G
131 Summary statistics for the average of 50 MaxEnt models for each species (Figure C-3). B. occidentalis B. bifarius B. vosnesenskii B. pensylvanicus B. bimaculatus B. impatiens B. affinis B. terricola
Localities 1087 1257 750 1058 482 1094 379 437
Average test AUC (s.d.) 0.893 (0.010) 0.849 (0.009) 0.880 (0.008) 0.731 (0.015) 0.808 (0.014) 0.813 (0.009) 0.907 (0.010) 0.918 (0.009)
132
APPENDIX H
133
Summary of Bombus individuals collected in 2010 in Washington, Oregon and Northern California. Each pie (i.e. circle) represents the relative abundance of the target species (yellow) to the Bombus community surveyed (orange). Size of pie represents survey effort (i.e. larger circle reflects greater survey effort). (A) B. bifarius, (B) B. occidentalis and (C) B. vosnesenskii.
133